Categories
Forex Elliott Wave Forex Market Analysis

AUDUSD Consolidates its Gains Expecting the US Employment Data Ahead

The price of AUDUSD reached a fresh yearly high at 0.74496 on the Thursday trading session expecting the last employment data release of the year for the US labor market corresponding to November. 

(Source: tradingeconomics.com)

Technical Overview

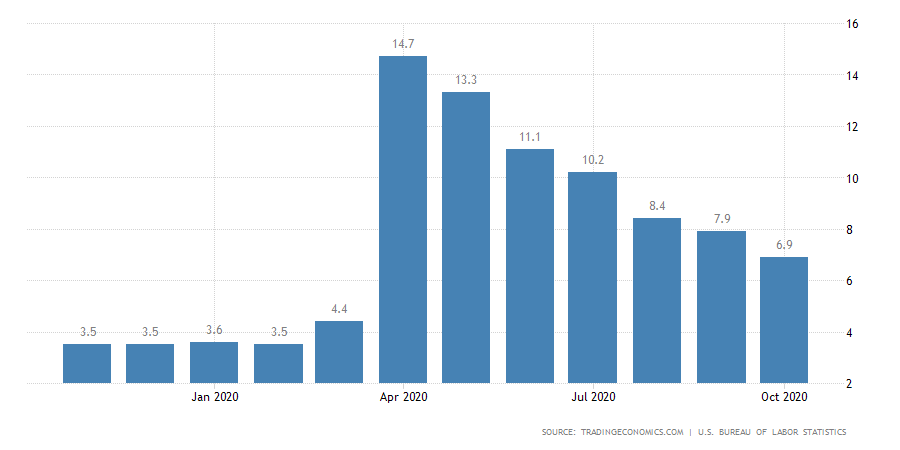
This year, as illustrated in the previous chart, Australia’s unemployment rate peaked at a record high of 14.7% in April, mainly boosted by the coronavirus lockdown. In this context, the analysts’ consensus expects the unemployment to drop to 6.8% for November, from 6.9% reported last October.

The mid-term Elliott wave perspective displayed in the 12-hour chart below reveals the upward progression in an incomplete five-wave sequence of Minor degree labeled in green. This bullish impulsive move began on March 18th when the Aussie found fresh buyers at 0.55063.

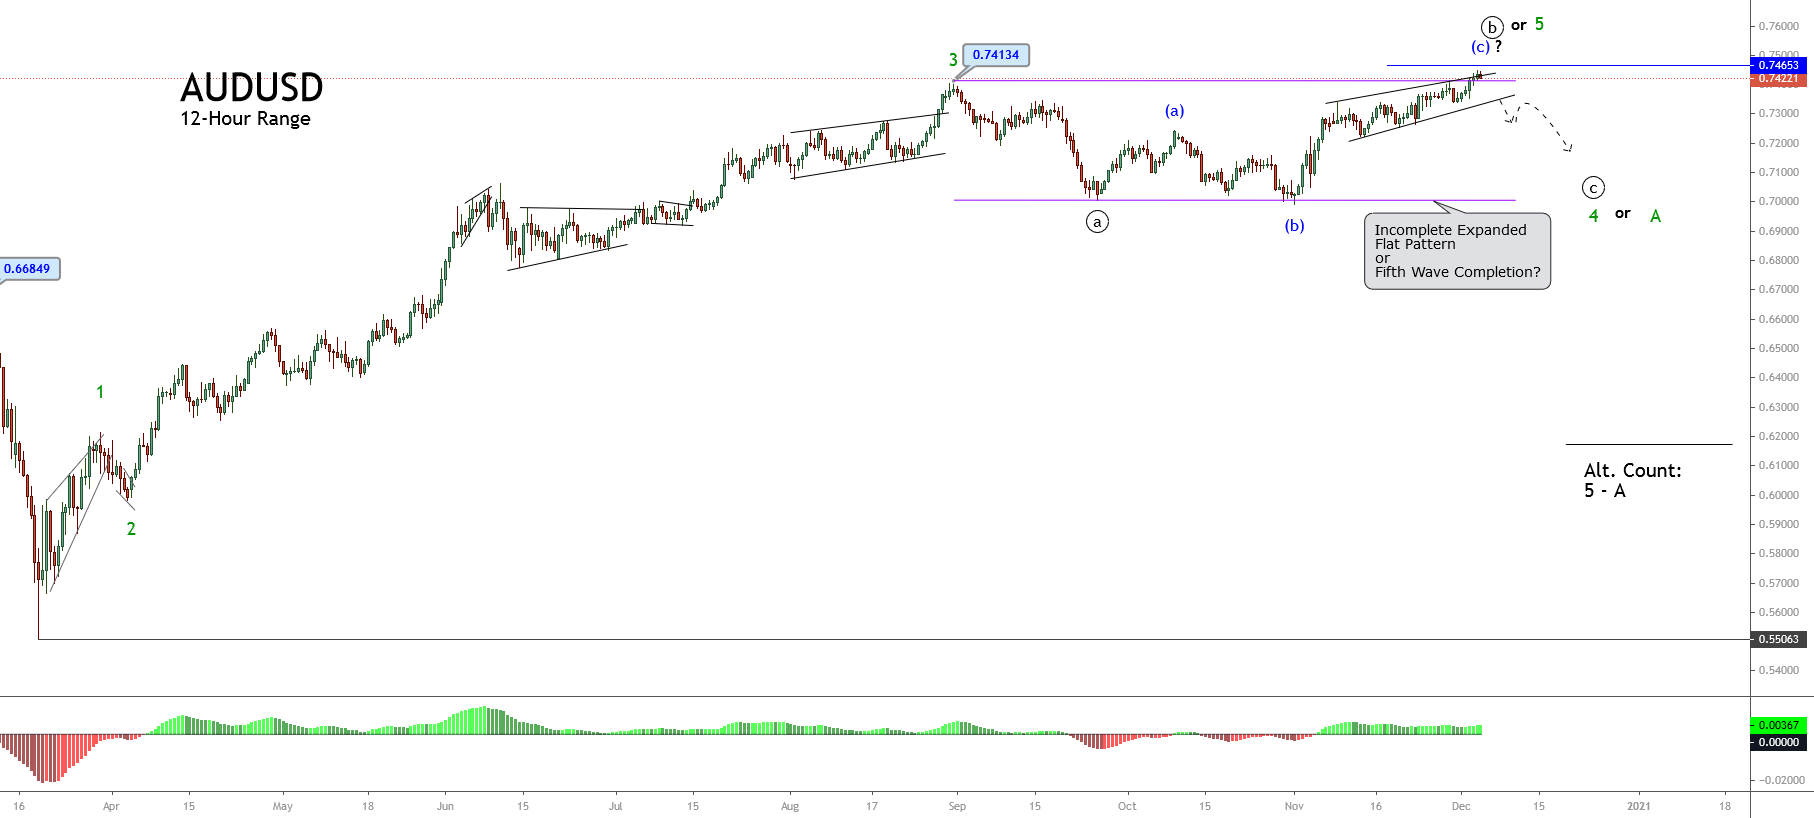
The previous chart also shows the Aussie’s advance in a third extended wave, suggesting that the price action could be moving in its fourth wave in green, still in development. 

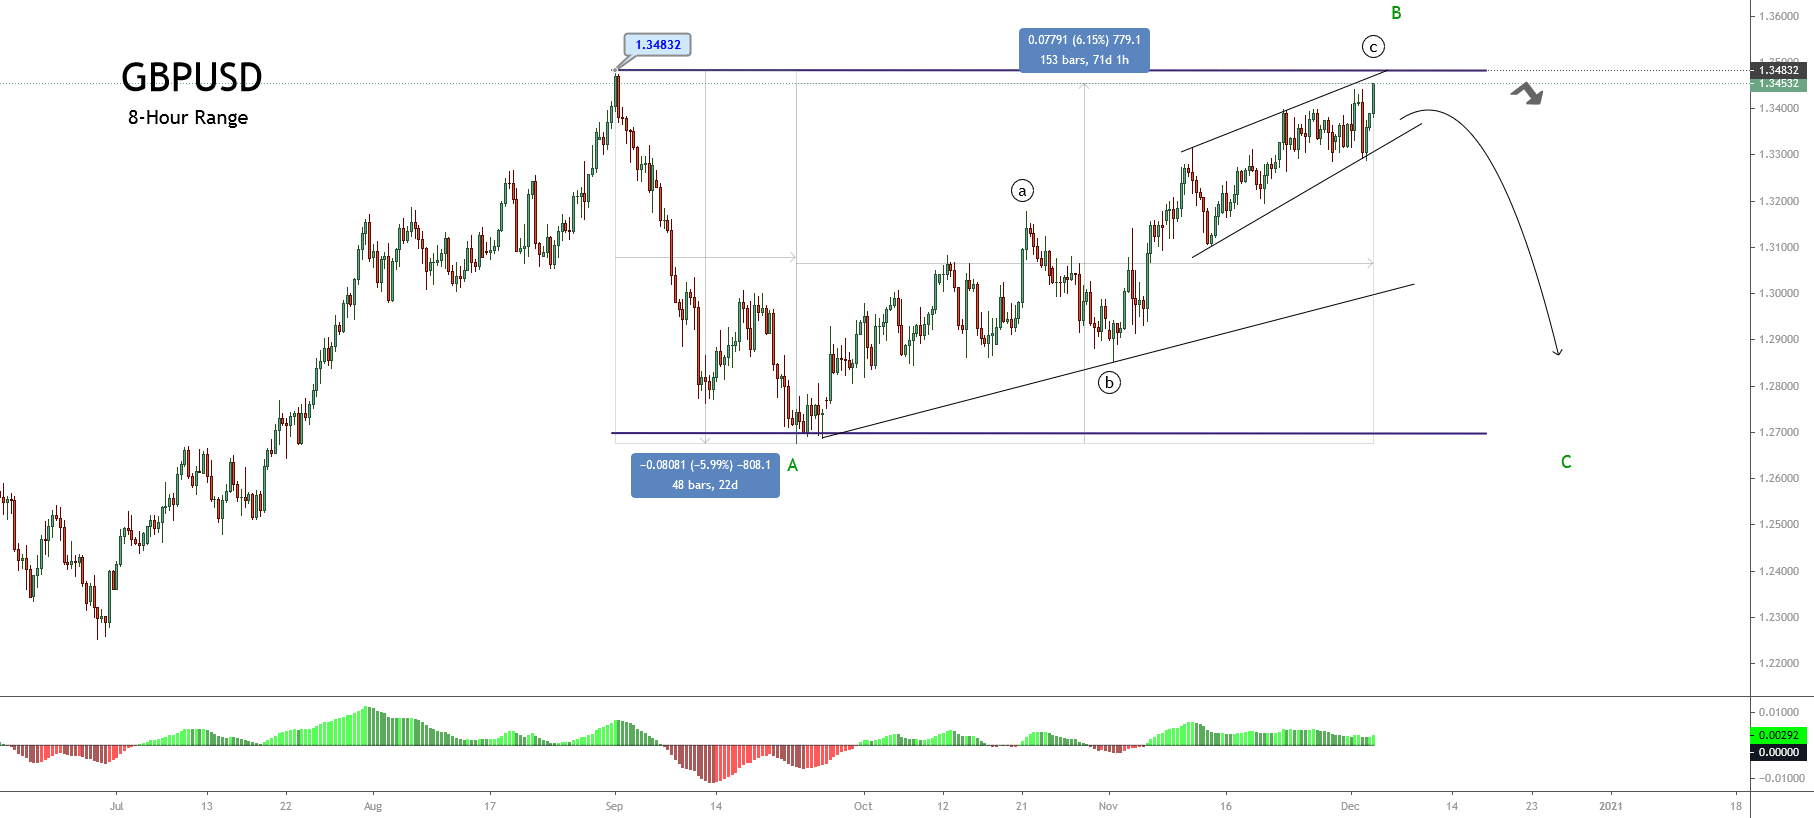
This scenario considers that the Aussie moves in its internal wave (c) of Minuette degree labeled in blue, developing an ending diagonal pattern. Likewise, the wave of the upper degree corresponding to wave ((b)) of Minute degree identified in black should correspond to an expanded flat pattern, and the price should realize a new decline,

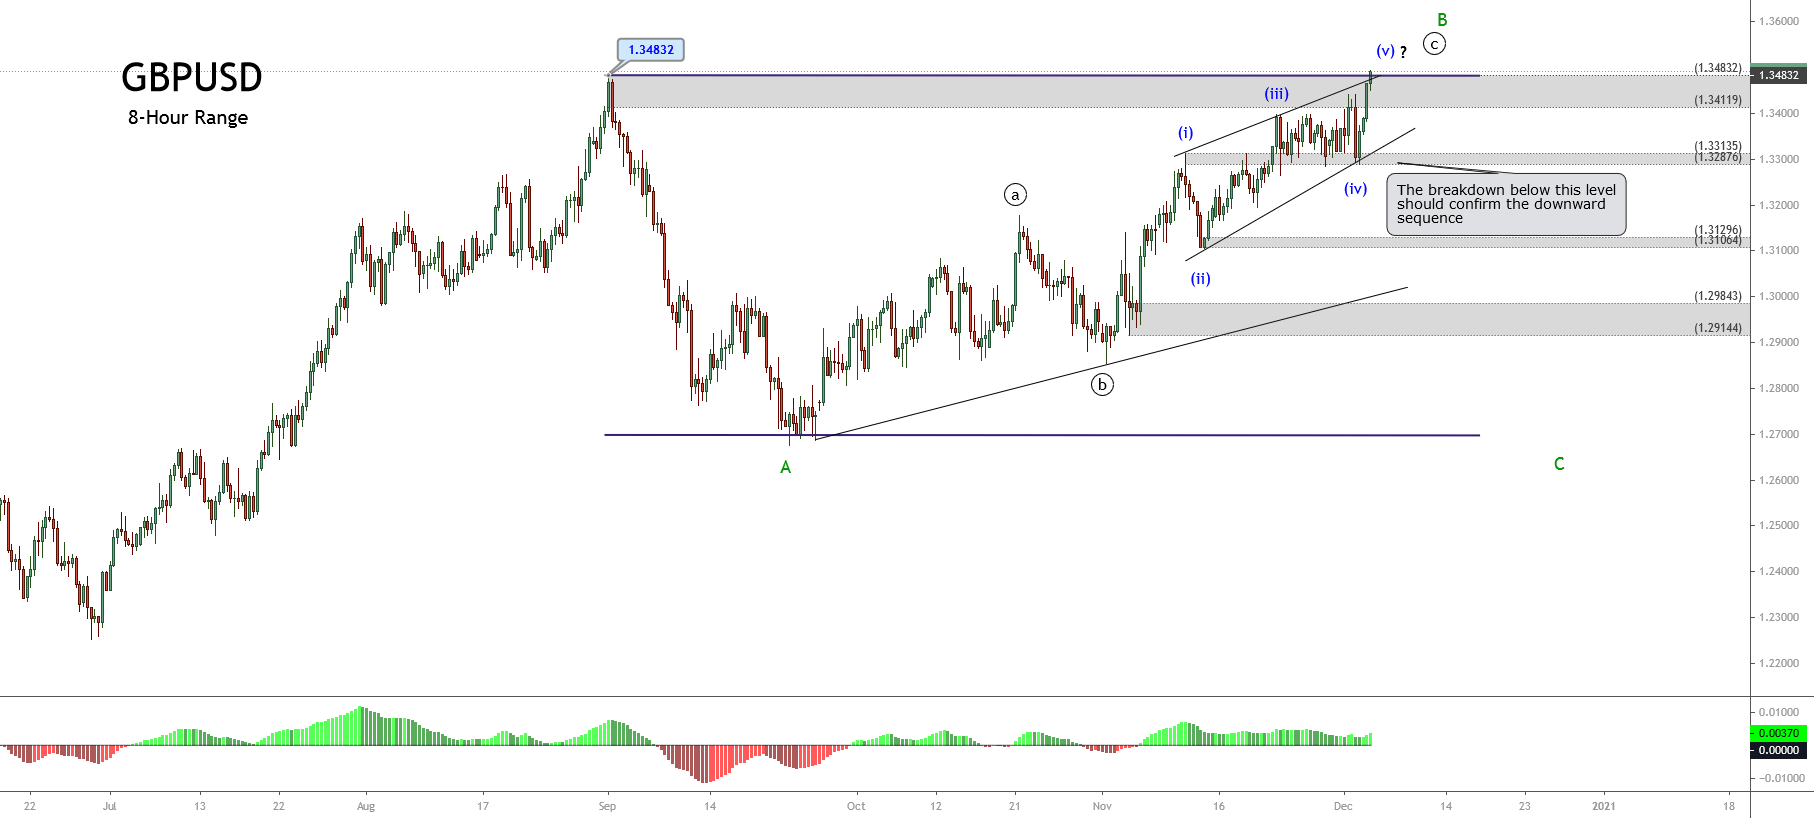
The alternative count considers the advance in the fifth wave of Minor degree in green is developing an internal ending diagonal pattern. In this case, the Aussie should start a decline corresponding to wave A in green.

Technical Outlook

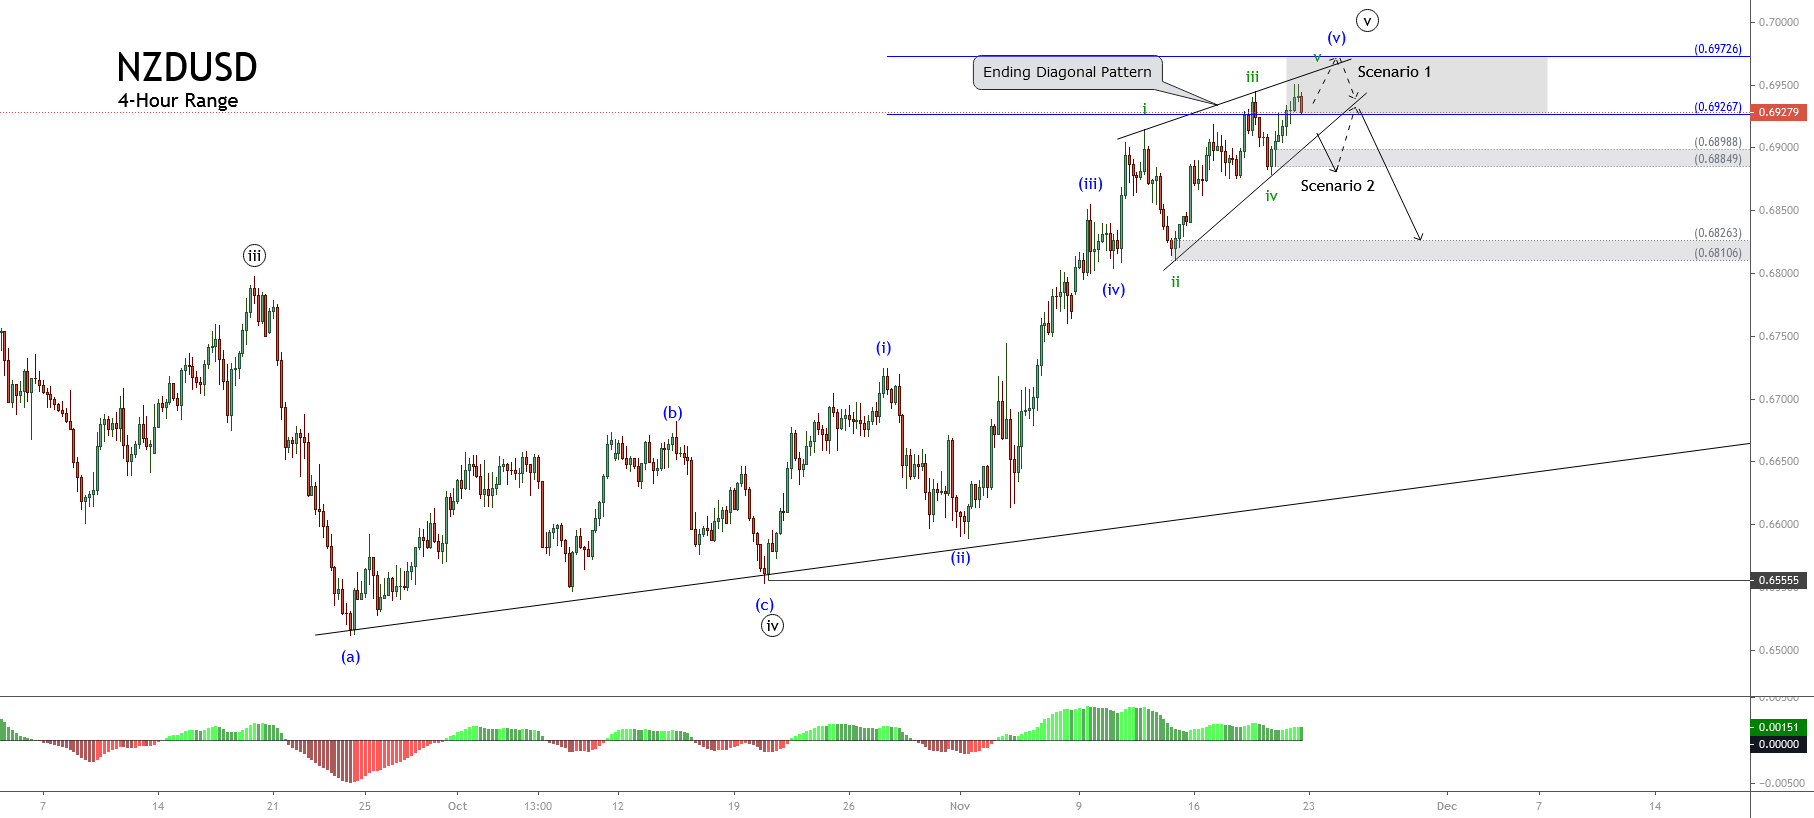
The short-term Elliott wave for AUDUSD exposed in its 4-hour chart shows the advance in an ending diagonal pattern, which looks developing its fifth wave of Subminuette degree labeled in green.

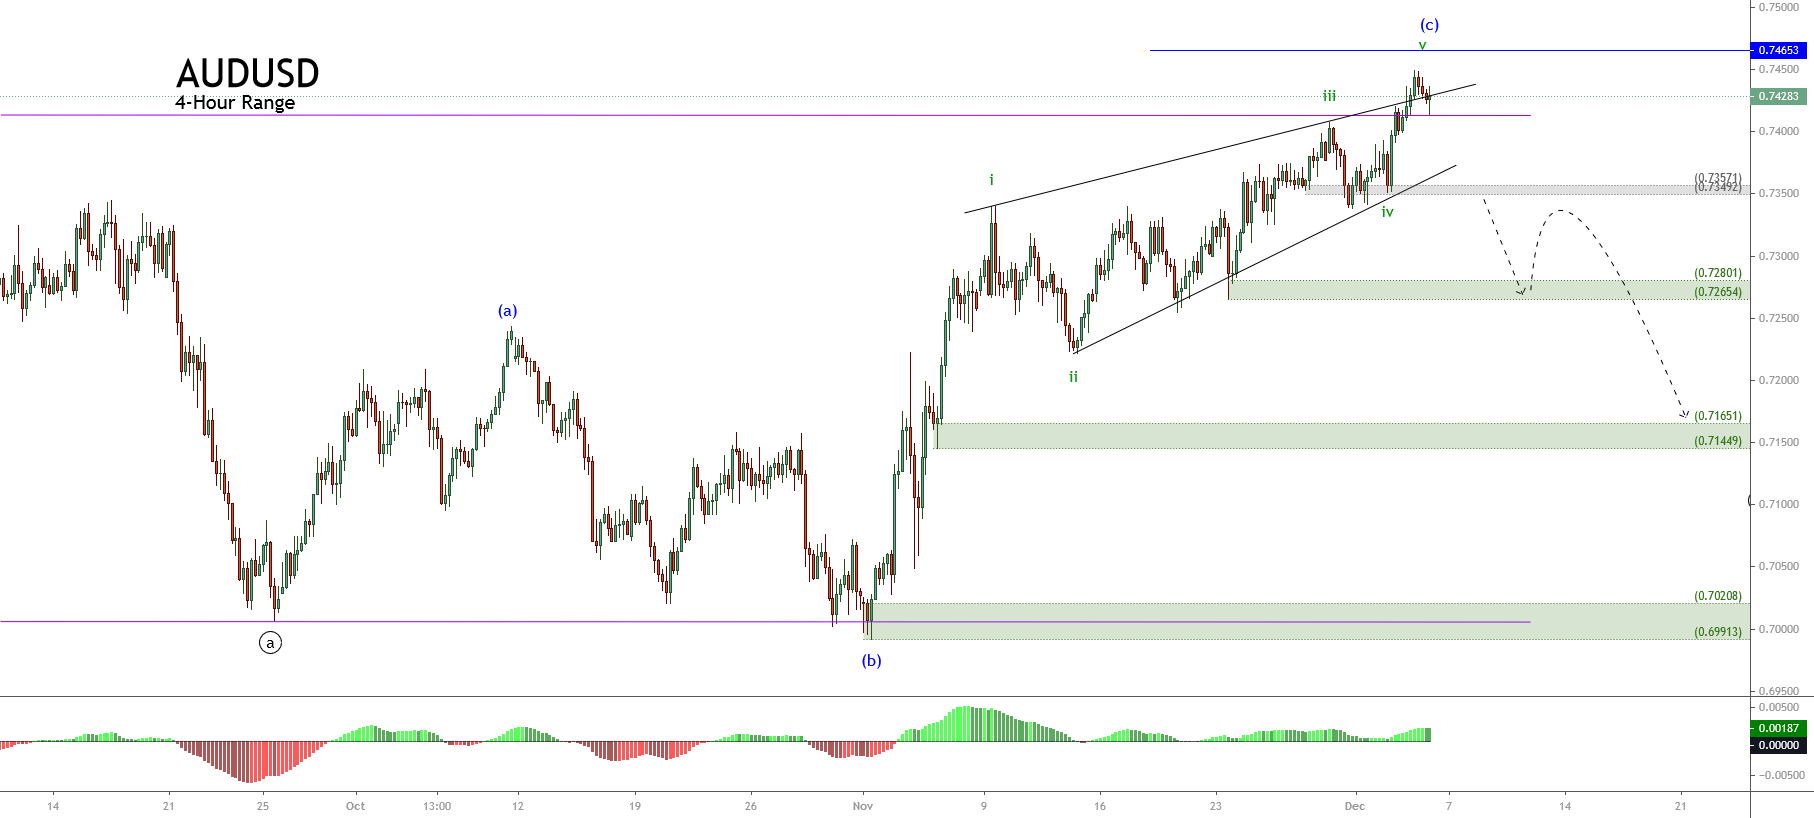
Although the ending diagonal pattern suggests completing the fifth wave or wave (c), the Aussie must confirm its completion through the breakdown of its base-line that connects the waves ii and iv, in green. Also, the price should confirm the close below the intraday demand zone between 0.73492 and 0.73571.

Finally, if the price confirms its downward correction, the potential target area for this movement is from 0.7265 and 0.7144. If the area fails to hold, and the bearish pressure extends this downward movement, the Aussie could visit the base of its sideways channel on the psychologically key level of 0.70.

Categories
Forex Elliott Wave Forex Market Analysis

Is GBPUSD Preparing a Reversal Move?

The GBPUSD pair is seen advancing in an ending diagonal pattern inside an incomplete flat pattern of Minor degree, identified in green, which is in progress since September 01st when the Sterling found resistance 1.34832. 


Technical Overview

The previous 8-hour chart exposes the advance in a potential flat pattern (3-3-5), which currently develops its wave B of Minor degree identified in green. In this context, once the current corrective rally ends, the next potential move, according to the Elliott Wave theory, could correspond the wave C. This movement should follow an internal structure subdivided into five wave segments.

Analyzing wave B’s internal structure, currently, we see the price advancing in its wave ((c)) of Minute degree labeled in black. In this context, according to the textbook, the pattern identified in the current wave ((c)) has the shape of an incomplete ending diagonal pattern.

On the other hand, looking at the price and time relationship presented in the first chart, it is interesting to compare the elapsed time of the current wave B with wave A. This comparison suggests that the current wave B can be thought of as a corrective rally; thus, the next move could become an aggressive decline. 

Nevertheless, considering that the current wave B remains in progress, the short-term bias is still on the bullish side.

Technical Outlook

The next 8-hour chart shows the GBPUSD advance in its fifth wave of Minuette degree, labeled in blue, which belongs to the wave ((c)), in black, suggesting a terminal movement.

In this context, the price’s test of the upper sideways channel trendline suggests that the Pound Sterling could develop an expanded flat pattern. This Elliott Wave pattern’s implication makes us consider a strike over the origin of wave A located at 1.34832, where the pair should start to decline, developing its wave C in green.

Finally, both the ending diagonal pattern and the expanded flat pattern requires the pair to confirm the breakdown below the demand zone between 1.33135 and 1.32876. If the pair’s price action confirms this breakdown, it could move down up to the level of 1.29144.

Categories
Forex Elliott Wave Forex Market Analysis

NZDUSD Reaches a Fresh 90-Day High

The NZDUSD pair ends the last trading week reaching its seventh fresh 90-day range high soaring to 0.69507. This advance brought the Oceanic currency to a close in the extreme bullish sentiment zone. 

Technical Overview

The next chart unveils the NZDUSD pair in its 8-hour timeframe, which shows the market participants’ sentiment in the 90-day high and low range. The figure illustrates the previous 90-day high and low range located at 0.67978 from September 18th. In this regard, the latest rally started on November 02nd created seven fresh 90-day highs.

On the other hand, the EMA(60)-to-Close index shows a bearish divergence that suggests both the bullish trend’s exhaustion and the price’s potential reversion to the moving average. However, a price breakdown and close below the recent lows is needed to confirm the current bullish trend’s correction.

Short-term Technical Outlook

The short-term view of the NZDUSD cross displayed under the Elliott Wave perspective reveals the intraday upward movement advancing in an incomplete Ending diagonal pattern of Minuette degree labeled in blue. Likewise, the advance of the fifth wave in blue should correspond to the ending of the fifth wave of Minute degree identified in black. Nevertheless, the Elliott Wave formation still doesn’t confirm it.

The next4-hour chart reveals the bullish sequence developed by the NZDUSD pair since October 20th when the kiwi found fresh buyers at 0.65555. Until now, the price action advanced in an incomplete upward five-wave sequence, which reached the potential target zone forecasted in a previous analysis.

According to Elliott wave theory, the Ending Diagonal pattern follows an internal sequence subdivided into 3-3-3-3-3 waves. In this context, the previous chart exposes the terminal formation of the bullish impulsive structure advancing in its fifth wave of Subminuette degree labeled in green, which provides two potential scenarios.

  • First Scenario: The price breaks below the base-line that connects the waves ii and iv, confirming the end of the Ending Diagonal pattern and starting a corrective upper degree structure.
  • Second Scenario: The price advances slightly over last Friday’s high and starts to decline below the base-line between waves ii-iv, from where the NZDUSD should begin to develop a correction of upper degree.

In both scenarios, the confirmation of the ending diagonal completion comes from the breakdown and closing below the base-line that connects the end of waves ii and iv.

Finally, the downward scenario will have its invalidation level once the ending diagonal pattern confirms its completion.

Categories
Forex Signals

GBPAUD Advances in an Ending Diagonal Pattern

Description

The GBPAUD cross, in its hourly chart, advances in a downward structure that follows the Elliott wave sequence as an ending diagonal pattern, which suggests a potential scenario of upside.

According to the textbook, the ending diagonal pattern is a structure that reflects the exhaustion of the trend, and its reversion would be imminent.

Currently, the price action advances below the lower guideline of the diagonal pattern, which warns us about the potential bearish failure continuation.

Our bullish scenario considers the long-side entry in the current area, looking for the upward move until the previous consolidation area at 1.8998. Our upward outlook considers the invalidation level at 1.87187

Chart

Trading Plan Summary

Categories
Forex Elliott Wave

Trading the Elliott Wave Principle – Part 2

Wave five is the last movement in the direction of the trend. In this educational article, we will review two ways to trade the fifth wave.

Trend following

The first choice to trade the fifth wave is looking to join the primary trend. The following chart shows the trading setup.

There are two ways to place the order. The first option is following the retracement of a wave 4, which could extend from the Fibonacci levels 23.6% to 50%. The second option is to wait for the breakout and close above wave B of wave four.

For the invalidation level placement, we have to remember the Elliott Wave rule “wave four never end in the territory of wave one.”

To define the profit target levels, we use the Fibonacci projection from waves 3 and 4. In this case, the first target will be at 61.8%, the second at 78.6%, and the third target at 100%.

In some cases, if wave three is the extended wave, there is the possibility that wave five has the same extension that wave one.

Ending diagonal pattern

The second alternative to trade the fifth wave is when the price action builds an Ending diagonal pattern. In this case, we have two options to enter the market. The first one is to place the order after the breakdown of the lower trendline. The second one is after the close under the swing of wave 4.

The invalidation level is above the wave 5, and the profit target is at the end of wave 2.

The fifth wave in the real market

The next chart corresponds to PayPal Holdings (NYSE:PYPL) in its 8-hour timeframe. PYPL developed a rally from the Christmas 2018 low at $76.70 per share.

From the bullish cycle, we observe the wave three and the retracement developed by wave 4. PYPL retraced until the Fibonacci level 38.2%. In this sense, we can look for long positions from 23.6% until 50% of the Fibonacci retracement.

The price action drove to PYPL until 61.8% of the Fibonacci projection at $121.48 on July 16, 2019. As can be noted, PayPal Holdings started to decline once it reached the highest level of the year.

The invalidation level could be placed on two different levels. The first one is at the end of wave one at $94.59. The second alternative is at the 61.8% of the Fibonacci retracement at $97.34 per share.

The next weekly chart corresponds to the e-mini NASDAQ futures (CME:NQ). In this example, we observe an ending diagonal structure.

The sell position could be placed in two different ways, after the lower trendline, or once the price closes below the end of wave 4. Finally, NQ dropped until the bearish target at the end of wave 2 at 1,457.75 pts.

Categories
Forex Elliott Wave

Impulsive Waves Construction – Part 4

A diagonal is an impulsive pattern, but it is not an impulse. That is because Diagonals have the characteristics of corrective waves. In this article, we will explain the aspects of the diagonal formations.

Diagonal Pattern Structure

Diagonal patterns share rules of both impulsive and corrective waves. Even when, as a motive wave, wave 3 is never the shortest, in the diagonal pattern, wave 4 can enter the territory of wave 1. There are two main types of diagonals, leading diagonal and ending diagonal. The following figure shows these two cases.


Ending diagonal

This impulsive pattern develops mainly in a fifth wave, especially when the market has made a significant advance in time. The internal structure corresponds to a 3-3-3-3-3 sequence. In this formation, wave 1 and 4 may or may not overlap. However, this is not an exclusive requirement. It has also been observed that internal wave 3 is the most extended.

The following example corresponds to the mini NASDAQ index (NQ) futures on the weekly timeframe and semilog scale. The bullish motive sequence began in September 2002 until the end of October 2007. In the figure, we observe the progress made by the price over the upper line of the diagonal. Once the price surpassed it, NQ started a corrective movement that ended in October 2009.


Leading diagonal

This type of impulsive wave can appear in both a wave 1 and an A wave. Its internal structure can be 5-3-5-3-5 or 3-3-3-3-5. In the main diagonal, wave 1 and 4 can overlap. However, this is not a mandatory requirement. Also, there is a possibility that the diagonal formation is expansive rather than contractive.

In some cases, in the ending diagonal pattern, we can observe the truncation of wave five. The following Dollar Index (DXY) weekly chart shows a leading diagonal and an ending diagonal from where wave 5 is truncated.