The price of AUDUSD reached a fresh yearly high at 0.74496 on the Thursday trading session expecting the last employment data release of the year for the US labor market corresponding to November.
 (Source: tradingeconomics.com)
Technical Overview
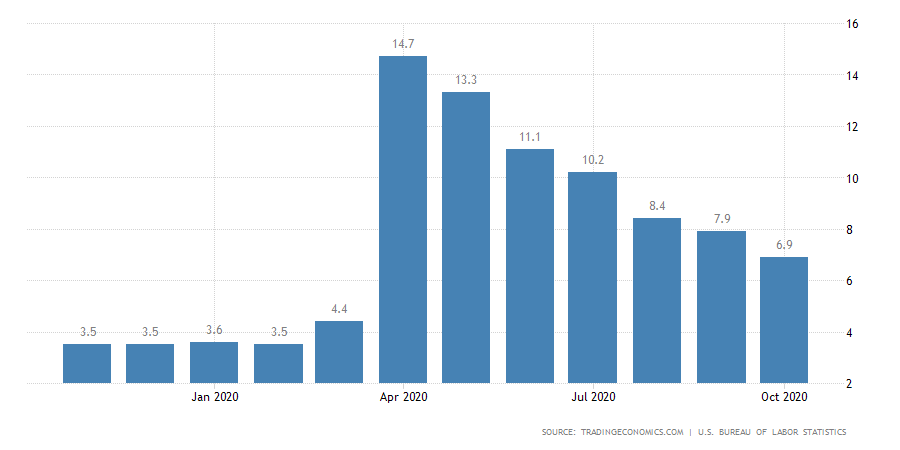
This year, as illustrated in the previous chart, Australia’s unemployment rate peaked at a record high of 14.7% in April, mainly boosted by the coronavirus lockdown. In this context, the analysts’ consensus expects the unemployment to drop to 6.8% for November, from 6.9% reported last October.
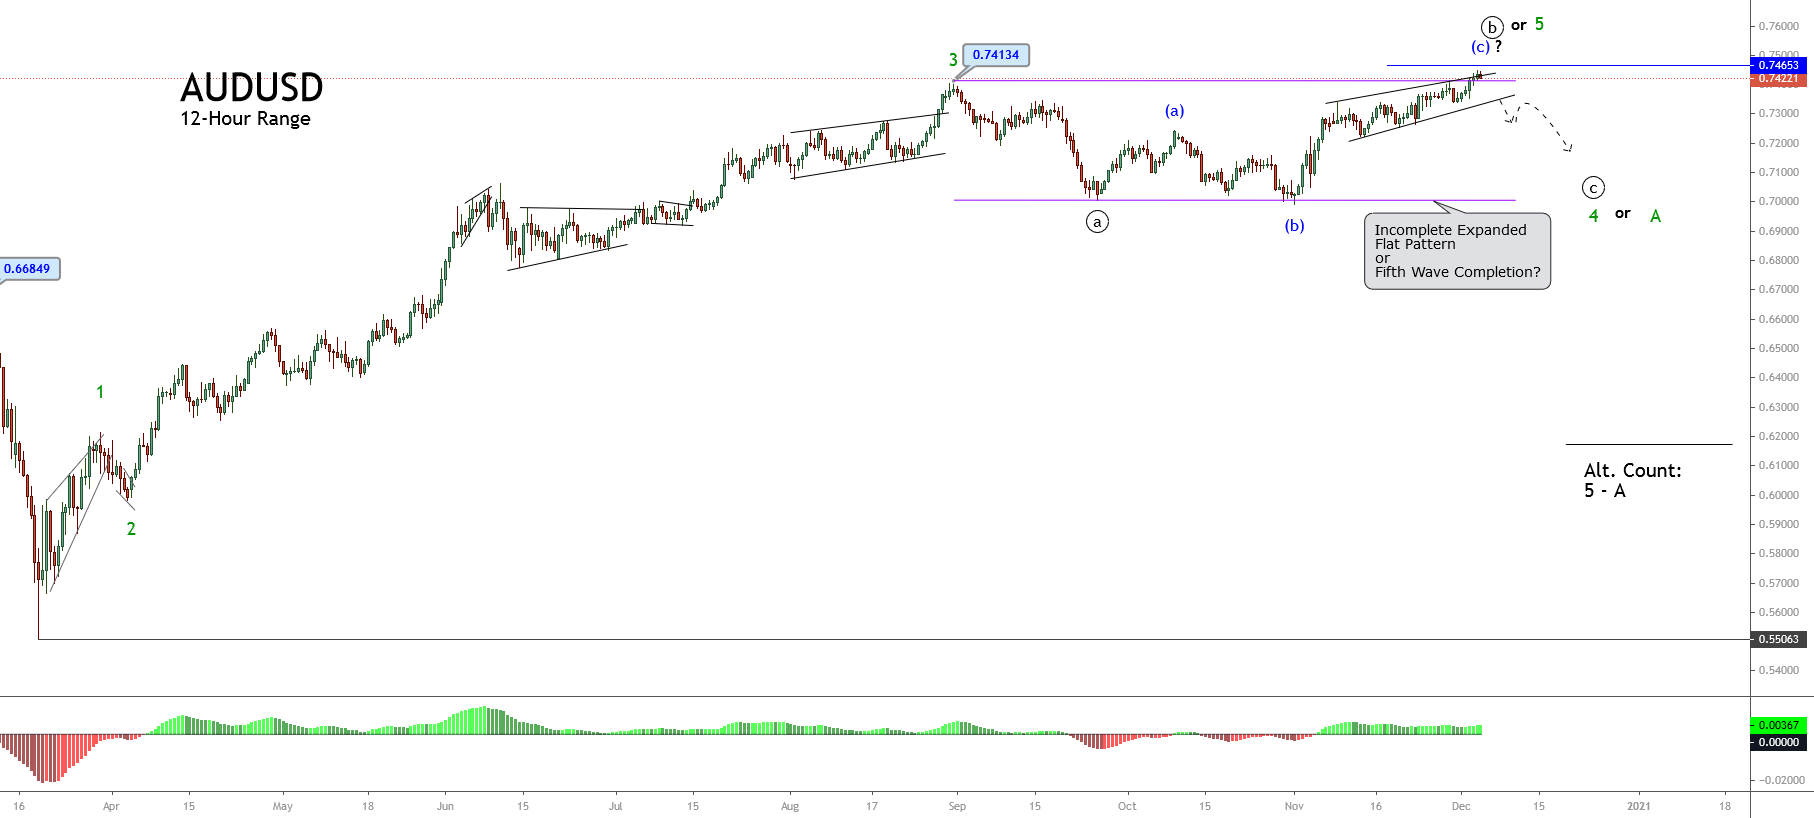
The mid-term Elliott wave perspective displayed in the 12-hour chart below reveals the upward progression in an incomplete five-wave sequence of Minor degree labeled in green. This bullish impulsive move began on March 18th when the Aussie found fresh buyers at 0.55063.
The previous chart also shows the Aussie’s advance in a third extended wave, suggesting that the price action could be moving in its fourth wave in green, still in development.
This scenario considers that the Aussie moves in its internal wave (c) of Minuette degree labeled in blue, developing an ending diagonal pattern. Likewise, the wave of the upper degree corresponding to wave ((b)) of Minute degree identified in black should correspond to an expanded flat pattern, and the price should realize a new decline,
The alternative count considers the advance in the fifth wave of Minor degree in green is developing an internal ending diagonal pattern. In this case, the Aussie should start a decline corresponding to wave A in green.
Technical Outlook
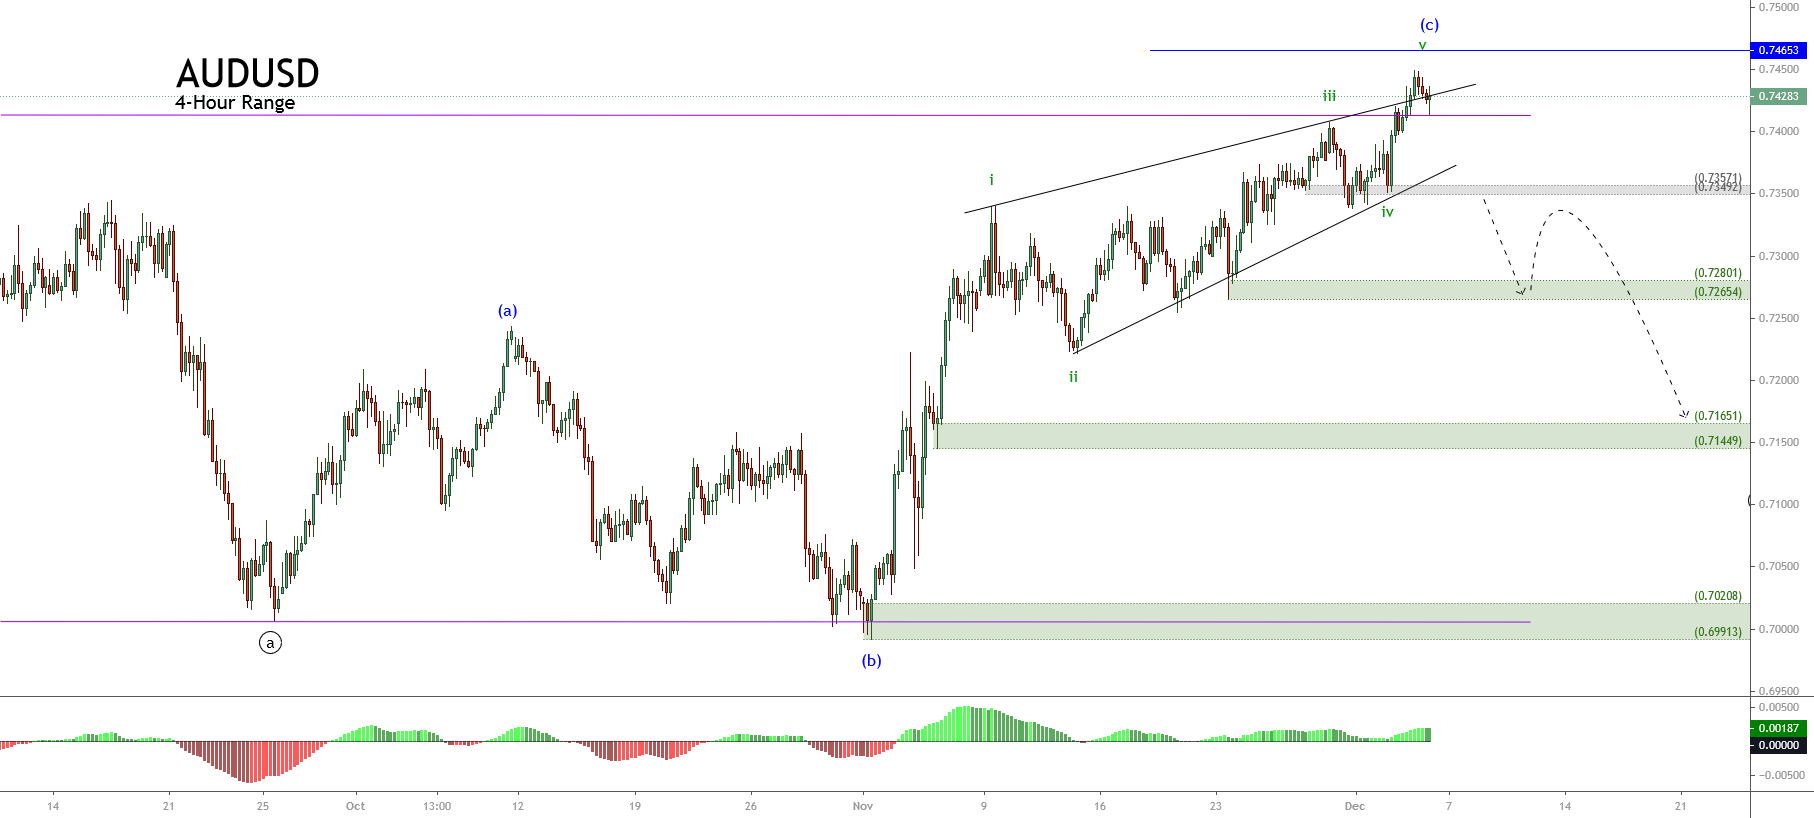
The short-term Elliott wave for AUDUSD exposed in its 4-hour chart shows the advance in an ending diagonal pattern, which looks developing its fifth wave of Subminuette degree labeled in green.
Although the ending diagonal pattern suggests completing the fifth wave or wave (c), the Aussie must confirm its completion through the breakdown of its base-line that connects the waves ii and iv, in green. Also, the price should confirm the close below the intraday demand zone between 0.73492 and 0.73571.
Finally, if the price confirms its downward correction, the potential target area for this movement is from 0.7265 and 0.7144. If the area fails to hold, and the bearish pressure extends this downward movement, the Aussie could visit the base of its sideways channel on the psychologically key level of 0.70.


