Categories
Forex Elliott Wave Forex Technical Analysis

EURGBP Soars!, More Gains Ahead?

The EURGBP cross soared on Friday session, surpassing the psychological 0.92 barrier, advancing until the target area forecasted in our previous short-term analysis (here.)

Technical Overview

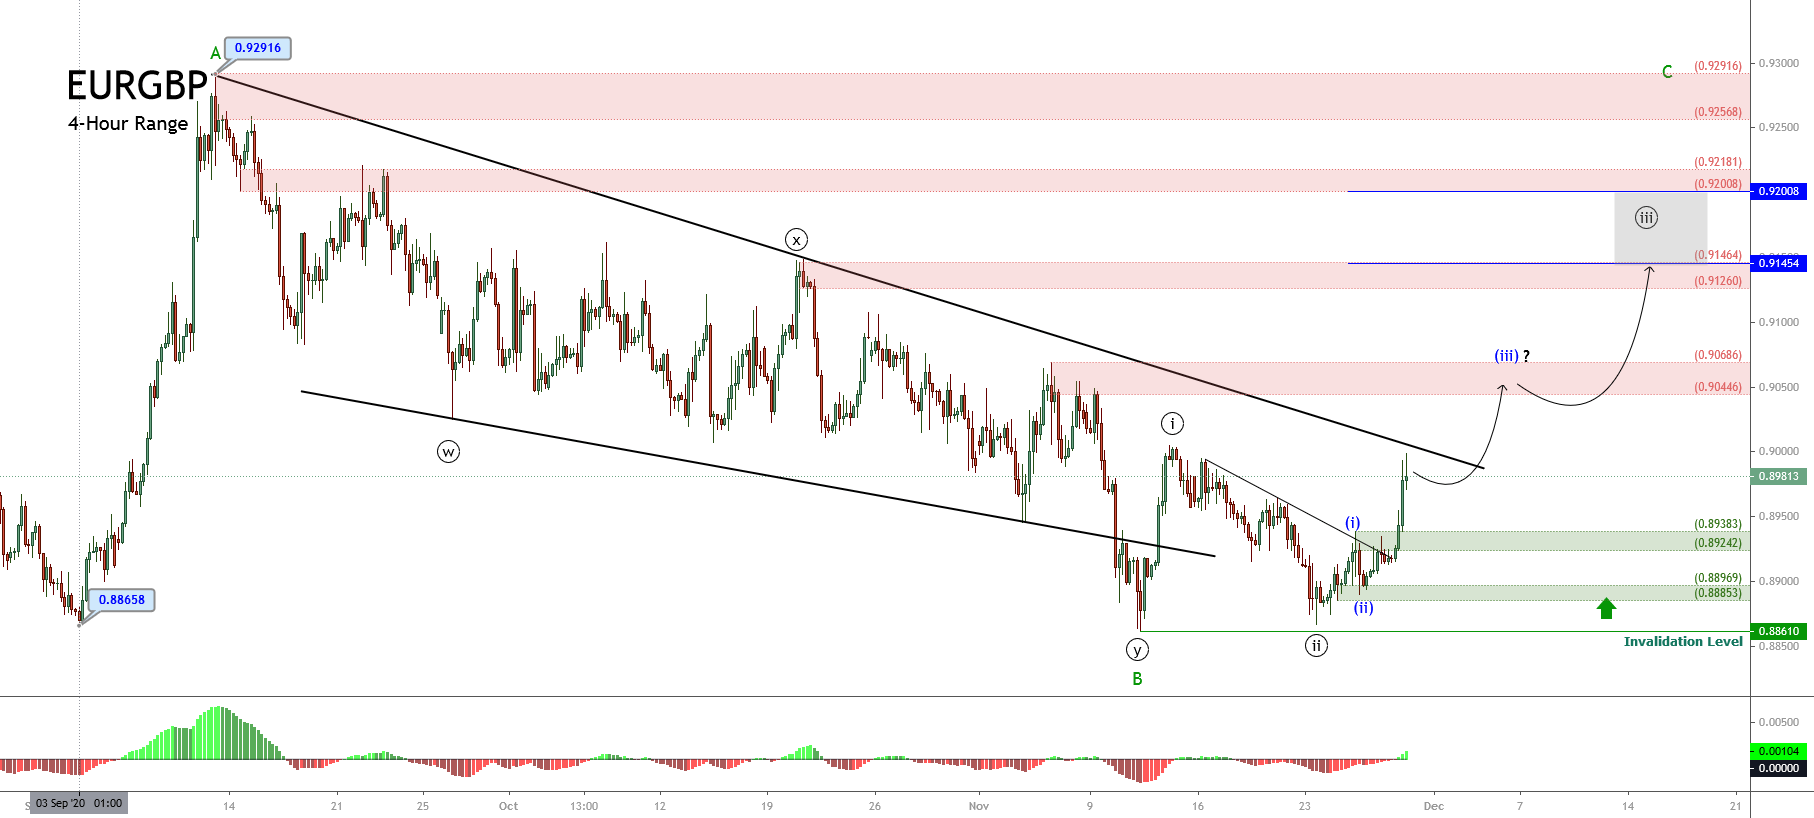
Our previous analysis discussed the completion of the complex corrective formation identified as a double-three pattern of Minute degree labeled in black, which began on last September 11th at 0.92916 and finished on November 11th at 0.88610. Likewise, after the double-three completion, the cross completed the wave B of Minor degree identified in green.

Once the EURGBP found the bottom at 0.88610, the cross began a rally corresponding to wave C. We have seen in our previous analysis the price completed wave ((ii)) at 0.88667 on November 23rd. After this completion, both the breakout of the descending trendline of the second wave in black and the strong bullish long-body candlestick formation developed in the November 27th session confirmed the start of the third wave in black.

Technical Outlook

During the last trading session of the week, the short-term Elliott wave view for the EURGBP cross exposed in the following 8-hour chart reveals the acceleration in its advance, which surpassed the supply zone between 0.92008 and 0.92181, finding resistance at 0.92298.

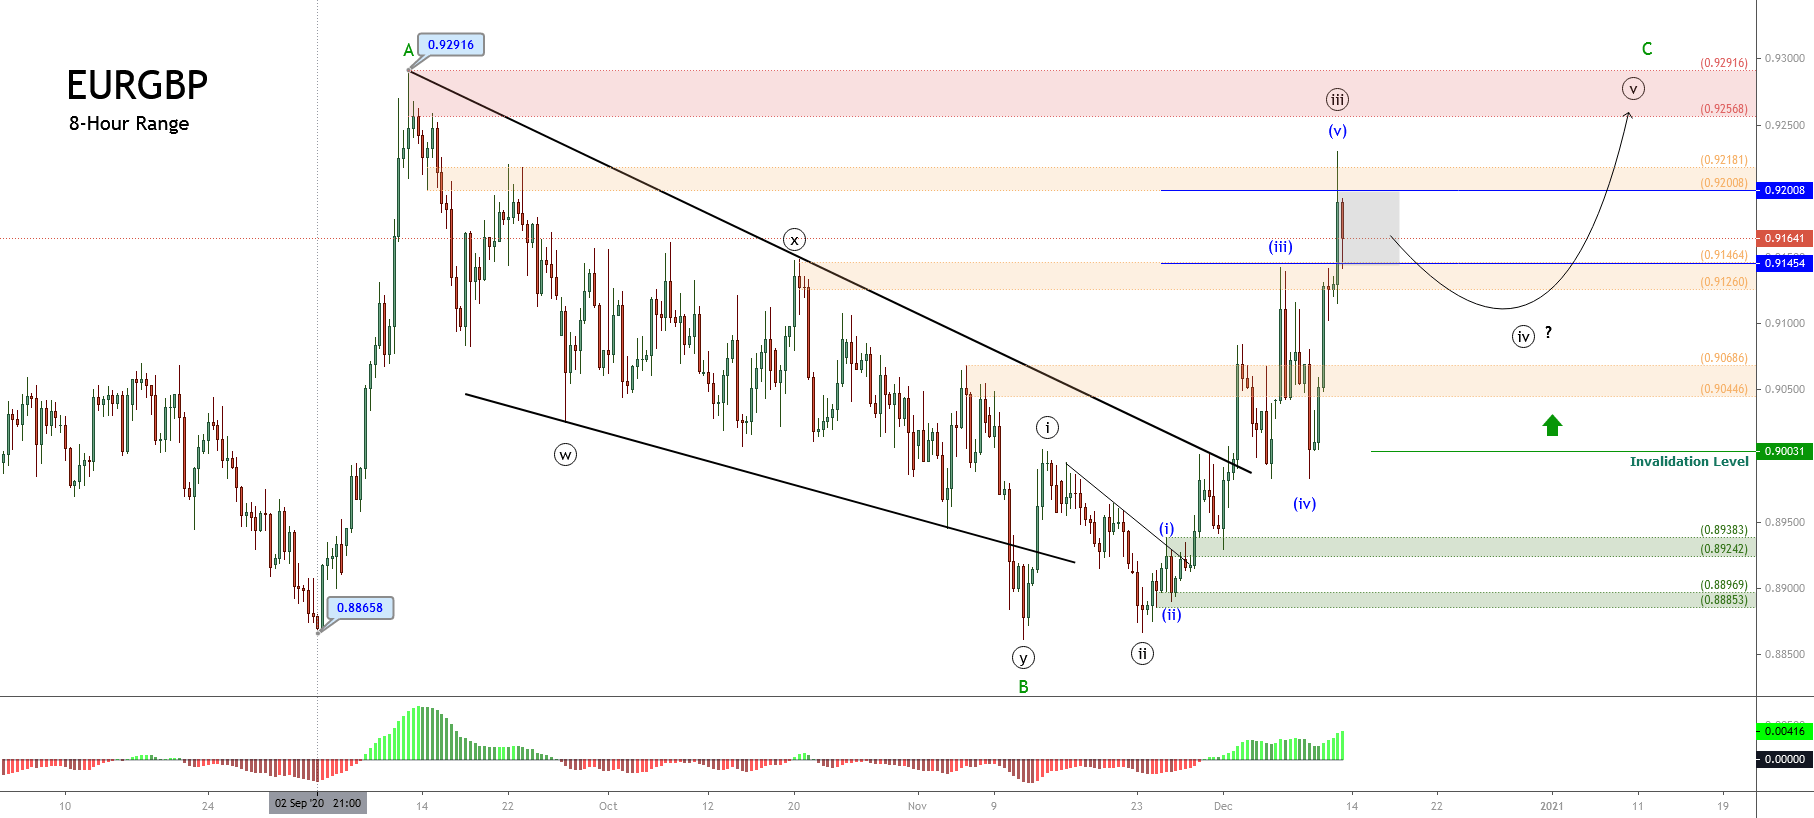
The impulsive upward movement observed during Friday’s session allows us to distinguish the completion of the wave ((iii)) at 0.92298 and the beginning of the fourth wave of the same degree.

In this context, the current corrective formation identified as wave ((iv)) in black could decline until the previous supply zone between 0.90686 and 0.90446, where the cross could find fresh buyers. Once the fourth wave completes, the cross should advance in a new rally corresponding to wave ((v)), which would be subdivided into a five-wave sequence. The potential target for the end of wave C is within the next supply zone between 0.92568 and 0.92916.

In summary, the EURGBP cross appears moving in an incomplete wave C of Minor degree, which, in its lesser degree count, shows the beginning of the fourth wave in black. This corrective formation could decline until the previous supply zone is located between 0.90446 and 0.90686. The cross, then, could find fresh buyers expecting the continuation of the trend that would push up the price toward the supply zone between 0.92568 and 0.92916.

Lastly, the invalidation level for this bullish scenario can be found at 0.90031.

Categories
Forex Market Analysis

EURCAD Looks Bouncing from Demand Zone

The EURCAD cross is still moving in a likely incomplete triangle pattern, developing since mid-March when the price found resistance on 1.59914. As pictured by the following 12-hour chart, the mid-term Elliott Wave structure shows the incomplete progress of a contracting triangle of Minor degree labeled in green.

Technical Overview

According to the Elliott wave theory, the triangle pattern follows an internal structure subdivided into 3-3-3-3-3 waves. In this context, the EURCAD triangle appears to be completing its third internal segment and start developing a new rally corresponding to wave D of Minor degree, identified in green.

On the other hand, considering the Alternation Principle, and in view that the movement developed by the wave C, in green seems like a complex corrective sequence, which took an extended time span, the following move -corresponding to wave D, could develop in a shorter time range. In this regard, it is possible that the cross would create an aggressive rally.

Short-term Technical Outlook

The short-term view displayed in its 12-hour chart (shown above) shows that the EURCAD reacted mostly upward in the demand zone identified in green between 1.54535 and 1.54273. This situation leads to expect that market participants could continue pushing it higher.

An alternative scenario considers the possibility of a new limited decline toward the next demand zone between 1.53688 and 1.53130. In this zone, the cross could find fresh buyers and complete its wave C of Minor degree, identified in green.

On the other hand, before taking any position on the bullish side, it is convenient to wait for the descending upper-line breakout that connects the waves (ii) and (iv). This would confirm the cross’s bullish bias. As for the targets, the suggested following movement, corresponding to wave D, in green, could rise till the next supply zone, located between 1.59139 and 1.59791.

Finally, the bullish scenario has its invalidation level at the end of wave A in green, located at 1.50562

Categories
Forex Elliott Wave Forex Market Analysis

NZDUSD Reaches a Fresh 90-Day High

The NZDUSD pair ends the last trading week reaching its seventh fresh 90-day range high soaring to 0.69507. This advance brought the Oceanic currency to a close in the extreme bullish sentiment zone. 

Technical Overview

The next chart unveils the NZDUSD pair in its 8-hour timeframe, which shows the market participants’ sentiment in the 90-day high and low range. The figure illustrates the previous 90-day high and low range located at 0.67978 from September 18th. In this regard, the latest rally started on November 02nd created seven fresh 90-day highs.

On the other hand, the EMA(60)-to-Close index shows a bearish divergence that suggests both the bullish trend’s exhaustion and the price’s potential reversion to the moving average. However, a price breakdown and close below the recent lows is needed to confirm the current bullish trend’s correction.

Short-term Technical Outlook

The short-term view of the NZDUSD cross displayed under the Elliott Wave perspective reveals the intraday upward movement advancing in an incomplete Ending diagonal pattern of Minuette degree labeled in blue. Likewise, the advance of the fifth wave in blue should correspond to the ending of the fifth wave of Minute degree identified in black. Nevertheless, the Elliott Wave formation still doesn’t confirm it.

The next4-hour chart reveals the bullish sequence developed by the NZDUSD pair since October 20th when the kiwi found fresh buyers at 0.65555. Until now, the price action advanced in an incomplete upward five-wave sequence, which reached the potential target zone forecasted in a previous analysis.

According to Elliott wave theory, the Ending Diagonal pattern follows an internal sequence subdivided into 3-3-3-3-3 waves. In this context, the previous chart exposes the terminal formation of the bullish impulsive structure advancing in its fifth wave of Subminuette degree labeled in green, which provides two potential scenarios.

  • First Scenario: The price breaks below the base-line that connects the waves ii and iv, confirming the end of the Ending Diagonal pattern and starting a corrective upper degree structure.
  • Second Scenario: The price advances slightly over last Friday’s high and starts to decline below the base-line between waves ii-iv, from where the NZDUSD should begin to develop a correction of upper degree.

In both scenarios, the confirmation of the ending diagonal completion comes from the breakdown and closing below the base-line that connects the end of waves ii and iv.

Finally, the downward scenario will have its invalidation level once the ending diagonal pattern confirms its completion.

Categories
Forex Elliott Wave Forex Market Analysis

Is the EURJPY Ready to Develop a New Decline?

The EURJPY cross advances in a long-term consolidation structure, which began in early December 2016. The short-term Elliott wave view predicts a limited decline in the following trading sessions.

Market Sentiment

The EURJPY cross closed the last trading week, cutting Monday’s session gains when the cross jumped from 122.835 until 125.136, mainly supported by the stock market’s post-election rally.

The following figure shows the EURJPY in its daily timeframe, revealing the mid-term big-market participants’ sentiment exposed by the 90-day high and low range. In this context, the cross is entering into the bearish sentiment zone. However, the 60-day weighted moving average still doesn’t confirm the short-term bearish bias.

After a rally that carried the cross to advance over 11% since May 07th (when the EURJPY bottomed on 114.397 and then soared, reaching the highest level of the year at 127.075 on September 01st), the cross began to retrace, turning its mid-term market sentiment from extremely bullish to bearish.

Nevertheless, the price action still doesn’t confirm the bearish sentiment. In this regard, the short-term sentiment remains neutral until the price confirms the bias.

Technical Overview

The big picture of EURJPY illustrated in the following daily chart exposes a long-tailed yearly candlestick mostly bullish. However, the upper shadow hints at a bearish pressure near the psychological barrier of 127. Moreover, the next resistance is placed at 127.502, which corresponds to the high of 2019.

The EUJPY long-term trend under the Dow Theory perspective and exposed in the next log scale weekly chart reveals the primary trend identified in blue that remains slightly bullish.

At the same time, the secondary trend exposes the sideways movement developing as a pennant pattern, which began in early December 2016 when the price found resistance at 149.787 and could break soon.

According to the classic chartist theory, the pennant pattern is a technical figure that calls for the continuation of the previous movement. In this case, the pennant could resume the rally developed since late July 2012 at 94.114 ended at 149.787 in early December 2014.

Short-term Technical Outlook

The short-term Elliott wave view for EURJPY shows in its 12-hour chart advancing in an incomplete corrective sequence that began on May 06th at 114.397, where it completed its wave A of Minor degree labeled in green.

Once the price found fresh sellers at the highest level of the year, the cross started to advance in its wave B, still in progress. In this context, the previous chart unveils the intraday upward sequence corresponding to the incomplete wave ((b)) of Minute degree identified in black.

The price action could boost the cross until the next supply zone, located between 125.285 and 126.123, where the EURJPY could start to decline in an internal five-wave sequence corresponding to wave ((c)), in black, that may drop to 120.271, though, the price could extend its drops until 117.124.

The short-term bearish scenario’s invalidation level locates above the end of wave A in green at 127.075.

Categories
Forex Elliott Wave Forex Market Analysis

Dow Jones: Still no New Record High Confirmation

Overview

The Dow Jones Industrial Average continues its advances toward the green side. During this year, it is still easing 1.08% (YTD). The DJIA index, which groups to the 30 largest capitalized U.S. companies, move in the extreme bullish sentiment zone unveiling the probability of new record highs in the U.S. stock market. Likely, it could find resistance at the 30,000 pts as a psychological barrier confirming the all-time highs observed both S&P 500 and NASDAQ 100.

Market Sentiment Overview

During this year, the Dow Jones Industrial Average eases 1.08% (YTD), returning from the bear market to bull market side. The recovery experienced by the Industrial Average, carried it to jump from the lowest level of the year at 18,213.5 pts to 28,287 pts gaining over 55%. 

The following figure compares the advance of Dow Jones and the S&P 500 in its weekly timeframe. In these two charts, we observe that both indexes move in the extreme bullish sentiment zone. However, although surprising, the recovery observed in the U.S. stock market, the Industrial Average still doesn’t confirm the all-time high of the S&P 500, reached on the latest trading sessions

If we look at the Dow Jones’ volatility (VXD), it is running below the 60-day moving average, which confirms that the market sentiment continues being in favor of fresh upsides on the Industrial Average.

Finally, considering that both NASDAQ 100 and S&P 500 reached fresh all-time highs in the latest sessions, the Dow Jones should follow the same path in the coming trading sessions.

Elliott Wave Outlook

The mid-term outlook for the Industrial Average provided by the Elliott Wave Analysis reveals the bullish continuation of the incomplete wave B of Minor degree labeled in green, which could push it toward new all-time highs.

The next 4-hour chart illustrates the price running in an uptrend that began on March 23rd when the U.S. Blue Chip index found fresh buyers at 18,213.5 pts, developing a corrective structural sequence that remains incomplete.

Once the Industrial Average broke upward the (b)-(d) upper-line of the triangle drawn by the wave ((b)) of Minor degree, the price activated its progression as wave ((c)), which is characterized by the inclusion of five internal waves. 

Currently, Dow Jones continues its development in an incomplete wave (iii) of the Minuette degree labeled in blue. Simultaneously, the bullish trendline looks intact, which leads us to conclude that the uptrend remains sound, calling for more upsides in the following trading sessions.

Finally, considering that both the S&P 500 and NASDAQ 100 reached new record highs, we expect further upsides and record highs on Dow Jones. A potential target could be at 30,000 pts as this psychological barrier will be a natural profit-taking level.

Categories
Crypto Guides

Usage Of Cryptocurrency In The Gig Economy

Introduction

The global workspace has considerably been changing and evolving. For example, the replacement of automated machines has helped corporations reduce costs on jobs. Back then, people had the idea of staying and working in a single workplace. But, in the younger generation, the idea of moving from one job to another is normal.

Then comes the gig economy that is growing at a great pace. In fact, it has even become the main source of income for many people across the world. And all of this has been made possible by the internet’s feature to connect remote workers with their employers.

In 2018, over one-third of the Europeans and Americans are involved in the gig economy. Presently, the numbers have almost risen to 50%, which has led to pressure in the existing economy to keep up with this rise.

Payment System in Gig Economy

In freelancing, the payment services are quite different from the traditional system. Most freelancers get paid through online digital payment services like PayPal. Before this, people relied on paychecks. But the launch of PayPal has made a great impact on the payment system, especially in the freelancing space.

However, there is a downside to it. For making payments via PayPal, the fee is around 4%, which certainly unreliable for continual large-scale use. Many digital payment providers like PayPal are available, but their charges are still not reasonable for freelancers.

But well, it doesn’t end there. This is when blockchain and cryptocurrencies make their way into the gig economy. Let’s find out how.

Cryptocurrency in Gig Economy

Cryptocurrencies can significantly affect the transaction system in the freelancing field. There are two features cryptocurrencies have to offer that could help ease the payments.

They are - Extremely less transaction fee & Rapid transaction confirmation

These two features, happening to be the most important factors in a transaction, is unavailable in services in PayPal. Also, there has been a rise in blockchain-based platforms for searching and positing freelancing jobs, which has caused a challenge for the existing farm websites.

Also, the growth of the gig economy across the world in recent years has led to Upwork stop accepting registrations for freelancer writers.

How is the world developing?

The development of the gig economy has been slow, yet steady in the Western countries. But it has become a regular job in other emerging countries around the globe. For instance, in 2015, Africans created over 3.1 million new jobs. And in the same year, 12 million youngsters entered the workspace. Hence, these numbers evidently explain the growing gig economy embedded with crypto services in Africa.

In some countries, cryptocurrencies have seen to be more stable than the standard fiat currencies. Though they have regular volatility of 10-15%, it is still a better option than unstable fiat currency as they are prone to hyperinflation.

Conclusion

Many thought the gig economy is something that could take a while to enter, but it is here before than expected. With its steady rise, blockchain and cryptocurrency have increased its rate of rising. Also, this could also lead to norms like PayPal and Upwork to adapt and reduce their existing cost on transactions.