
The NZDUSD pair ends the last trading week reaching its seventh fresh 90-day range high soaring to 0.69507. This advance brought the Oceanic currency to a close in the extreme bullish sentiment zone.
Technical Overview
The next chart unveils the NZDUSD pair in its 8-hour timeframe, which shows the market participants’ sentiment in the 90-day high and low range. The figure illustrates the previous 90-day high and low range located at 0.67978 from September 18th. In this regard, the latest rally started on November 02nd created seven fresh 90-day highs.
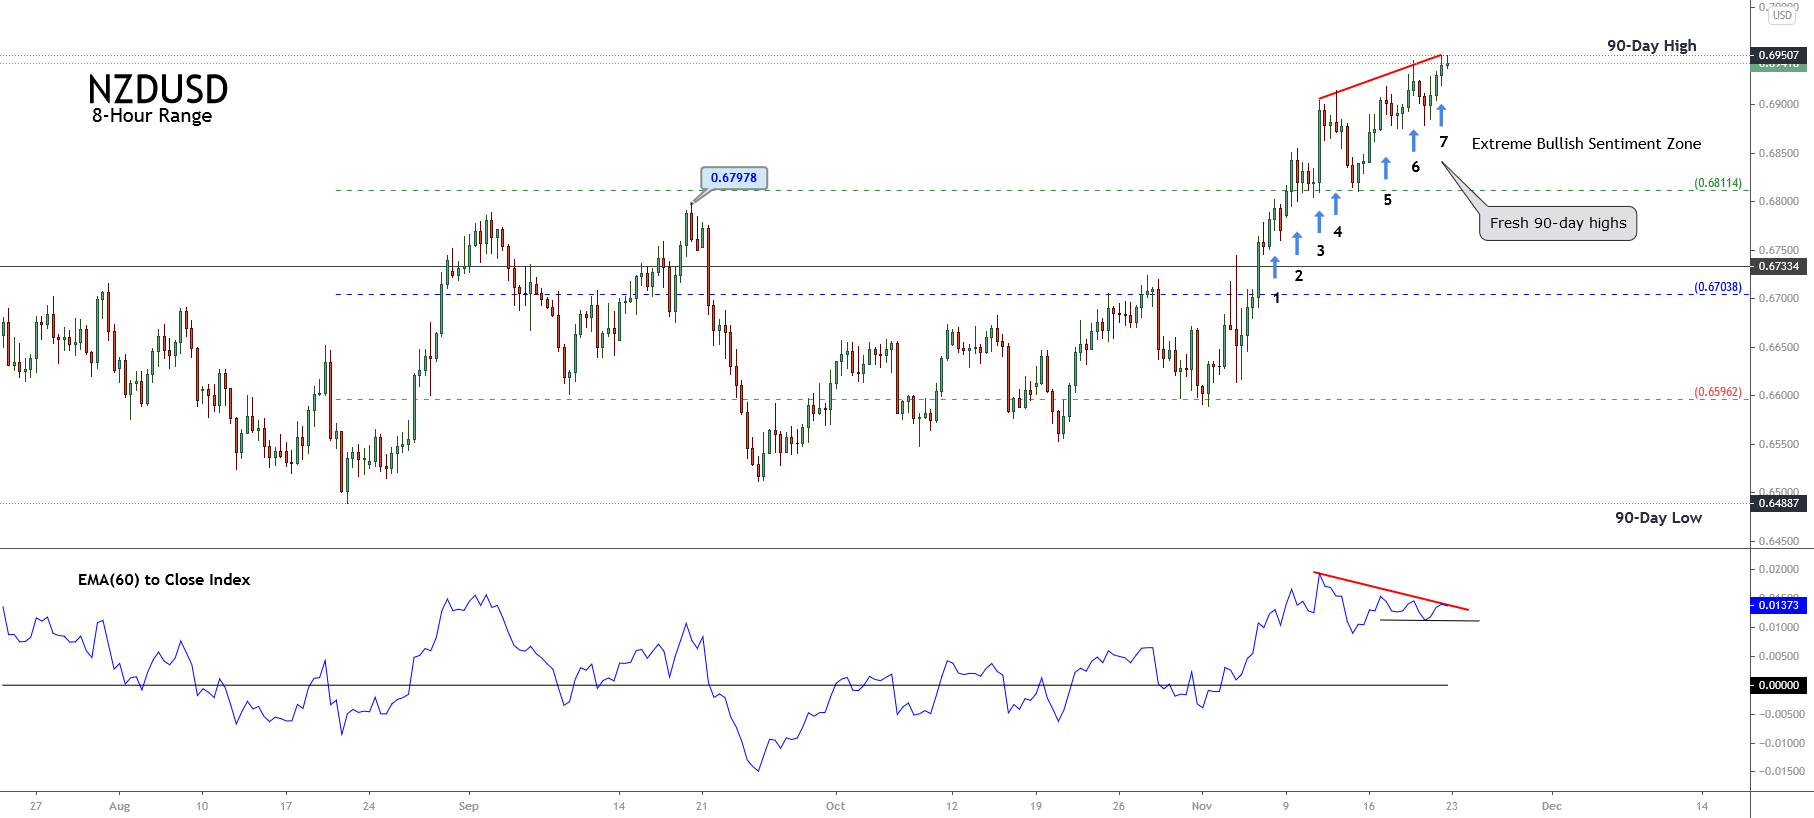
On the other hand, the EMA(60)-to-Close index shows a bearish divergence that suggests both the bullish trend’s exhaustion and the price’s potential reversion to the moving average. However, a price breakdown and close below the recent lows is needed to confirm the current bullish trend’s correction.
Short-term Technical Outlook
The short-term view of the NZDUSD cross displayed under the Elliott Wave perspective reveals the intraday upward movement advancing in an incomplete Ending diagonal pattern of Minuette degree labeled in blue. Likewise, the advance of the fifth wave in blue should correspond to the ending of the fifth wave of Minute degree identified in black. Nevertheless, the Elliott Wave formation still doesn’t confirm it.
The next4-hour chart reveals the bullish sequence developed by the NZDUSD pair since October 20th when the kiwi found fresh buyers at 0.65555. Until now, the price action advanced in an incomplete upward five-wave sequence, which reached the potential target zone forecasted in a previous analysis.
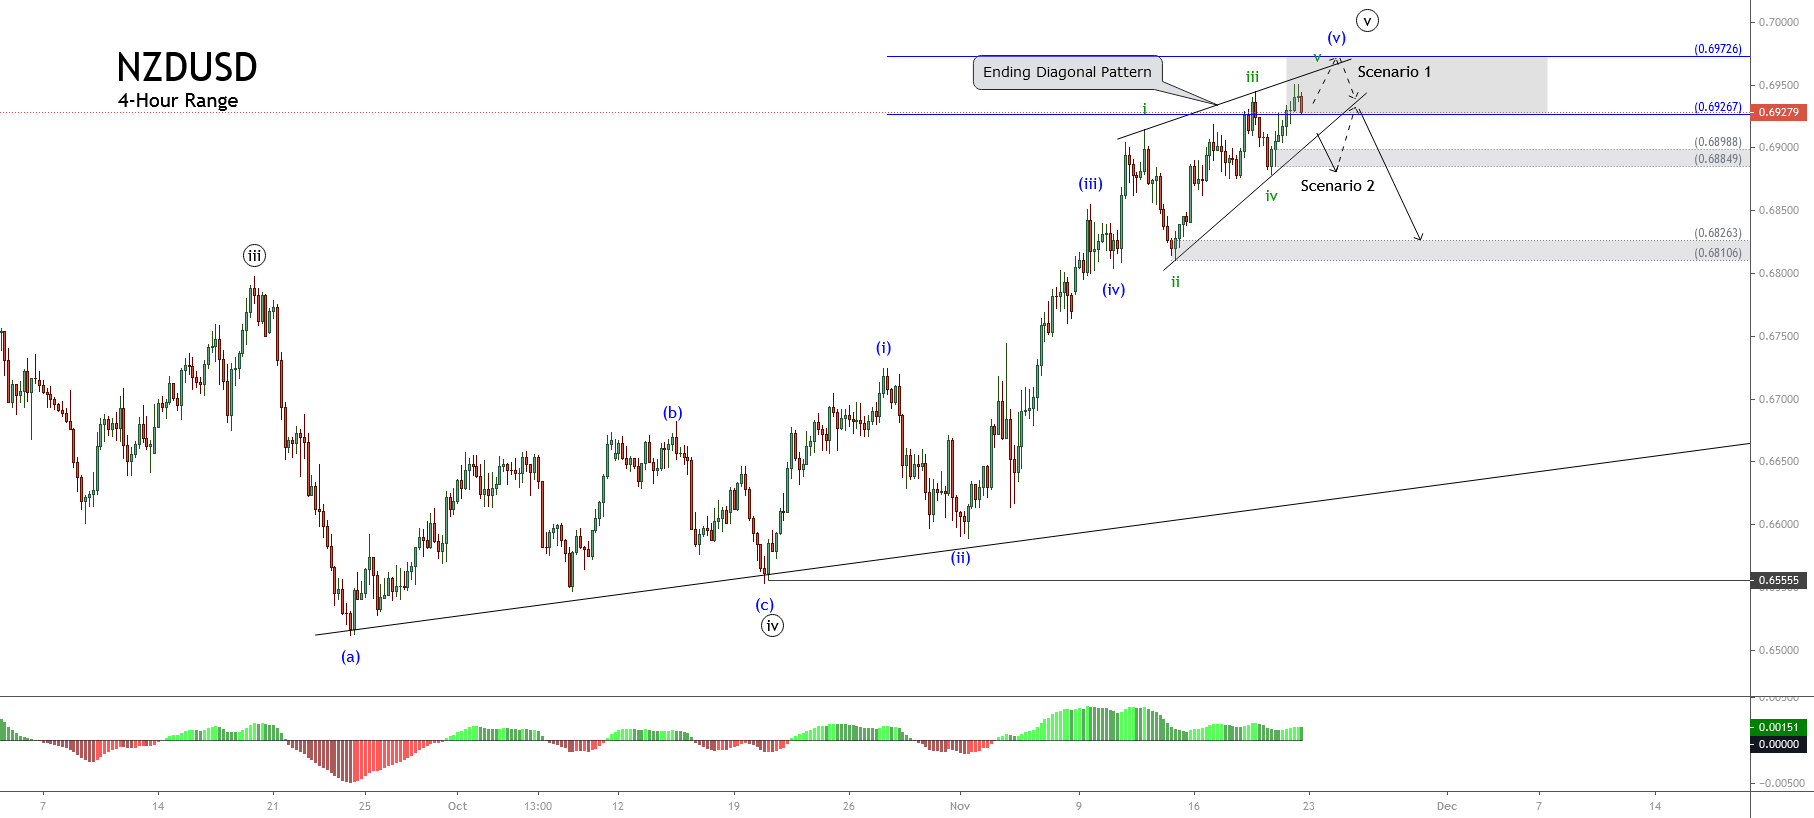
According to Elliott wave theory, the Ending Diagonal pattern follows an internal sequence subdivided into 3-3-3-3-3 waves. In this context, the previous chart exposes the terminal formation of the bullish impulsive structure advancing in its fifth wave of Subminuette degree labeled in green, which provides two potential scenarios.
- First Scenario: The price breaks below the base-line that connects the waves ii and iv, confirming the end of the Ending Diagonal pattern and starting a corrective upper degree structure.
- Second Scenario: The price advances slightly over last Friday’s high and starts to decline below the base-line between waves ii-iv, from where the NZDUSD should begin to develop a correction of upper degree.
In both scenarios, the confirmation of the ending diagonal completion comes from the breakdown and closing below the base-line that connects the end of waves ii and iv.
Finally, the downward scenario will have its invalidation level once the ending diagonal pattern confirms its completion.