
The cryptocurrency sector has spent the weekend being quite volatile as Bitcoin had a flash crash, which brought its price below $18,000, followed by a rally that brought it back above it. The largest cryptocurrency by market cap is currently trading for $18,461, representing an increase of 0.61% on the day. Meanwhile, Ethereum skyrocketed by gaining 8.13% on the day, while XRP gained 0.09%.

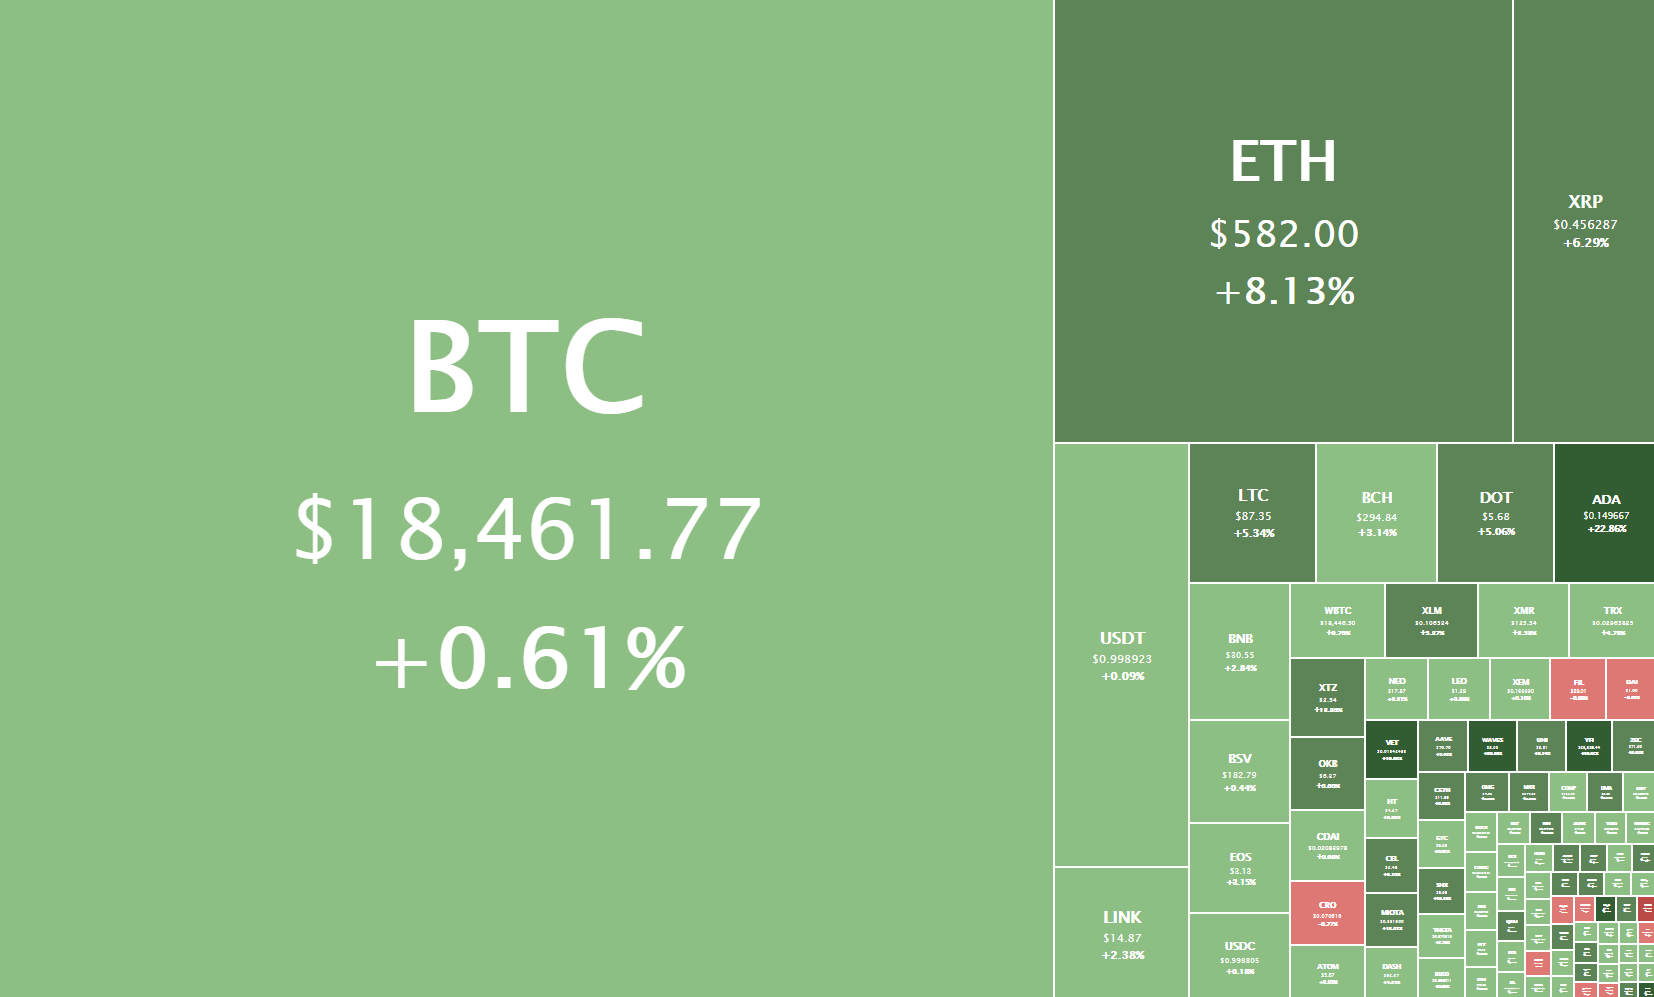
Daily Crypto Sector Heat Map
Waves 38.43% in the past 24 hours, making it the most prominent daily gainer in the top100. It is closely followed by Horizen’s gain of 31.65% and Numeraire’s 21.56% gain. On the other hand, Terra lost 5.45%, making it the most prominent daily loser. HedgeTrade lost 3.22% while Crypto.com Coin lost 1.65%, making them the 2nd and 3rd most prominent daily losers.
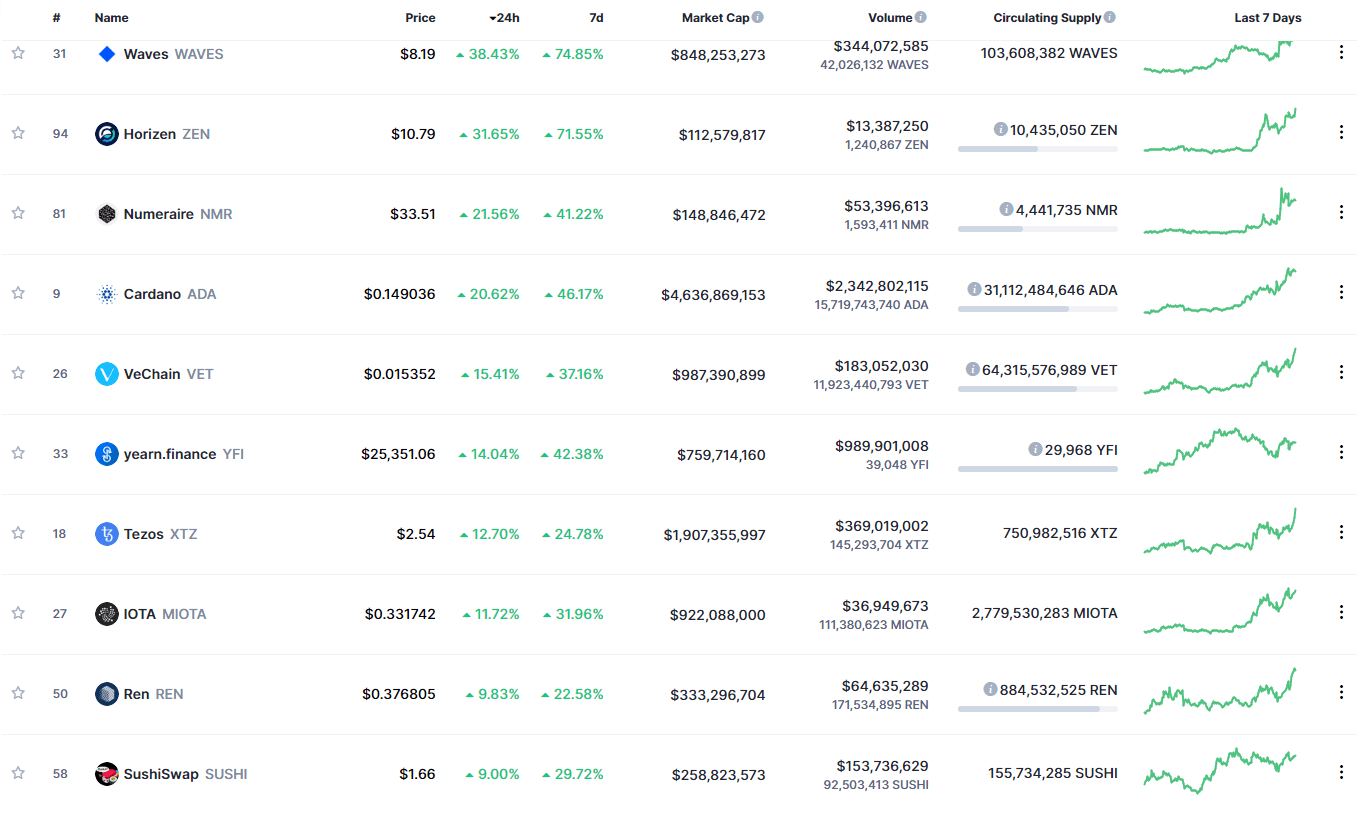
Top 10 24-hour Performers (Click to enlarge)
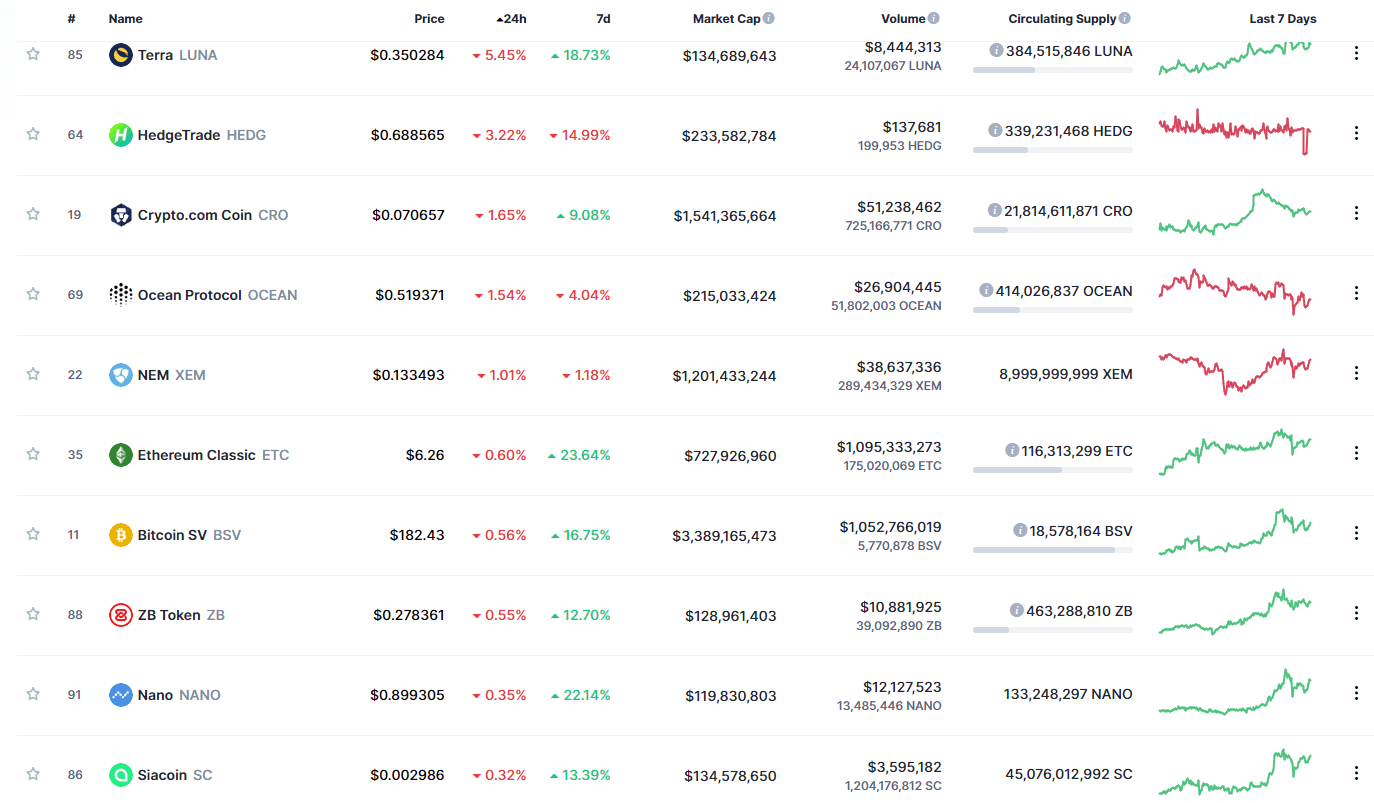
Bottom 10 24-hour Performers (Click to enlarge)
Bitcoin’s market dominance has reduced drastically over the course of the weekend, with its value is currently staying at 63.2%. This value represents a 2.9% difference to the downside compared to the value it had on Friday.
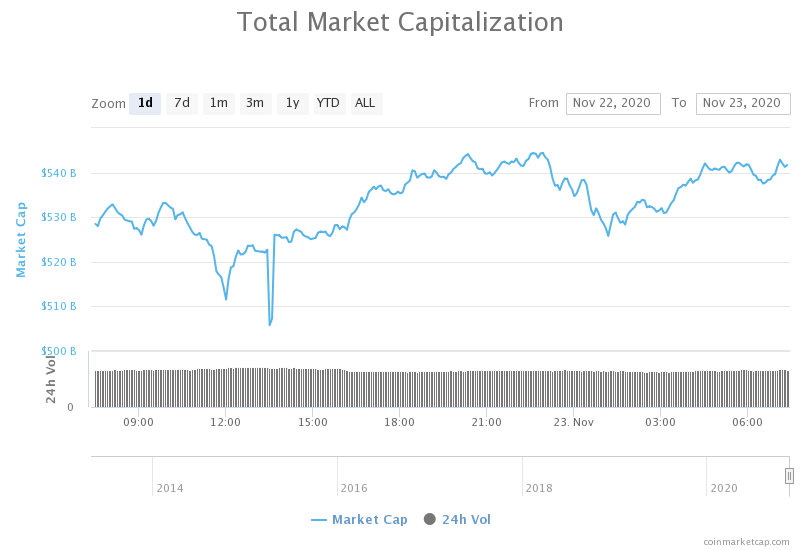
Daily Crypto Market Cap Chart
The crypto sector capitalization has increased significantly over the course of the weekend. Its current value is $541.71 billion, representing a $34.48 billion increase compared to our previous report.
_______________________________________________________________________
What happened in the past 24 hours?
_______________________________________________________________________
- Analyst who predicted Bitcoin rally to $18,000 begins to build a short position (Cryptoslate)
- Bitcoin Is Now Better Money Than Many Emerging Market Currencies (Cryptobriefing)
- Bitcoin Will Replace Gold, Says World’s Largest Asset Firm BlackRock (Cryptobriefing)
- Circle Using USDC Stablecoin to Aid Venezuela Crisis (Cryptobriefing)
- US bank regulator unveils push to compel banks to provide fairer access to banking services (The Block)
- Visa and Mastercard run ‘enhanced diligence’ on crypto card issuers (The Block)
- China’s Xi calls for G20 to adopt ‘open and accommodating attitude’ on CBDCs (The Block)
- Bitcoin Shortage? Pantera Thinks Market Rally Driven by PayPal Buys (Coindesk)
- Privacy coins no more? CipherTrace files patents for tracing Monero transactions (Cointelegraph)
- Van Eck declares Bitcoin ‘less volatile than many’ stocks (Cointelegraph)
_______________________________________________________________________
Technical analysis
_______________________________________________________________________
Bitcoin
The largest cryptocurrency by market cap has spent the weekend with decently high volatility as its price managed to go from above $18,500 to $17,600 and then back above $18,500 in just one day. While this “flash crash” is behind Bitcoin, the bulls seem to be more and more wary of the new highs, and a retracement before another push towards the upside is quite possible.
Due to many people taking profits and shorting Bitcoin to hedge their portfolios, the largest currency has a hard time going up. However, trading pullbacks in a bull trend is equally as risky. Bitcoin traders would have the most chance of succeeding if they traded only long positions.
BTC/USD 2-hour Chart
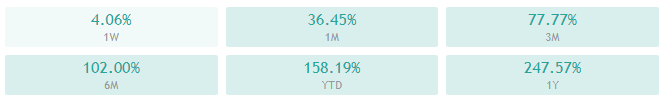
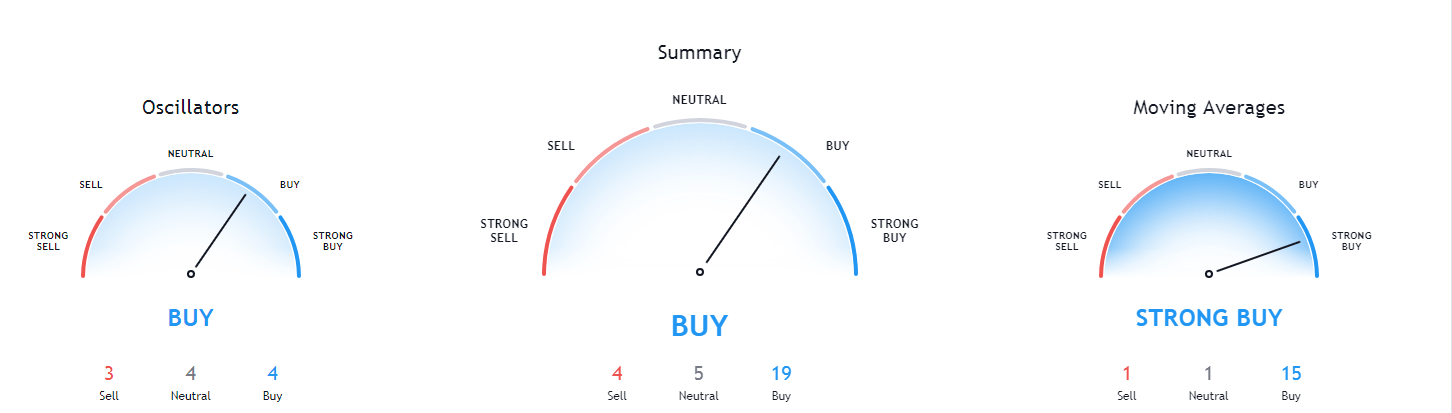
Bitcoin’s technicals are semi-divided, with its daily and monthly overviews showing a slight bullish tilt with signs of bears still present. In contrast, the 4-hour and weekly overviews show no signs of bearish presence and are completely bullish.
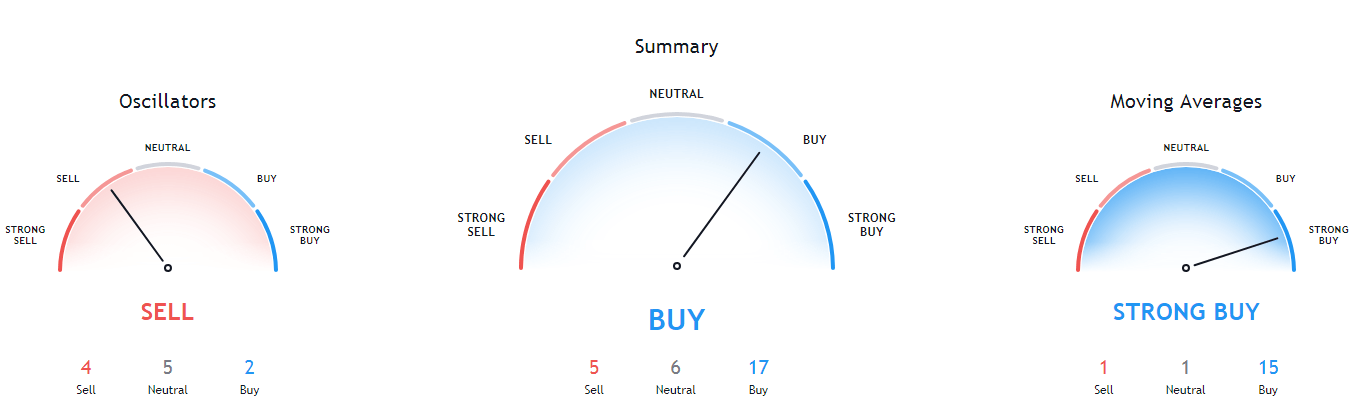
BTC/USD 1-day Technicals
Technical factors (4-hour Chart):
- Price is above its 50-period EMA and at its 21-period EMA
- Price is at its middle Bollinger band
- RSI is neutral (51.42)
- Volume is average
Key levels to the upside Key levels to the downside
1: $18500 1: $17,850
2: $19000 2: $17,450
3: $19500 3: $17,130
Ethereum
Ethereum’s 2.0 version 0 launch is approaching, and Ethereum bulls seem to be back in the game. The second-largest cryptocurrency by market cap broke out of the ascending (red) line and pushed towards the upside, eyeing the $600 resistance level. While the rally was strong, Ethereum bulls started showing exhaustion at $580. With that being said, the move is still not considered over, and there is more opportunity to the upside.
We mentioned on Friday that Ethereum’s downside is quite defined, but that its upside isn’t. With ETH entering territory that was explored only a couple of times, the opportunity for volatility (but also slippage) is increasing.
ETH/USD 4-hour Chart
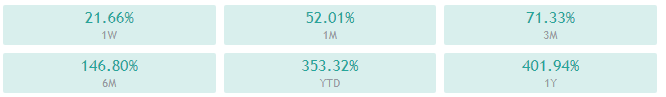
Ethereum’s 4-hour and daily time-frames are completely bullish, while its longer time-frames (weekly and monthly) are slightly more tilted towards the neutral position.

ETH/USD 1-day Technicals
Technical Factors (4-hour Chart):
- The price is far above both its 50-period and its 21-period EMA
- Price is at its top Bollinger band
- RSI is extremely overbought (72.01)
- Volume is above average
Key levels to the upside Key levels to the downside
1: $600 1: $510
2: $630 2: $500
3: $735 3: $490
Ripple
The fourth-largest cryptocurrency by market cap has, just like Ethereum, had quite an amazing weekend. XRP continued its rally to the upside that began on Nov 20 and reached as high as $0.49 before starting to consolidate. While consolidating, it has seemingly created a triangle formation that should keep its price at bay before ~80% of the formation is done.
While it is quite unknown how XRP will act right now, all chances are that it will stay within the triangle formation’s bounds for some time, at least.
XRP/USD 1-hour Chart
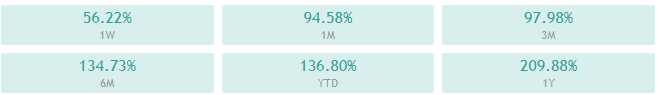
XRP’s daily and weekly overviews are completely bullish and show no signs of neutrality, while its 4-hour and monthly overviews show slight neutrality.
XRP/USD 1-day Technicals
Technical factors (4-hour Chart):
- The price is above its 50-period EMA and at its 21-period EMA
- Price is slightly above its middle Bollinger band
- RSI is neutral (53.65)
- Volume is above average
Key levels to the upside Key levels to the downside
1: $0.476 1: $0.3328
2: $0.509 2: $0.3244
3: $0.792 3: $0.31
Related posts
 Daily Crypto Review, Sept 16 – Ethereum Facing a 35% Drop; Bitcoin Remains Bullish
 Daily Crypto Review, Sept 17 – Bitcoin Above $11,000; XRP Skyrocketing
 Daily Crypto Review, Sept 22 – Crypto Sector Plummets Alongside Stocks and Gold; Markets Preparing for the US Presidential Election
 Daily Crypto Review, Oct 20 – Bitcoin Above $12,000 by the End of the Month? Bull Market has Already Started