
The cryptocurrency sector has pushed towards the upside as Bitcoin reached $11,850. Bitcoin is currently trading for $11,741, representing an increase of 2.22% on the day. Meanwhile, Ethereum gained 0.50% on the day, while XRP gained 1.69%.

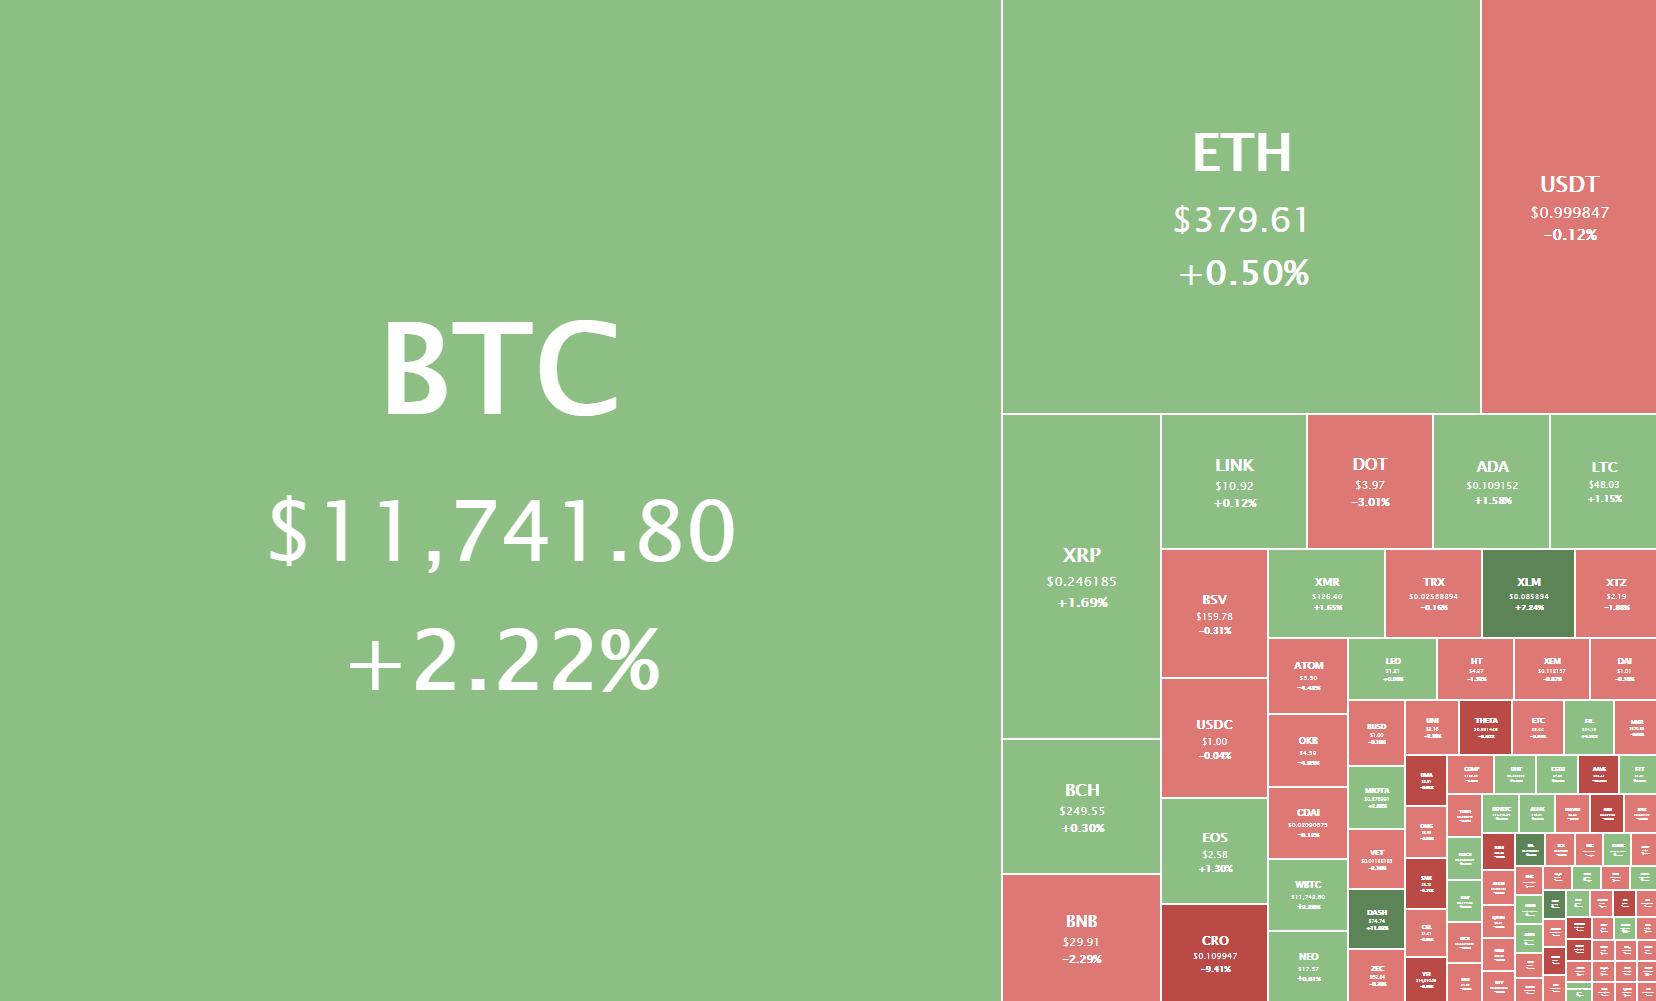
Daily Crypto Sector Heat Map
If we look at the top 100 cryptocurrencies, we can see that Dash gained 11.62% in the past 24 hours, making it the top daily gainer. Stellar (7.37%) and Quant (6.5%) also did great. On the other hand, Aave lost 10.73%, making it the most prominent daily loser. It is followed by Crypto.com Coin’s loss of 10.06% and NEAR Protocol’s loss of 9.3%.
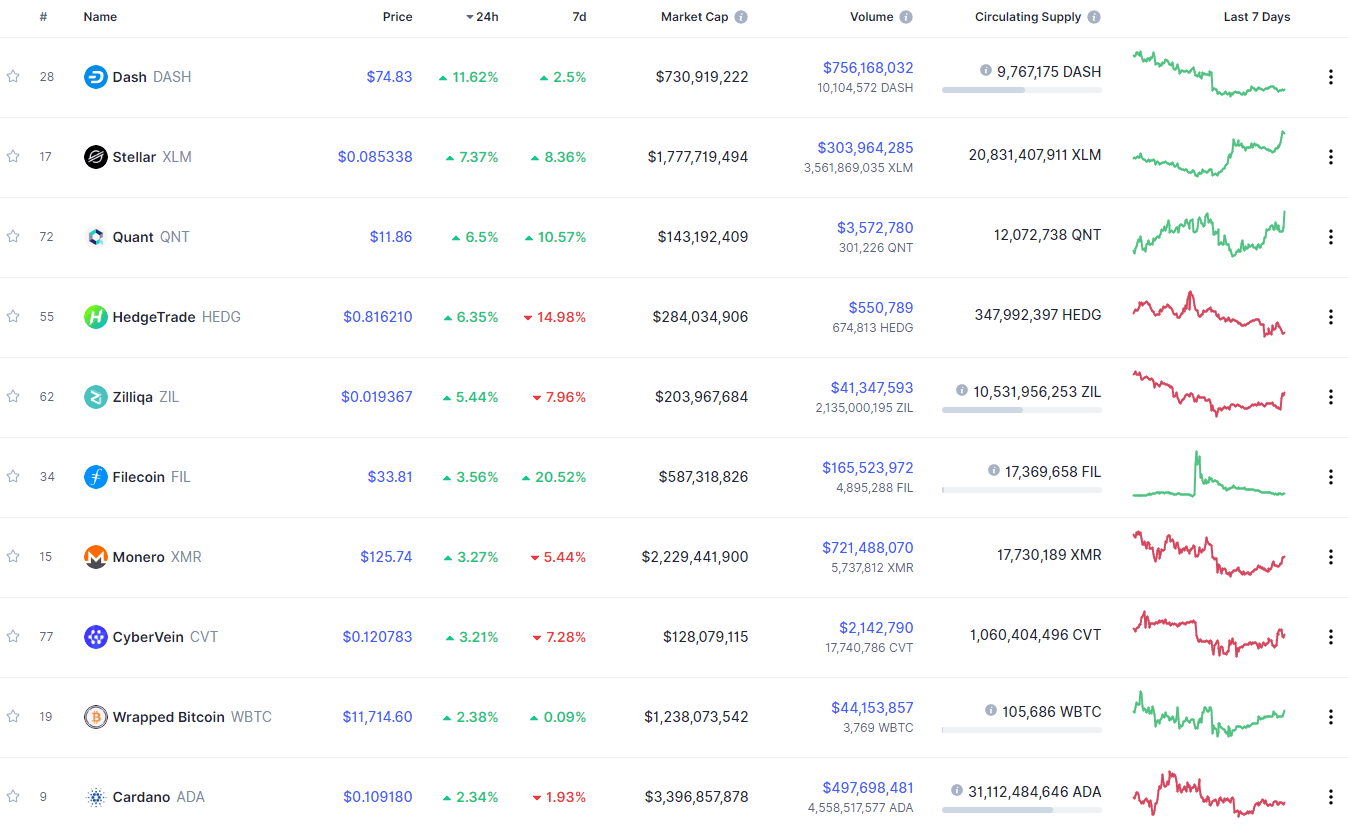
Top 10 24-hour Performers (Click to enlarge)
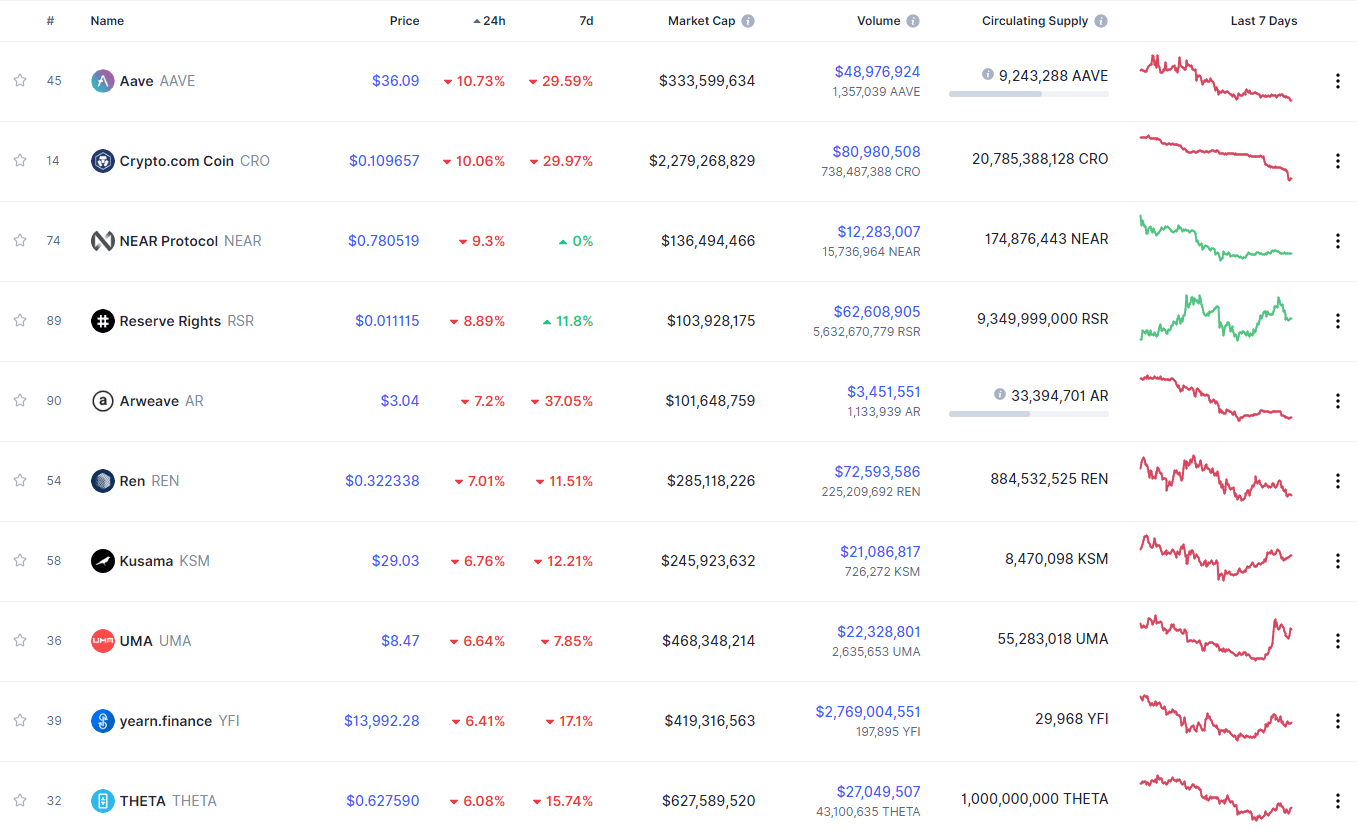
Bottom 10 24-hour Performers (Click to enlarge)
Bitcoin’s market dominance level has increased slightly since our last report, with its value is currently 59.5%. This value represents a 0.7% difference to the upside when compared to when we last reported.
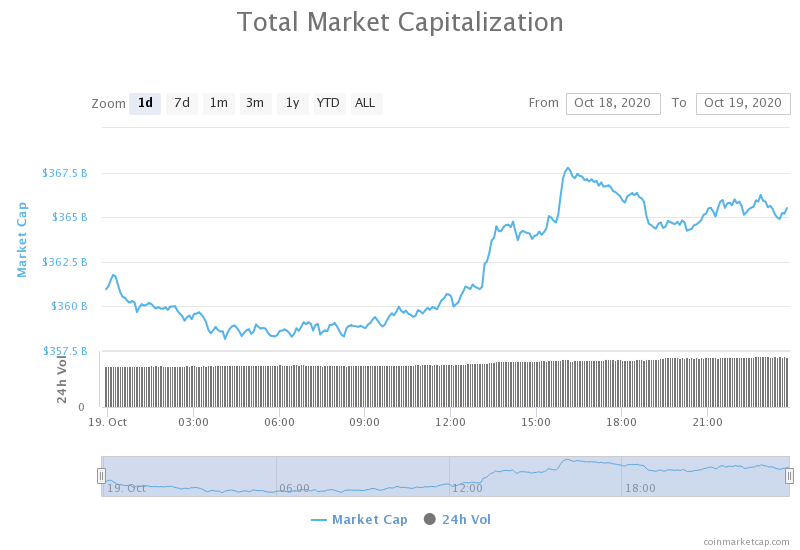
Daily Crypto Market Cap Chart
The crypto sector capitalization has lost a bit of its value since Friday. Its current value is $365.47 billion, representing a decrease of $4.35 billion compared to our previous report.
_______________________________________________________________________
What happened in the past 24 hours?
_______________________________________________________________________
- Bitcoin mine in Bulgaria seized in crackdown on transnational crime organization QQAAZZ (The Block)
- FinCEN hits bitcoin mixing service operator with $60 million penalty for BSA violations (The Block)
- Fed chair Powell Saus Tjat A central bank digital currency could improve the payment system in the US (The Block)
- Critical Ethereum Pullback Offers Sidelined Investors Long Entry (Cryptobriefing)
- Whales are Loading Up on XRP, price Aiming for $0.30? (Cryptobriefing)
- Asset manager: Activist investors may save Ethereum DeFi token Curve (CRV) as token price hits all-time lows (Cryptoslate)
- This user lost $1m of top DeFi coin Aave (AAVE) by accident: here’s why (Cryptoslate)
- Cryptographers Will Always Be ‘One Step Ahead’ of Regulators – Monero’s Spagni (Coindesk)
- Filecoin creator denies strike allegations (Cointelegraph)
- French Finance Minister throws shade at crypto, praises blockchain (Cointelegraph)
_______________________________________________________________________
Technical analysis
_______________________________________________________________________
Bitcoin
The largest cryptocurrency by market capitalization has pushed past its major resistance sitting at $11,500. The push was accompanied by a major volume increase, which brought Bitcoin’s price to as high as $11,850 before dropping back down to sub-$11,800.
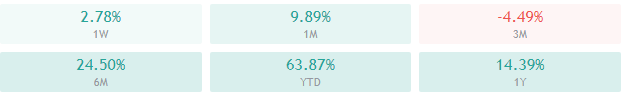
This new spike has put Bitcoin at above 60% year-to-date gains. On top of that, Bitcoin is on track to challenge (and even pass) $12,000, which is a crucial resistance. With the price ignoring all indicators showing that it would bounce back down and pull away from its highs, it does quite the opposite. This inspired many analysts to call for Bitcoin at over $12,000 even by the end of the month.
BTC/USD 1-day Chart
Bitcoin’s technical overview is heavily tilted towards the buy-side, with every single time-frame showing almost no signs of neutrality.
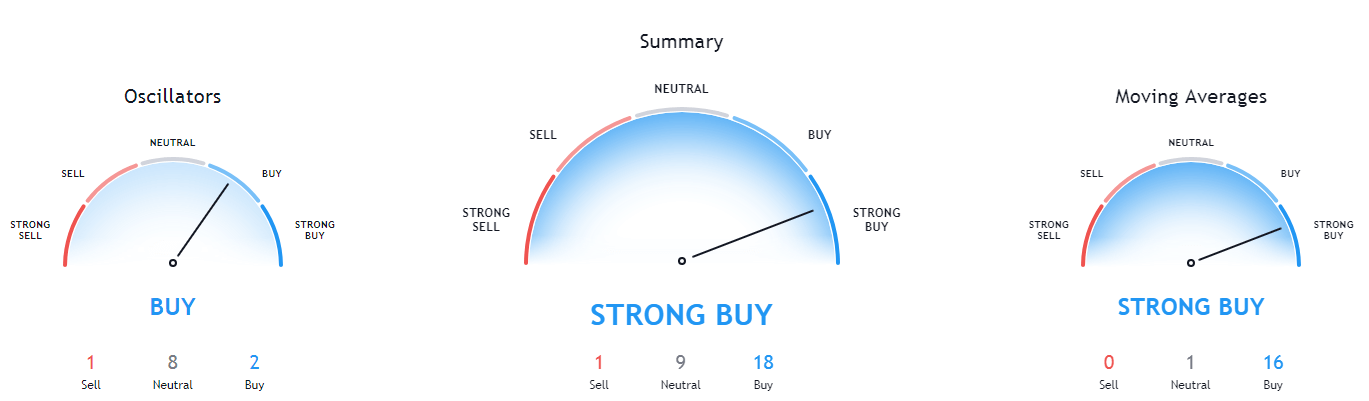
BTC/USD 1-day Technicals
Technical factors (4-hour Chart):
- Price is above its 50-period EMA and at its 21-period EMA
- Price near its top Bollinger band
- RSI is pushing towards the overbought area (63.99)
- Volume is descending after a major spike
Key levels to the upside Key levels to the downside
1: $11,735 1: $11,630
2: $11,850 2: $11,500
3: $12,000 3: $11,300
Ethereum
Ethereum’s price moved towards the downside throughout the past week, but then rebounded after hitting the $361 support level and began a slow push towards the upside. Ethereum bulls were patient and slowly took over first the $371 resistance level and now the $378 level, turning them both into support. In both cases, the push was just enough to bring the price above these levels, but the consolidation phase always ended with Ether’s price above its newly found support.
The fundamentals surrounding Ethereum are (at the moment) looking particularly strong as investors are expecting a successful launch of Ethereum 2.0.
ETH/USD 4-hour Chart
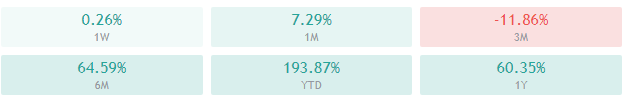
Ethereum’s technicals are showing a tilt towards the buy-side on all time-frames. However, while its lower time-frames are being more positive, its longer time-frames are being a bit more neutral (mostly oscillators).
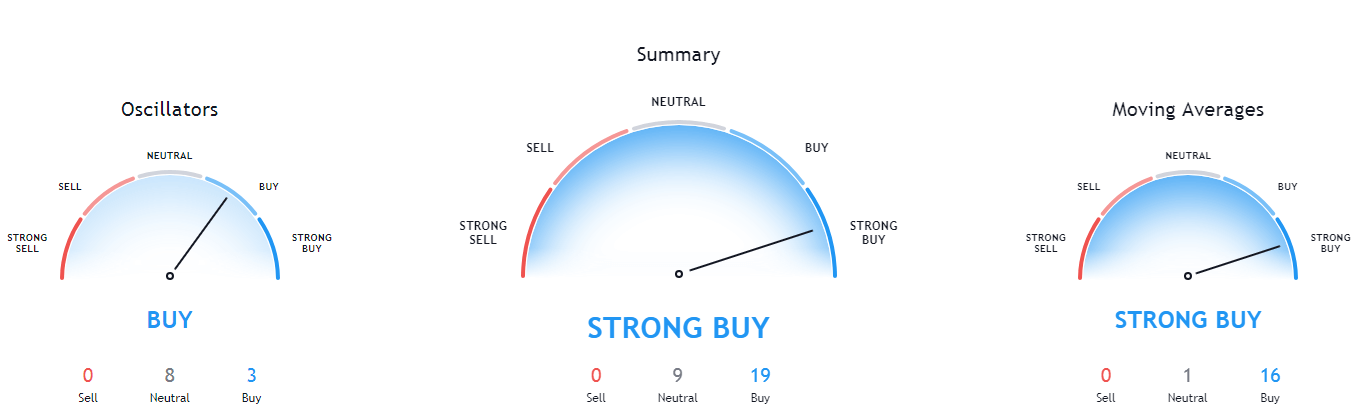
ETH/USD 1-day Technicals
Technical Factors (4-hour Chart):
- The price is above its 50-period and its 21-period EMA
- The price between its middle and top Bollinger band
- RSI is neutral (57.27)
- Volume is descending from a spike
Key levels to the upside Key levels to the downside
1: $400 1: $378
2: $415 2: $371
3: $420 3: $360
Ripple
The fourth-largest cryptocurrency by market cap has unexpectedly pushed towards the upside as XRP whales reemerged and went on a buying spree. The most recent upswing has put XRP above the $0.2454 level, which has proven itself both as strong support and resistance level. At the time of writing, XRP seems like it will stay above the level, even though most of its indicators are showing a strong possibility of price pulling back a bit more.
Traders should pay attention to how XRP handles the $0.2454 support level and trade it as XRP bounces up or breaks below it.
XRP/USD 4-hour Chart
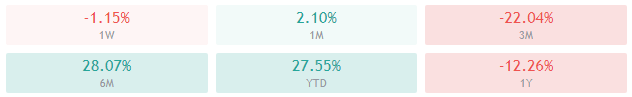
XRP’s technicals are quite mixed up. While its 4-hour overview is neutral-bullish, its 1-day chart is completely bearish. On the other hand, its weekly overview is tilted towards the buy-side, while its monthly overview is quite neutral, but still leaning slightly towards the bear side.
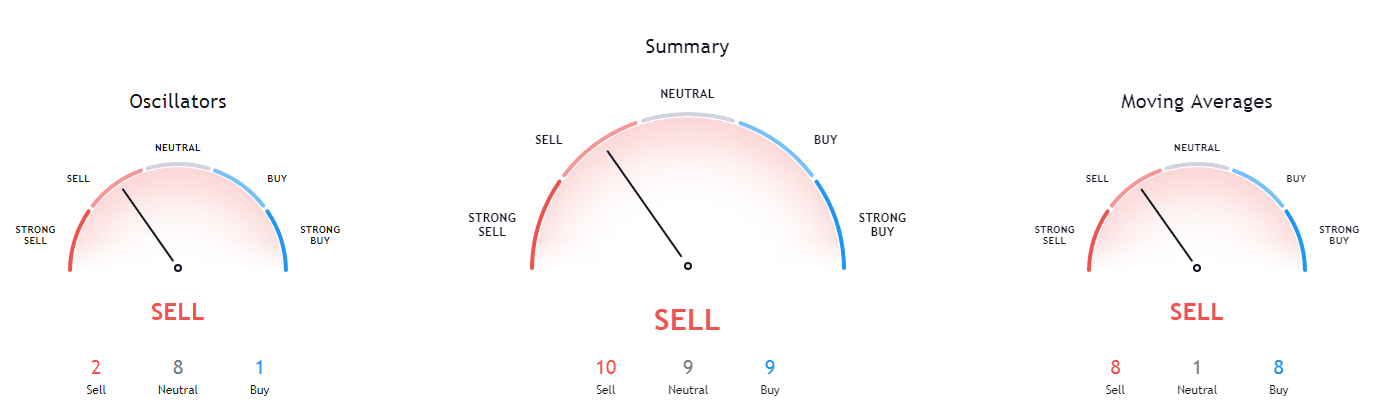
XRP/USD 1-day Technicals
Technical factors (4-hour Chart):
- The price is at its 50-period EMA and above its21-period EMA
- Price is near its top Bollinger band
- RSI is neutral (53.39)
- Volume is below average
Key levels to the upside Key levels to the downside
1: $0.26 1: $0.2454
2: $0.266 2: $0.235
3: $0.2855 3: $0.227
Related posts
 Daily Crypto Review, Apr 24 – Bitcoin transaction fees jumping up by 50% in the past 24 hours; Cryptos making new gains
 Daily Crypto Review, May 1 – XRP supported by the first Crypto Bank; Crypto market consolidating after a sharp move up
 Daily Crypto Review, May 4 – Bitcoin Hash Rate reached All-Time Highs before the Halving
 Daily Crypto Review, May 5 – Bitcoin Breaking $9,000 Again; Craig Wright’s Satoshi Nakamoto Case Court Date Set