The economic calendar is again busy with Federal Reserve events such as today, the Fed Chair Powell Testifies. Jerome Powell is expected to testify on the CARES Act before the House Financial Services Committee in Washington DC. Besides this, the eyes will be on the Existing Home Sales from the United States. Overall, the market is likely to exhibit corrections today.
Economic Events to Watch Today
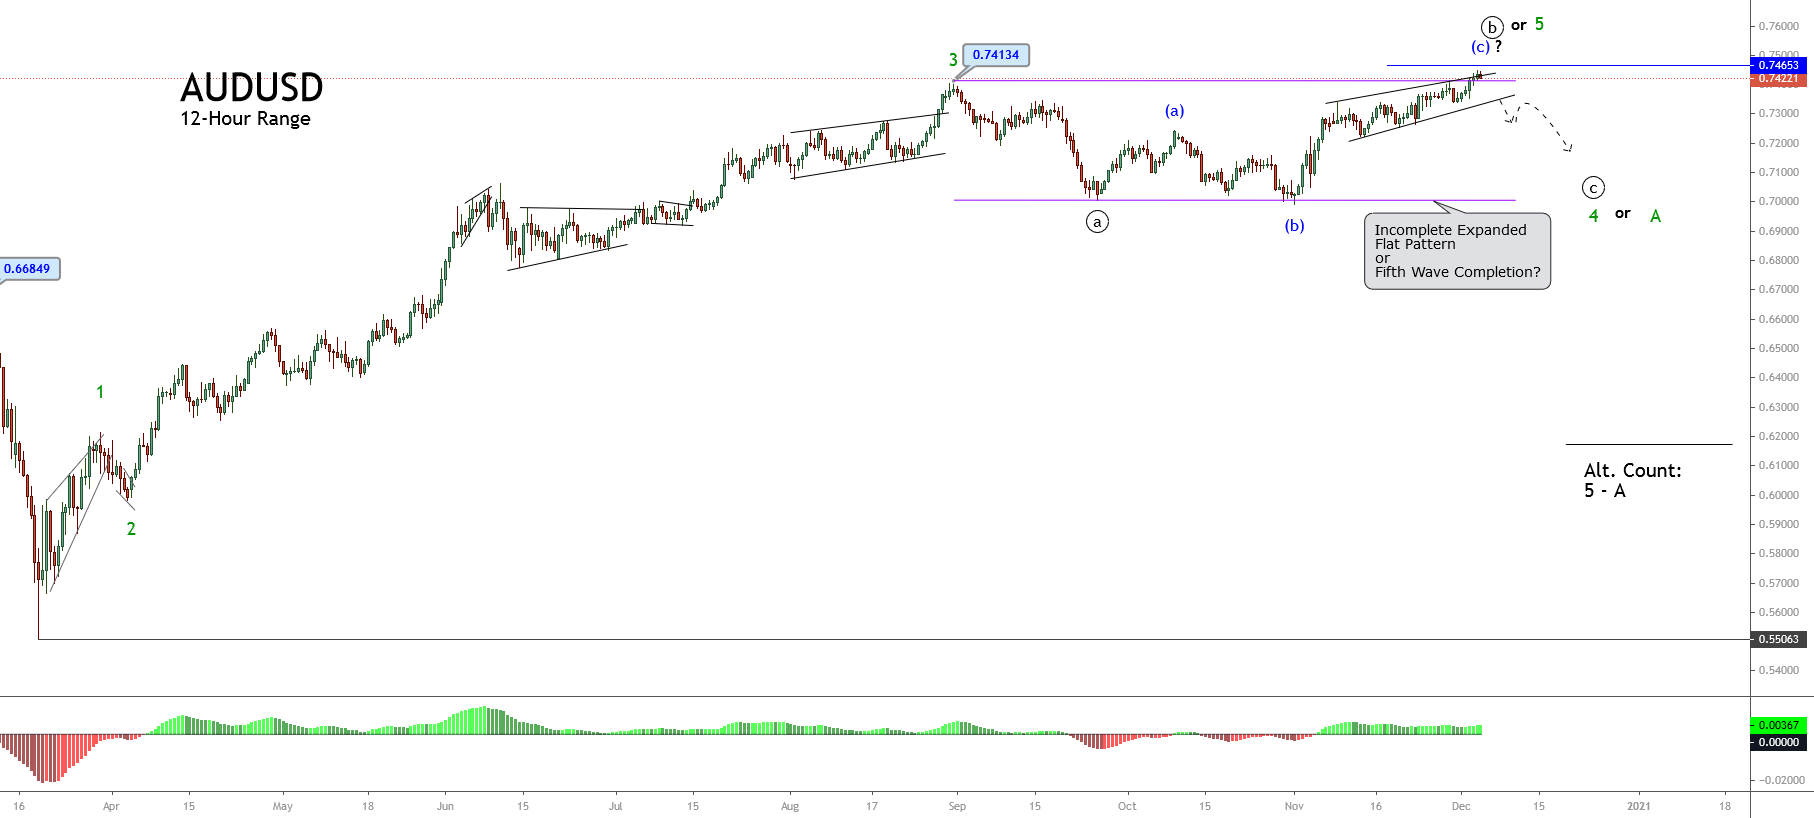
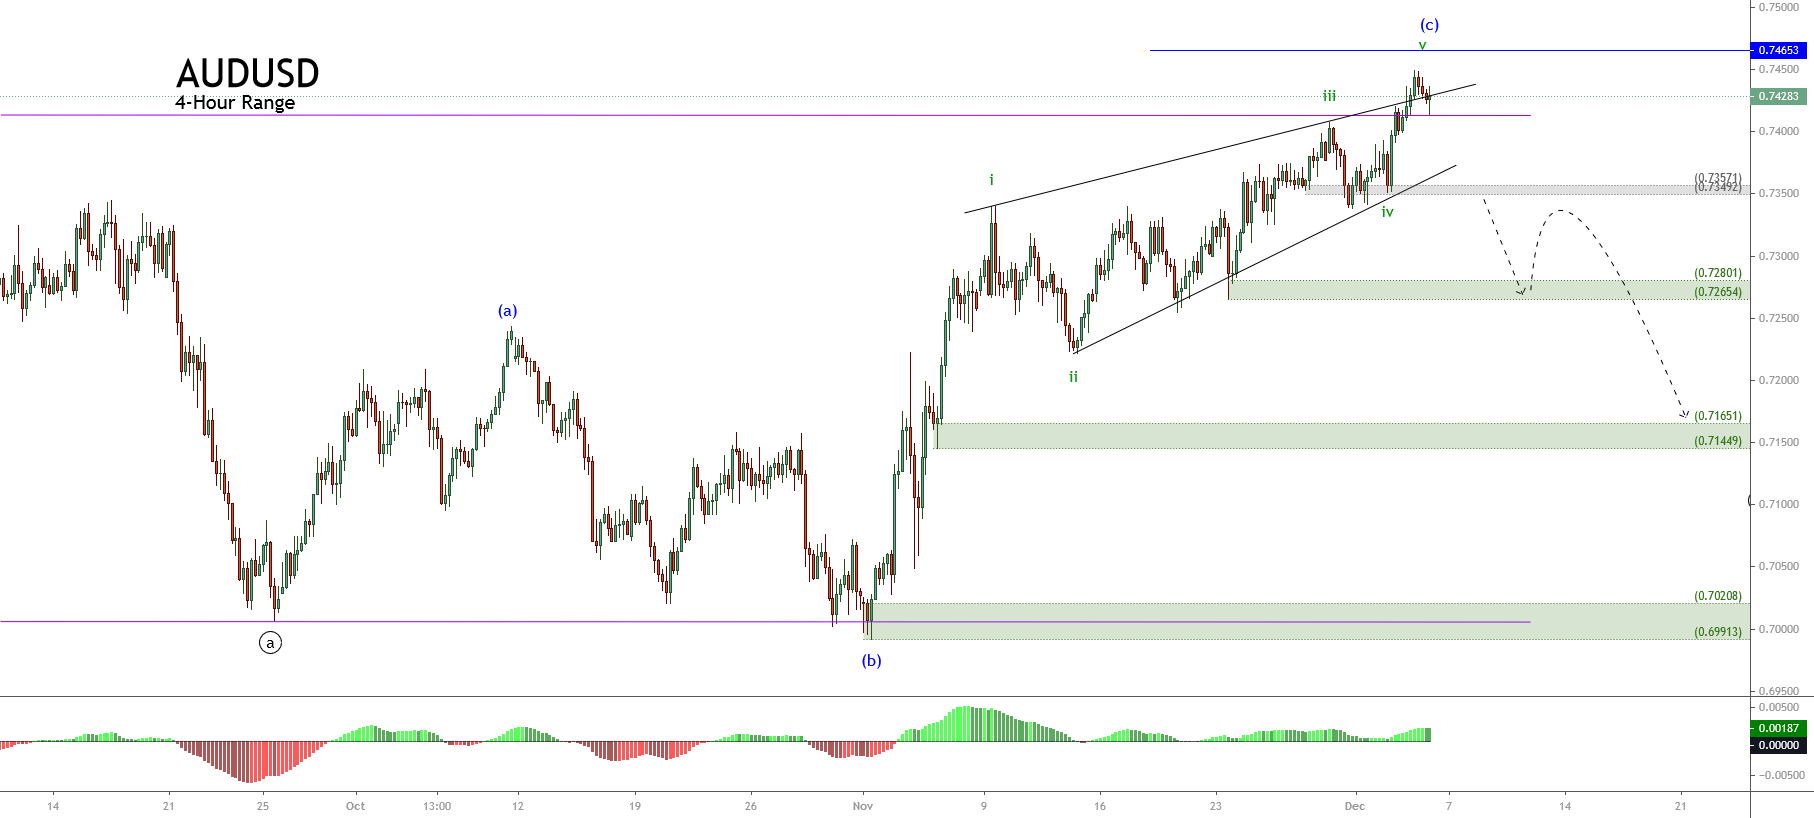
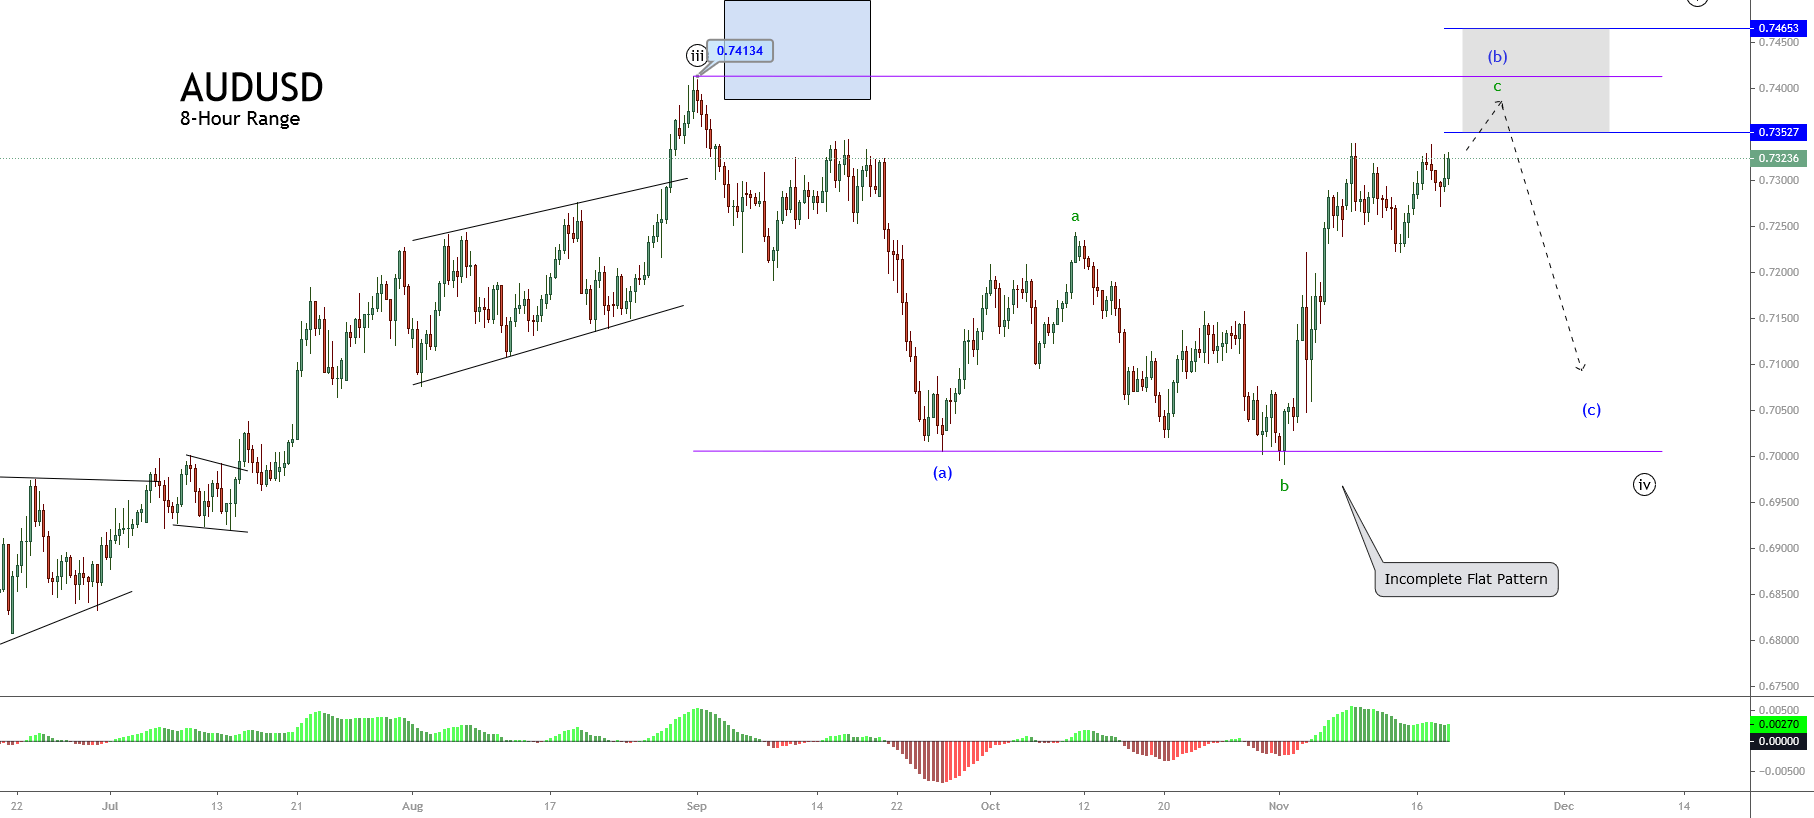
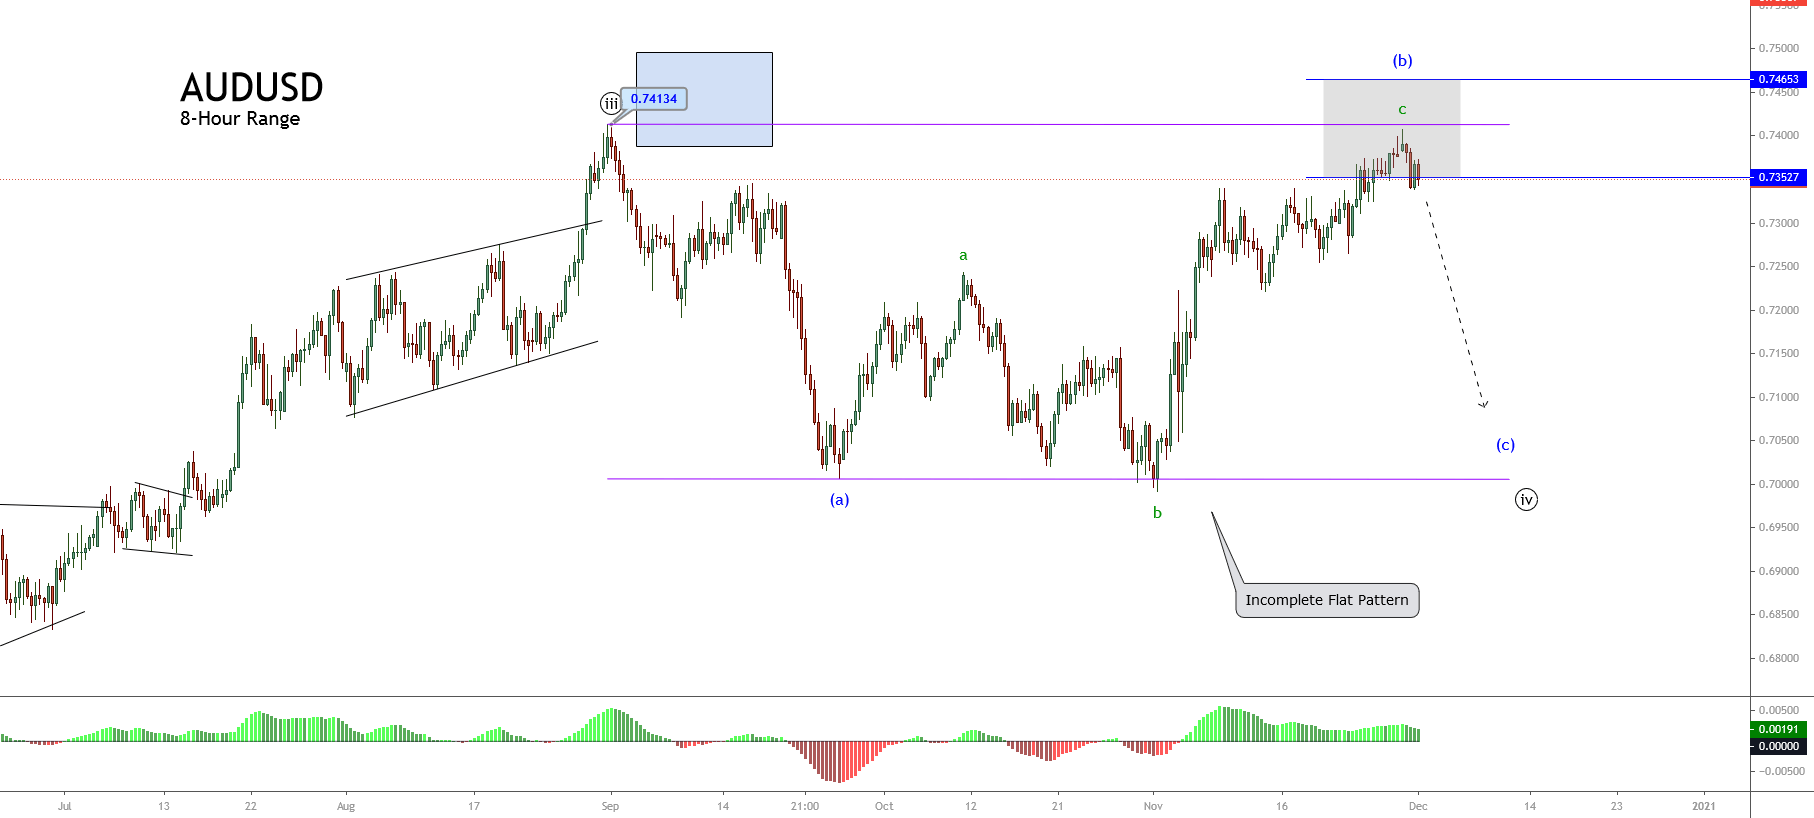
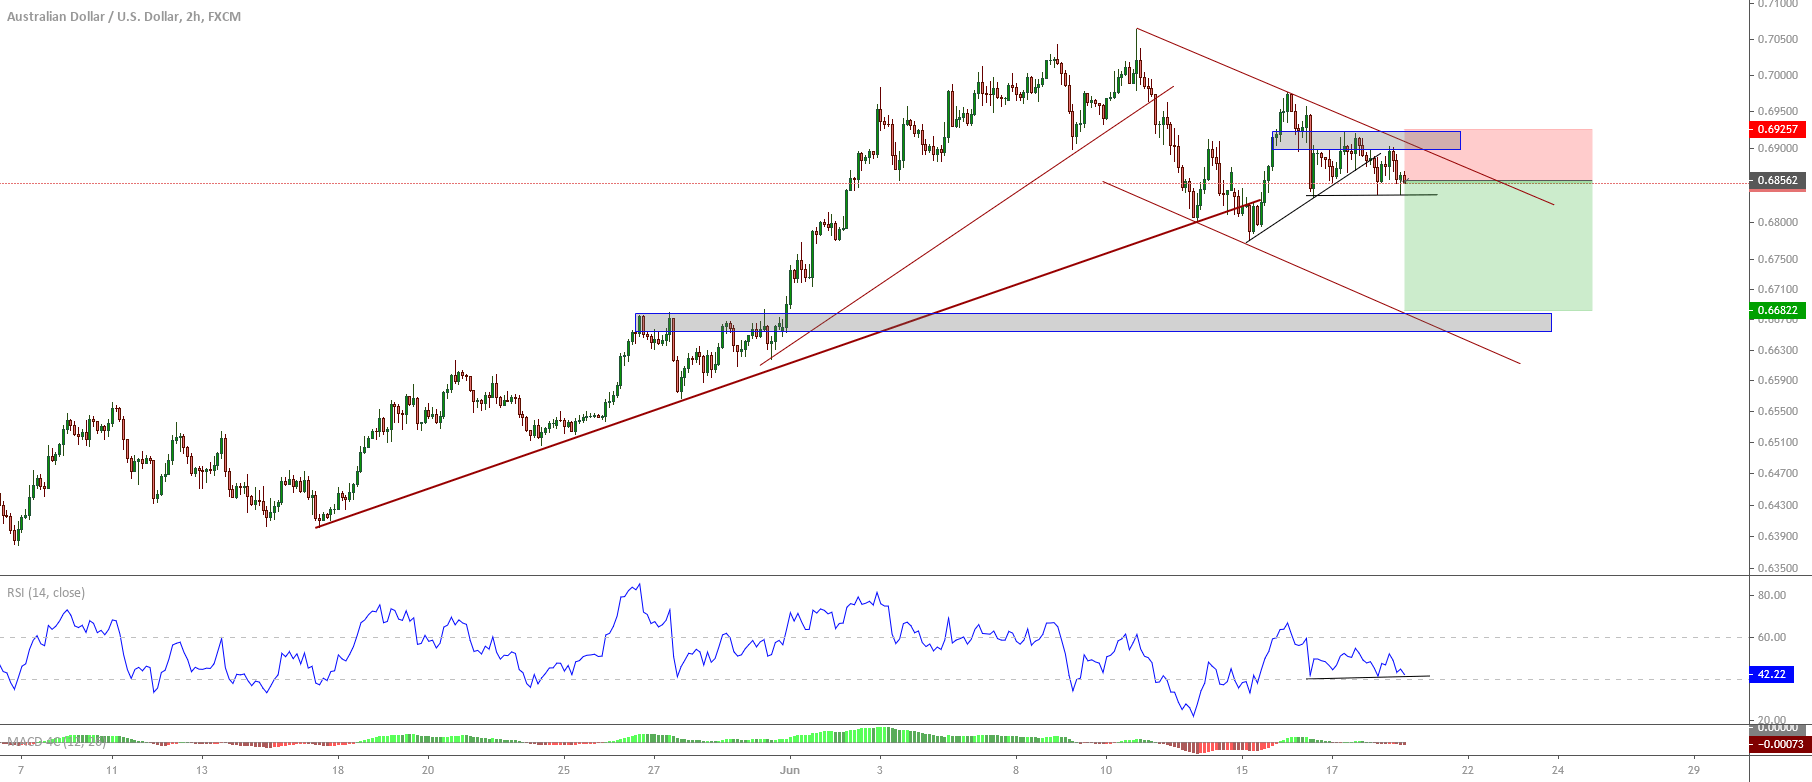
AUD/USD – Daily Analysis
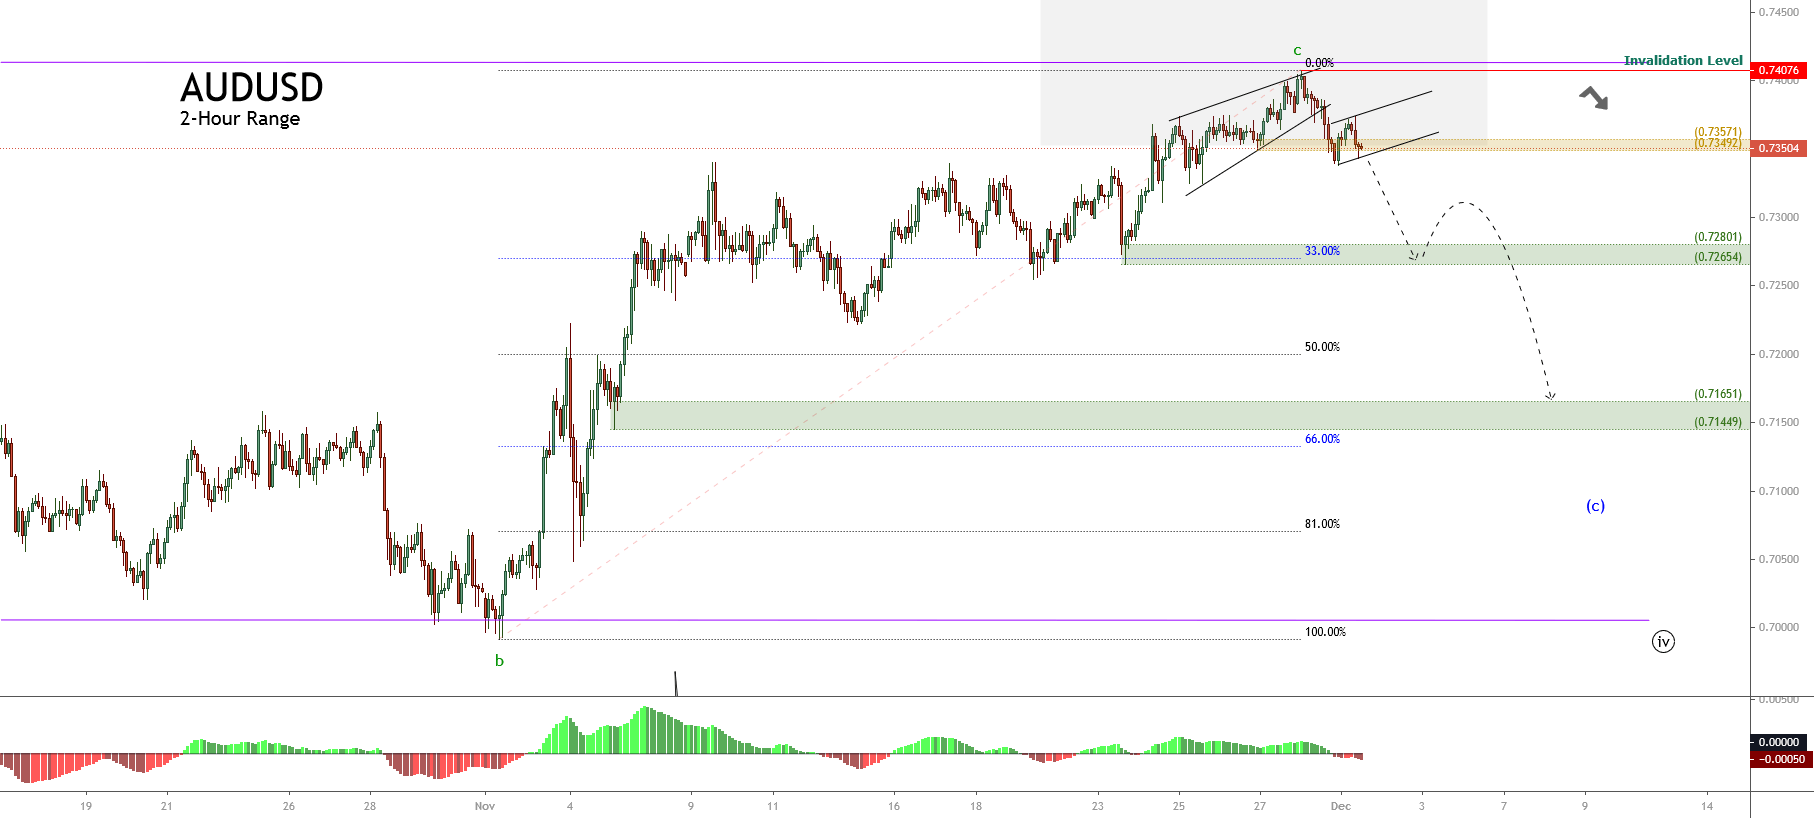
The AUD/USD failed to stop its previous losing streak and dropped to a 2-months low around below the mid-0.7000 level mainly due to the risk-off market sentiment, triggered by the renewed concern about the second wave of coronavirus infections, which continued weighing on investors sentiment and undermined the perceived riskier Australian dollar. The broad-based U.S. dollar strength, supported by the combination of factors, also dragged the currency down across the ocean. At the moment, the AUD/USD is currently trading at 0.7033 and consolidating in the range between 0.7029 – 0.7083.
The traders seem cautious to place any strong position ahead of the testimony by the Fed Chair Jerome Powell and Treasury Secretary Steven Mnuchin, which will influence the USD price dynamics and provide some fresh direction to the currency pair.
Worries that the coronavirus pandemic’s resurgence could ruin the global economic recovery keeps the market trading sentiment under pressure and weakened the perceived riskier Australian dollar. As per the latest report, the coronavirus COVID-19 cases continue to climb in Europe, U.K., and the U.S. Whereas, some E.U. countries are now facing the starting of the second wave coinciding with the onset of the flu season. That was witnessed after the World Health Organization’s regional director for Europe said that “We have a dire situation unfolding before us,” H further added that Europe’s number of weekly infections was higher now than at the first peak in March.
At the US-China front, the long-lasting tussle between the United States and China remains on the play as State Mike Pompeo took help from France, Germany, and the U.K. to reject China’s claims of the South China Sea at the United Nations (U.N.). This also exerted downside pressure on the market trading sentiment and contributed to the currency pair losses.
As a result, the broad-based U.S. dollar succeeded in extending its previous session gains and remained well bid on the day as investors turned to the safe-haven in the wake risk-off market sentiment. However, the U.S. dollar gains could be short-lived or temporary due to the worries that the U.S.’s economic recovery could be stopped because of the reappearance of coronavirus cases. Besides this, the gains in the U.S. dollar was further boosted after the hawkish comments by Chicago Fed President Charles Evans, that further quantitative easing may not provide additional support to the U.S. economy. However, the gains in the U.S. dollar kept the currency pair under pressure. Whereas, the dollar index, which pits the dollar against a bucket of 6-major currencies, stood at 94.336 on the day, close to a nine-week high.
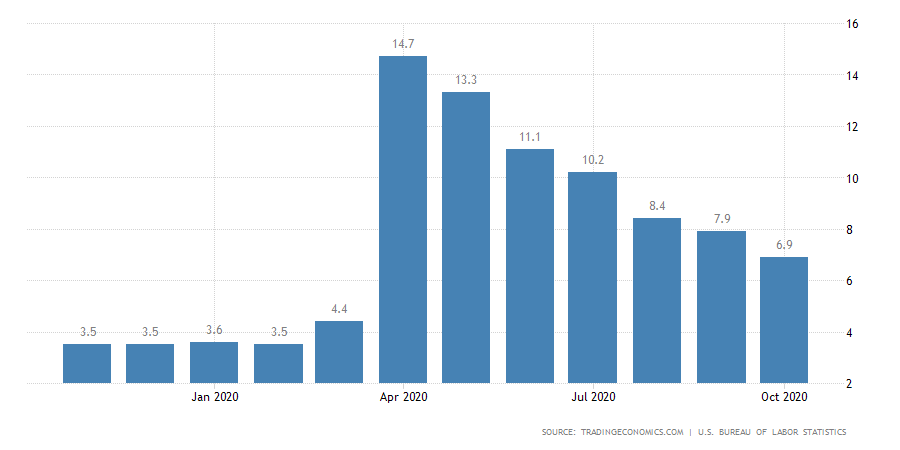
Moving Ahead, the traders will keep their eyes on the U.S. economic docket, which will show the release of Initial Weekly Jobless Claims and New Home Sales data. Apart from this, the U.S. Federal Reserve (Fed) Chair Jerome Powell’s testimony will also be closely observed. Across the ocean, the market risk sentiment and developments surrounding the coronavirus will not lose their importance.
Daily Technical Levels
Support Resistance
0.7035 0.7147
0.6996 0.7218
0.6924 0.7258
Pivot Point: 0.7107
AUD/USD– Trading Tip
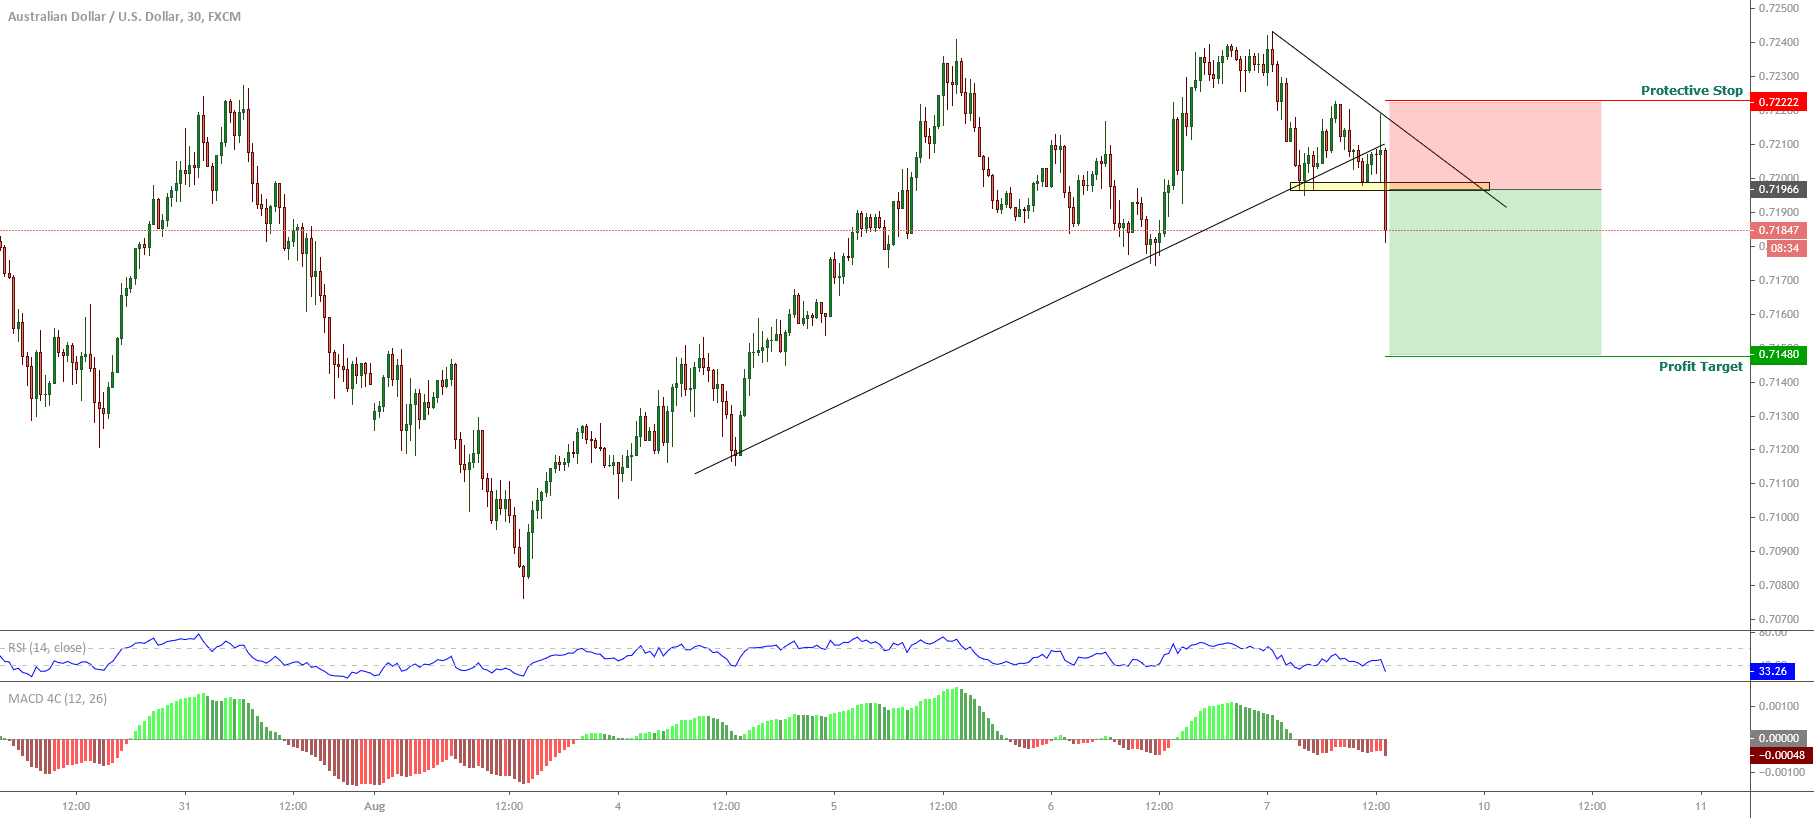
The stronger U.S. dollar has also driven sharp selling in the AUD/USD pair as it trades at 0.7042 level today. The AUD/USD pair has formed three black crows patterns on a daily timeframe, suggesting odds of selling bias in the AUD/USD. However, the AUD/USD has closed a Doji candle at 0.7042 level, and we may see some bullish correction over the 0.7001 support level until the next resistance level of 0.7098 and 0.7152 level.
USD/CAD– Daily Analysis
The USD/CAD currency pair extended its previous session bullish bias and kept gaining positive traction around above 1.3400 level, mainly due to the broad-based U.S. dollar strength. The bullish tone around the U.S. dollar was sponsored by the concerns over rising COVID-19 cases and fears of renewed lockdown measures, which kept the market trading sentiment under pressure and supported the greenback’s status as the global reserve currency.
On the flip side, the currency pair bullish bias could also be attributed to the weaker crude oil prices, which undermined the demand for the loonie, a commodity-linked currency, and contributed to the pair gains. Currently, the USD/CAD pair is trading at 1.3396 and consolidating in the range between 1.3370 – 1.3412.
As we already mentioned that the equity market had been flashing red since the Asian session started. The reason could be associated with the major negative catalysts. Be it the concerns about the second wave of coronavirus diseases or the fears of renewed lockdown measures, not to forget the long-lasting US-China tussle, all these factors weigh on the market trading sentiment and helping the U.S. dollar to put the safe-have bids. Apart from this, the slowdown in Europe, alongside concerns expressed by U.S. Federal Reserve officials over the U.S. economy, pushed the equity market down.
The broad-based U.S. dollar keeps its gaining streak and still reporting gains on the day amid market risk-off sentiment. However, the U.S. dollar gains could be short-lived or temporary as worries that the U.S.’s economic recovery could be stopped amid the resurgence of the second wave of coronavirus cases. Besides this, the U.S. dollar gains were further boosted by the hawkish comments by Chicago Fed President Charles Evans, suggesting that further quantitative easing may not provide additional support to the U.S. economy. However, the gains in the U.S. dollar kept the currency pair higher. Whereas, the dollar index, which pits the dollar against a bucket of 6-major currencies, stood at 94.336 on the day, close to a nine-week high.
Across the pond, the crude oil prices failed to stop its previous session, losing streak and remained pressed around below the mid-$39.00 marks. Besides, the possibilities of Libya resuming oil exports added further bearish pressures around the crude oil prices. Thus, the declines in crude oil prices undermined demand for the commodity-linked currency the loonie and contributed to the currency pair gains.
Looking forward, the traders will keep their eyes on the U.S. Federal Reserve (Fed) Chair Jerome Powell’s testimony. Furthermore, the U.S. Jobless Claims and Housing data will also be key to watch. Whereas, the updates concerning the US-China relations and the U.S. stimulus package will not lose their importance.
Daily Technical Levels
Support Resistance
1.3323 1.3418
1.3260 1.3450
1.3228 1.3513
Pivot Point: 1.3355
USD/CAD– Trading Tip
The USD/CAD is trading with a bullish bias at 1.3402 level, having violated the ascending triangle pattern at 1.349 level, and now it’s heading further higher until the next resistance level of 1.3460. The MACD and three white soldiers pattern is suggesting chances of bullish bias in the pair. In contrast, the pair has also crossed over 50 periods EMA at 1.3254 level. Today we should consider taking a buying trade over 1.3349 level to target the 1.3462 level.
USD/JPY – Daily Analysis
The USD/JPY pair was closed at 105.362 after placing a high of 105.494 and a low of 104.847. The pair USD/JPY extended its gains on Wednesday for the third consecutive day and peaked six previous days. The rising USD/JPY prices were due to the strong rebound of the U.S. dollar’s safe-haven status and upbeat market data.
On Wednesday, the U.S. dollar was strong due to Fed officials’ more hawkish comments that raised the U.S. dollar and helped it regain its safe-haven status. The strong bullish momentum in the USD/JPY pair was also supported by Japan’s weak PMI data on Wednesday.
At 05:30 GMT, the Flash manufacturing PMI from Japan for the month of September declined to 47.3 against the projected 48.0 and weighed on the Japanese Yen. The figures showed that Japan’s manufacturing sector viewed contraction in September that was negative for local currency but positive for the USD/JPY pair. At 09:30 GMT, All Industrial Activity in September remained flat at 1.3% from Japan.
On the U.S. front, the Housing Price Index for July advanced to 1.0% against the expectations of 0.4% and supported the U.S. dollar that helped the gains of USD?JPY pair on Wednesday. At 18:45 GMT, the highly awaited Flash Manufacturing PMI also rose to 53.5 against the anticipated 52.5 and supported the greenback that added further gains in the USD/JPY pair. However, the Flash Services PMMI remained flat with a projection of 54.5.
Meanwhile, the President of the Federal Reserve Bank of Cleveland, Loretta Mester, said on Wednesday that the U.S. economy had rebounded significantly from the losses caused by the pandemic induced lockdowns. However, she also said that the recovery was still narrow and was not sustainable. The Fed Vice Chair Randal K. Quarles said that the coronavirus event was an enormous economic shock in the first half of 2020. He also said that the recovery was underway, but a full recovery was far off as the risks remain on the downside.
Apart from this, the Fed Chair Jerome Powell, in his testimony, faced many questions regarding the next round of stimulus package. He replied that the difference between Democrats & Republicans over the package’s size remains and caused a delay. Powell also urged more spending to help the economy recover from the pandemic crisis. All these developments raised the U.S. dollar prices due to its safe-haven status and boosted the USD/JPY pair.
Moreover, the tensions between the U.S. and China also escalated after U.S. President Donald Trump blamed China and called for holding it accountable for the global spread of coronavirus. In response to this, Chinese President XI Jinping accused Trump of lying and insulting the platform of the U.N. He also said that he had no intension of having a cold war with any country. These harsh comments from both sides also raised uncertainty and helped the U.S. dollar to gain traction due to safe-haven nature and post gains in the USD/JPY pair on Wednesday.
Daily Technical Levels
Support Resistance
105.0000 105.6100
104.6400 105.8600
104.3900 106.2100
Pivot Point: 105.2500
USD/JPY – Trading Tips
The USD/JPY is trading with a bullish bias to trade at 105.460 level, and the series for EMA are now extending at 105.550 level. On the lower side, the support stays at 104.840 level. The MACD is also in support of bullish bias amid a stronger U.S. dollar and reduced safe-haven appeal. Bullish crossover of 105.550 level may drive more buying until 106.258. The idea is to stay bearish below the 105.470 level today. Let’s wait for Jobless Claims from the U.S. to determine further trends. Good luck!
 (Source: tradingeconomics.com)