Description
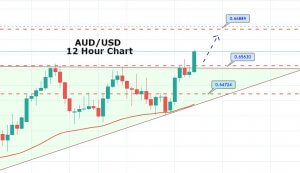
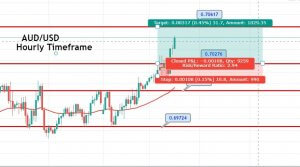
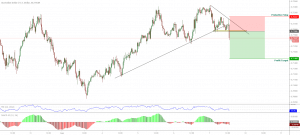
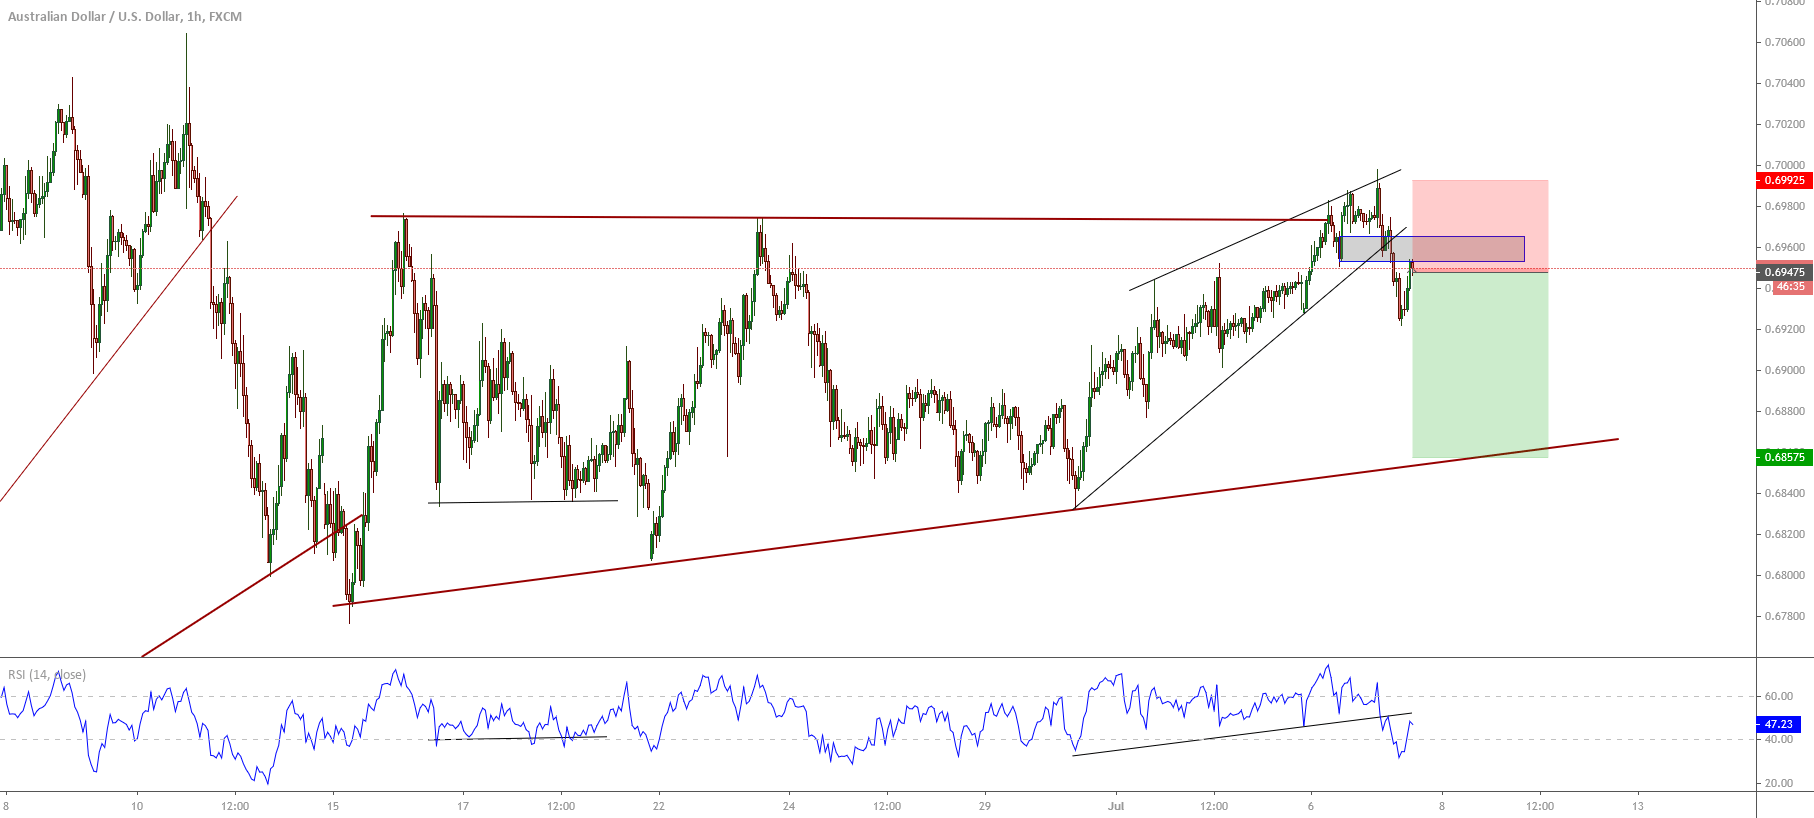
The AUDUSD pair in its hourly chart reveals a breakdown of an ascending diagonal pattern triggered by the RBA rate decision realized on the overnight trading session.

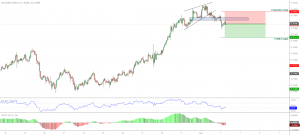
The breakdown experienced by the Aussie exposes in the RSI oscillator the penetration below the level-40, which makes us conclude that the market bias changed from the bullish to bearish.
Currently, in the hourly chart, we observe a recovery that could bring us the opportunity to incorporate us into the next bearish movement with a potential profit target in the area of the mid-term ascending trendline at 0.6857.
The invalidation level of our bearish outlook locates at 0.6992.
Chart
Trading Plan Summary
- Entry Level: 0.6947
- Protective Stop: 0.6992
- Profit Target: 0.6857
- Risk/Reward Ratio: 2
- Position Size: 0.01 lot per $1,000 in trading account.