Description
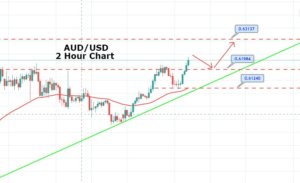
The AUDUSD pair, in its hourly chart, exposes a downward sequence after surpassed the psychological barrier of 0.74 on the Tuesday trading session. In the same way, the re-test and bounce of the U.S. Dollar index at 91.75, the lowest level since mid-May 2018, lead us to expect further movement in favor of the Greenback for the following trading sessions.
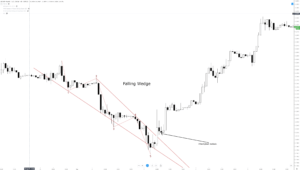
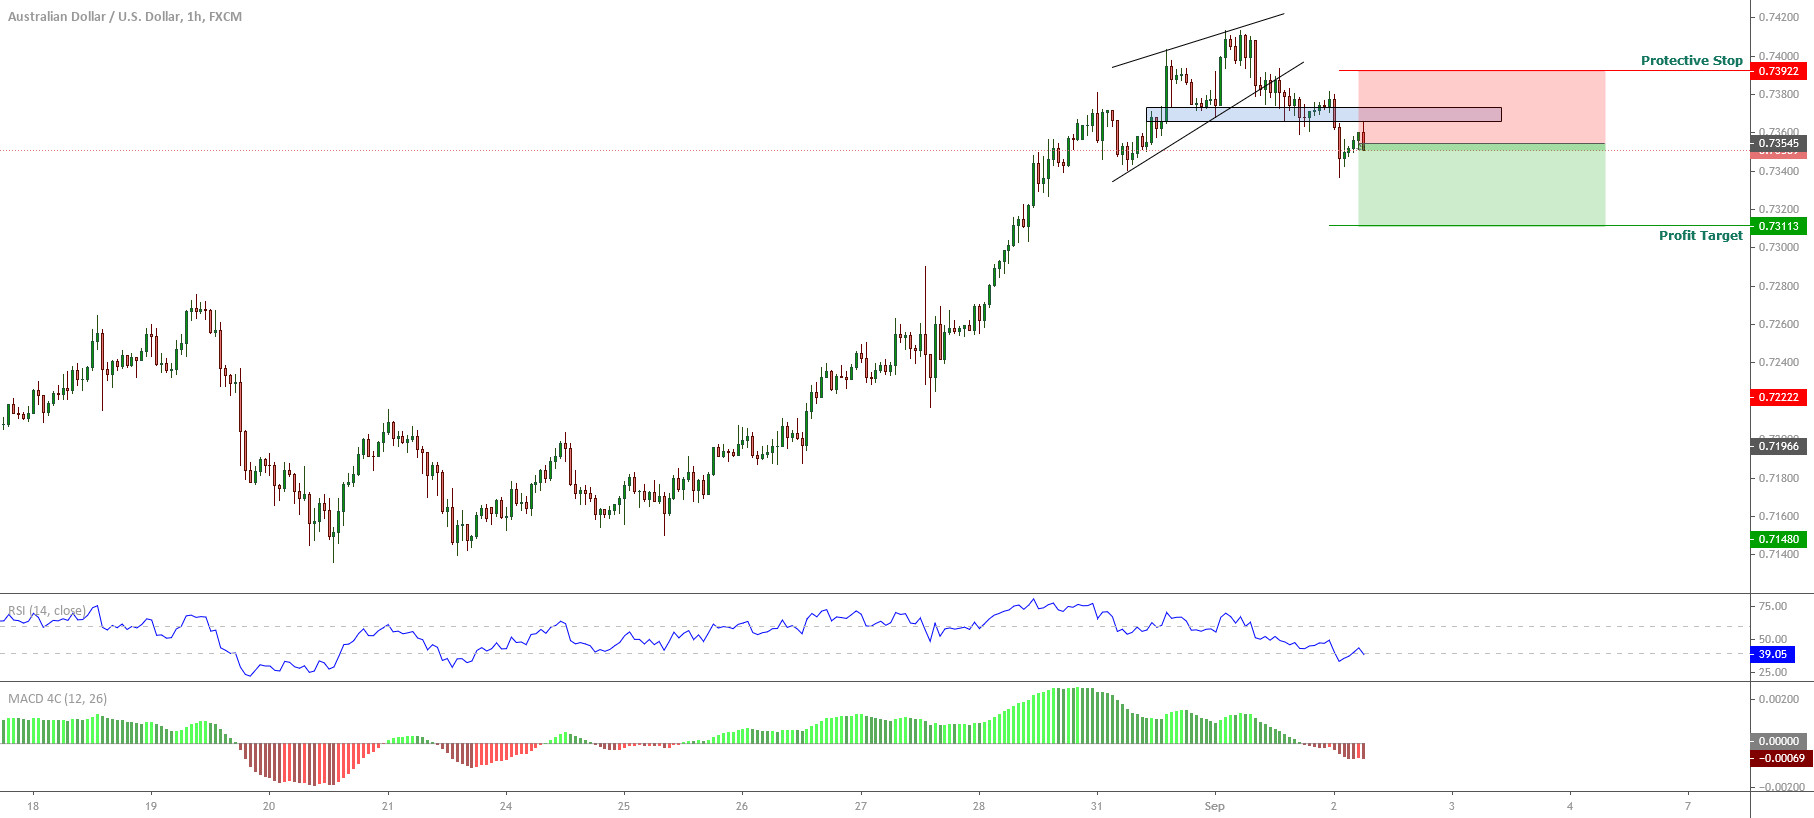
From the next chart, we observe a downward movement after the breakdown of an ascending wedge pattern. The consolidation below the last relevant swing at 0.7365(blue box) and the RSI oscillator moving below level 40 confirms the intraday bearish bias that should lead the coming sessions.
The movement below the level 0.7365 carries us to weight bearish positions expecting intraday profits at 0.7310, which corresponds to the last consolidation level of August 28th.
Our invalidation level is located at 0.7392, which corresponds to the first congestion zone after the first drop of the ascending wedge pattern.
Chart
Trading Plan Summary
- Entry Level: 0.7354
- Protective Stop: 0.7391
- Profit Target: 0.7309
- Risk/Reward Ratio: 1.22
- Position Size: 0.01 lot per $1,000 in trading account.
Check out the latest trading signals on the Forex Academy App for your mobile phone from the Android and iOS App Store.