Wedge Patterns
I want to stress, again, that the frequency and positive expectancy of patterns in technical analysis will vary from market to market. Most of the literature is written for the stock market, which is an overwhelmingly long-biased market. So, bullish patterns perform much better than bearish patterns in the stock market. I don’t have any real statistics to reference other than my years of trading experience. It has been my experience that wedge patterns are one of the most profitable setups in the forex market.

Wedges look like (and in fact, are) extended triangles. Wedges are made of two trend lines that are drawn just like a triangle. The difference between wedge patterns and triangle patterns is simple: the trendlines in a wedge pattern point in the same direction. Ascending triangles have flat tops and a rising bottom. Descending triangles have flat bottoms with declining tops. Symmetrical triangles have a downtrend line and an uptrend line. Wedges are different. Rising wedges have a trendline both above and below price sloping up. Falling wedges have a trendline both above and below, but sloping down. Depending on the technical analysis material you read, you will see wedges that may look like channels, and that is fine – many do.
Wedge patterns should tell you one thing: the end is coming. Because wedges have two trendlines that point in the same direction, the slope of the move is often extreme and is indicative of a climax move. These are incredibly profitable and favorable patterns when you spot them – and they are horrible to trade against if you are trading inside of them. If you read Bulkowski’s work, you’ll know that he recommends at the trendlines in a wedge should be touched at least five times in order for the wedge pattern to authentic. This is true in the stock market as well as in the forex market.
Rising Wedge
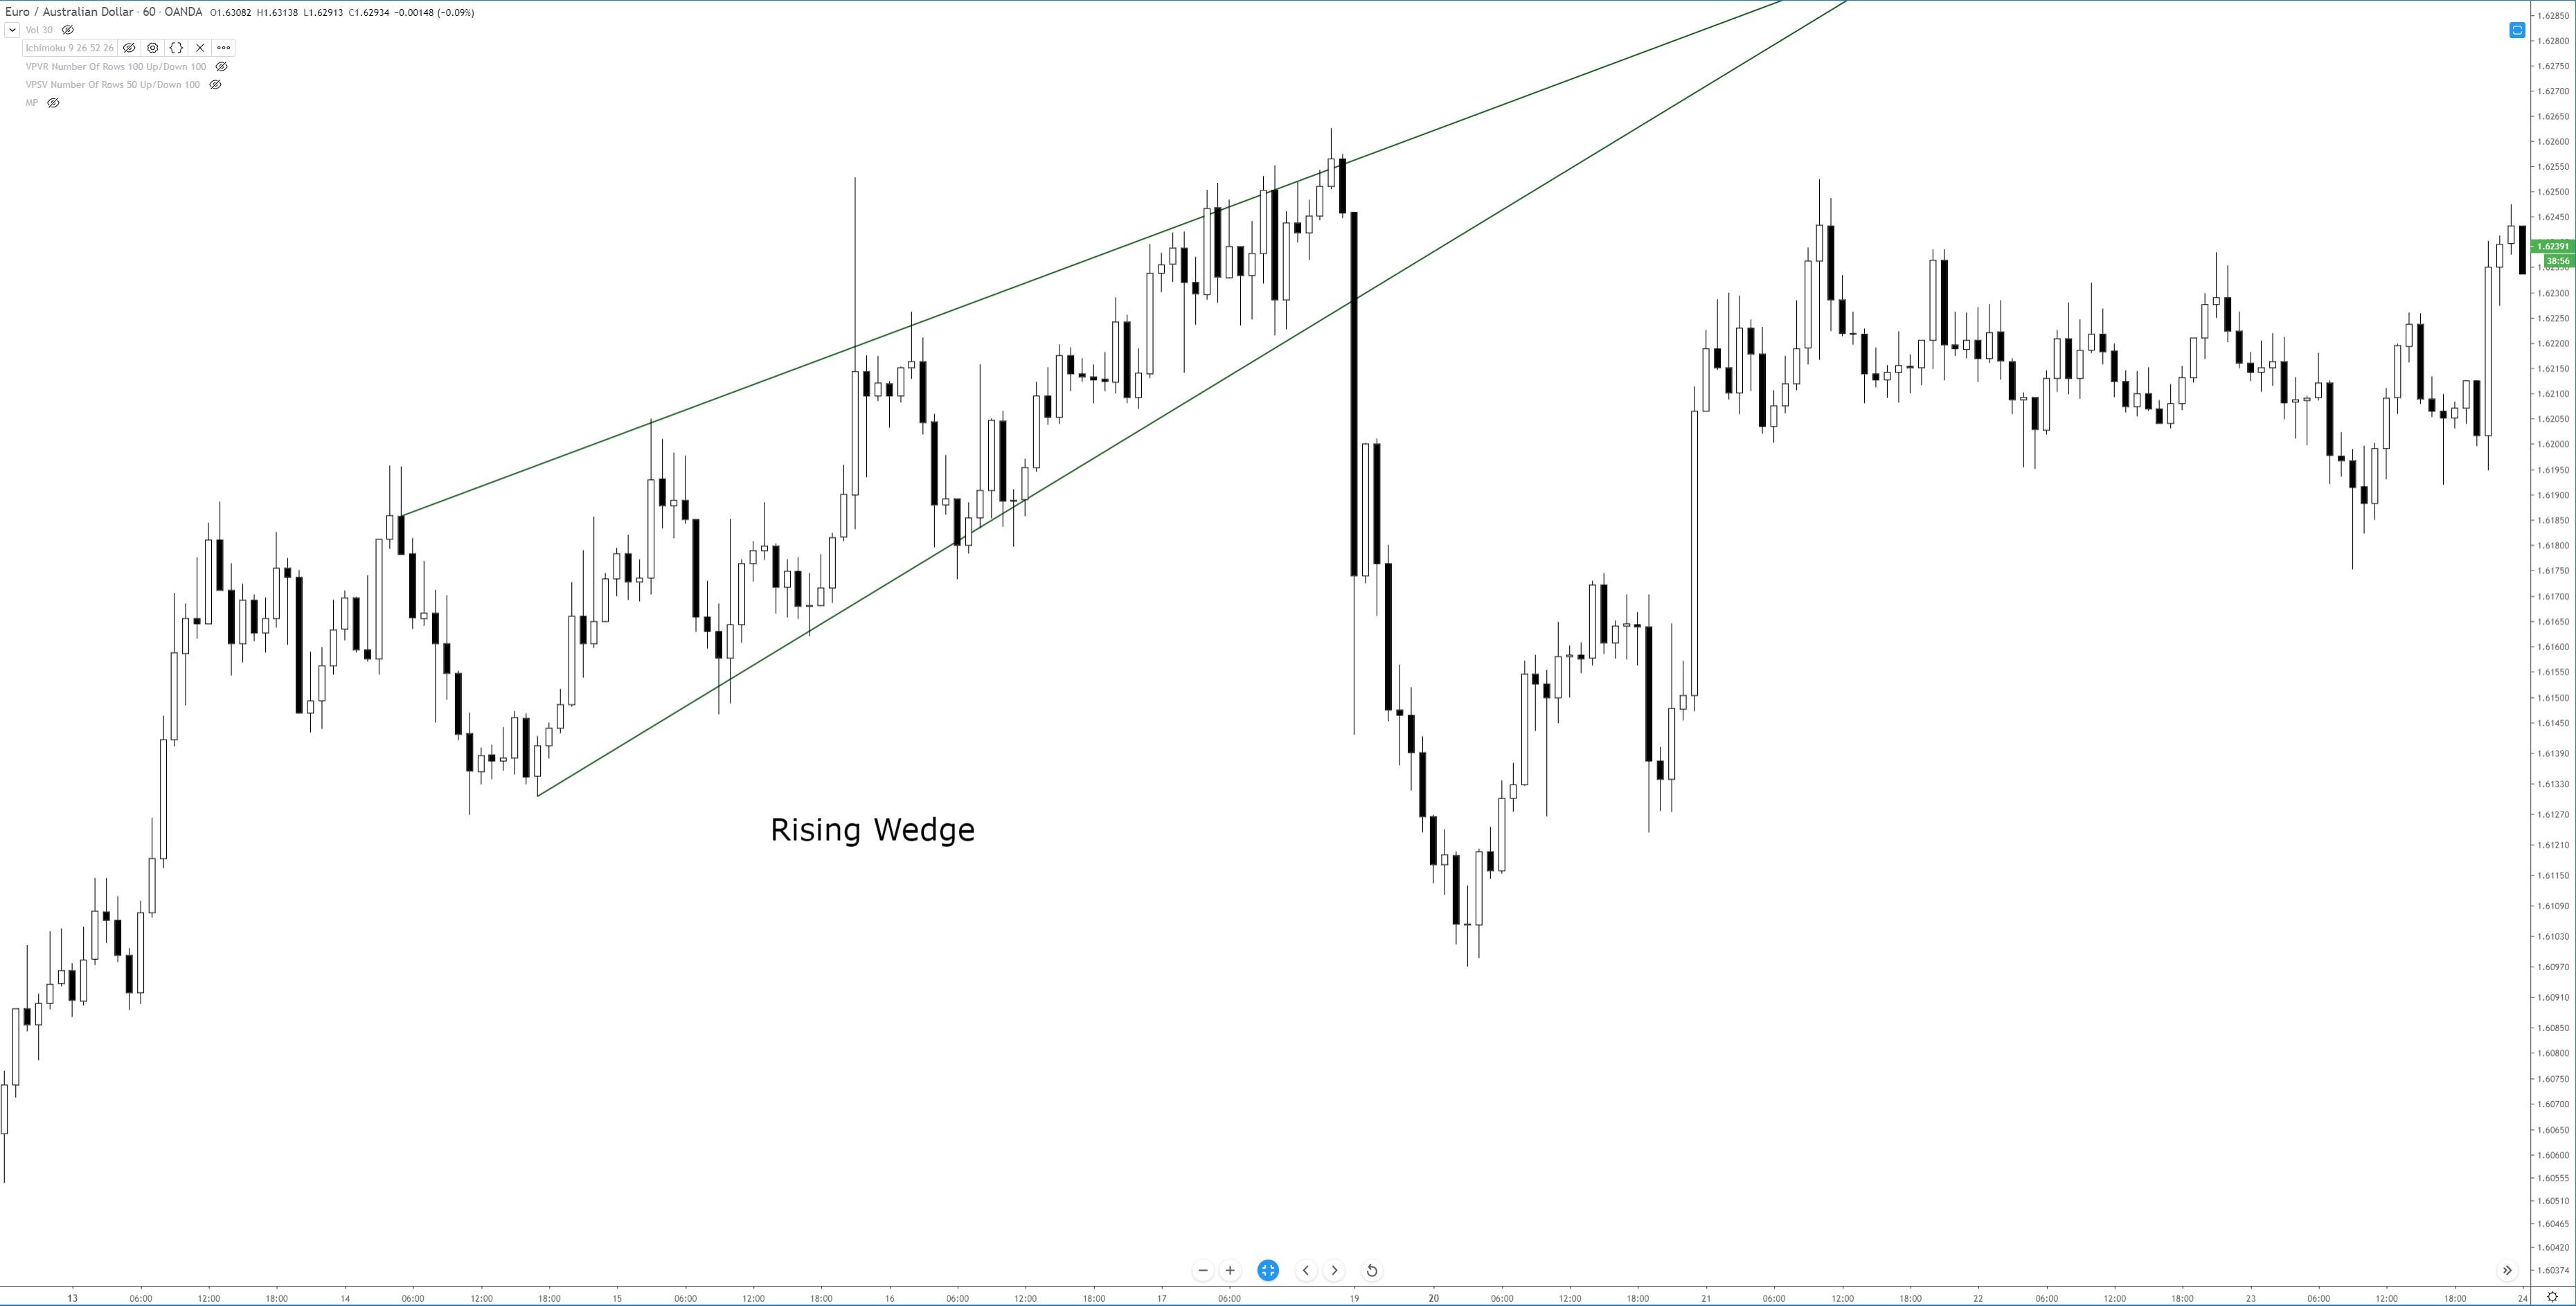
You might think that a rising wedge pattern shows up at the top of a trend, and it often does. But you will also find the rising wedge appear at the bottom of a trend. When you see the rising wedge appear after a prolonged downtrend, be careful! The rising wedge that forms after a long bear move is often a continuation pattern. An easy way to think of the rising wedge is that it is an overwhelmingly bearish pattern. It doesn’t matter where it shows up in any trend – it is an extremely bearish pattern.
When I am trading the rising wedge, I generally take the initial breakout that moves below the second to last test of the bottom trendline. The example above shows that there is no immediate retest of the breakout lower. Retests do happen, but they are less frequent than what we see in the ascending, descending and symmetrical triangles.
Falling Wedge
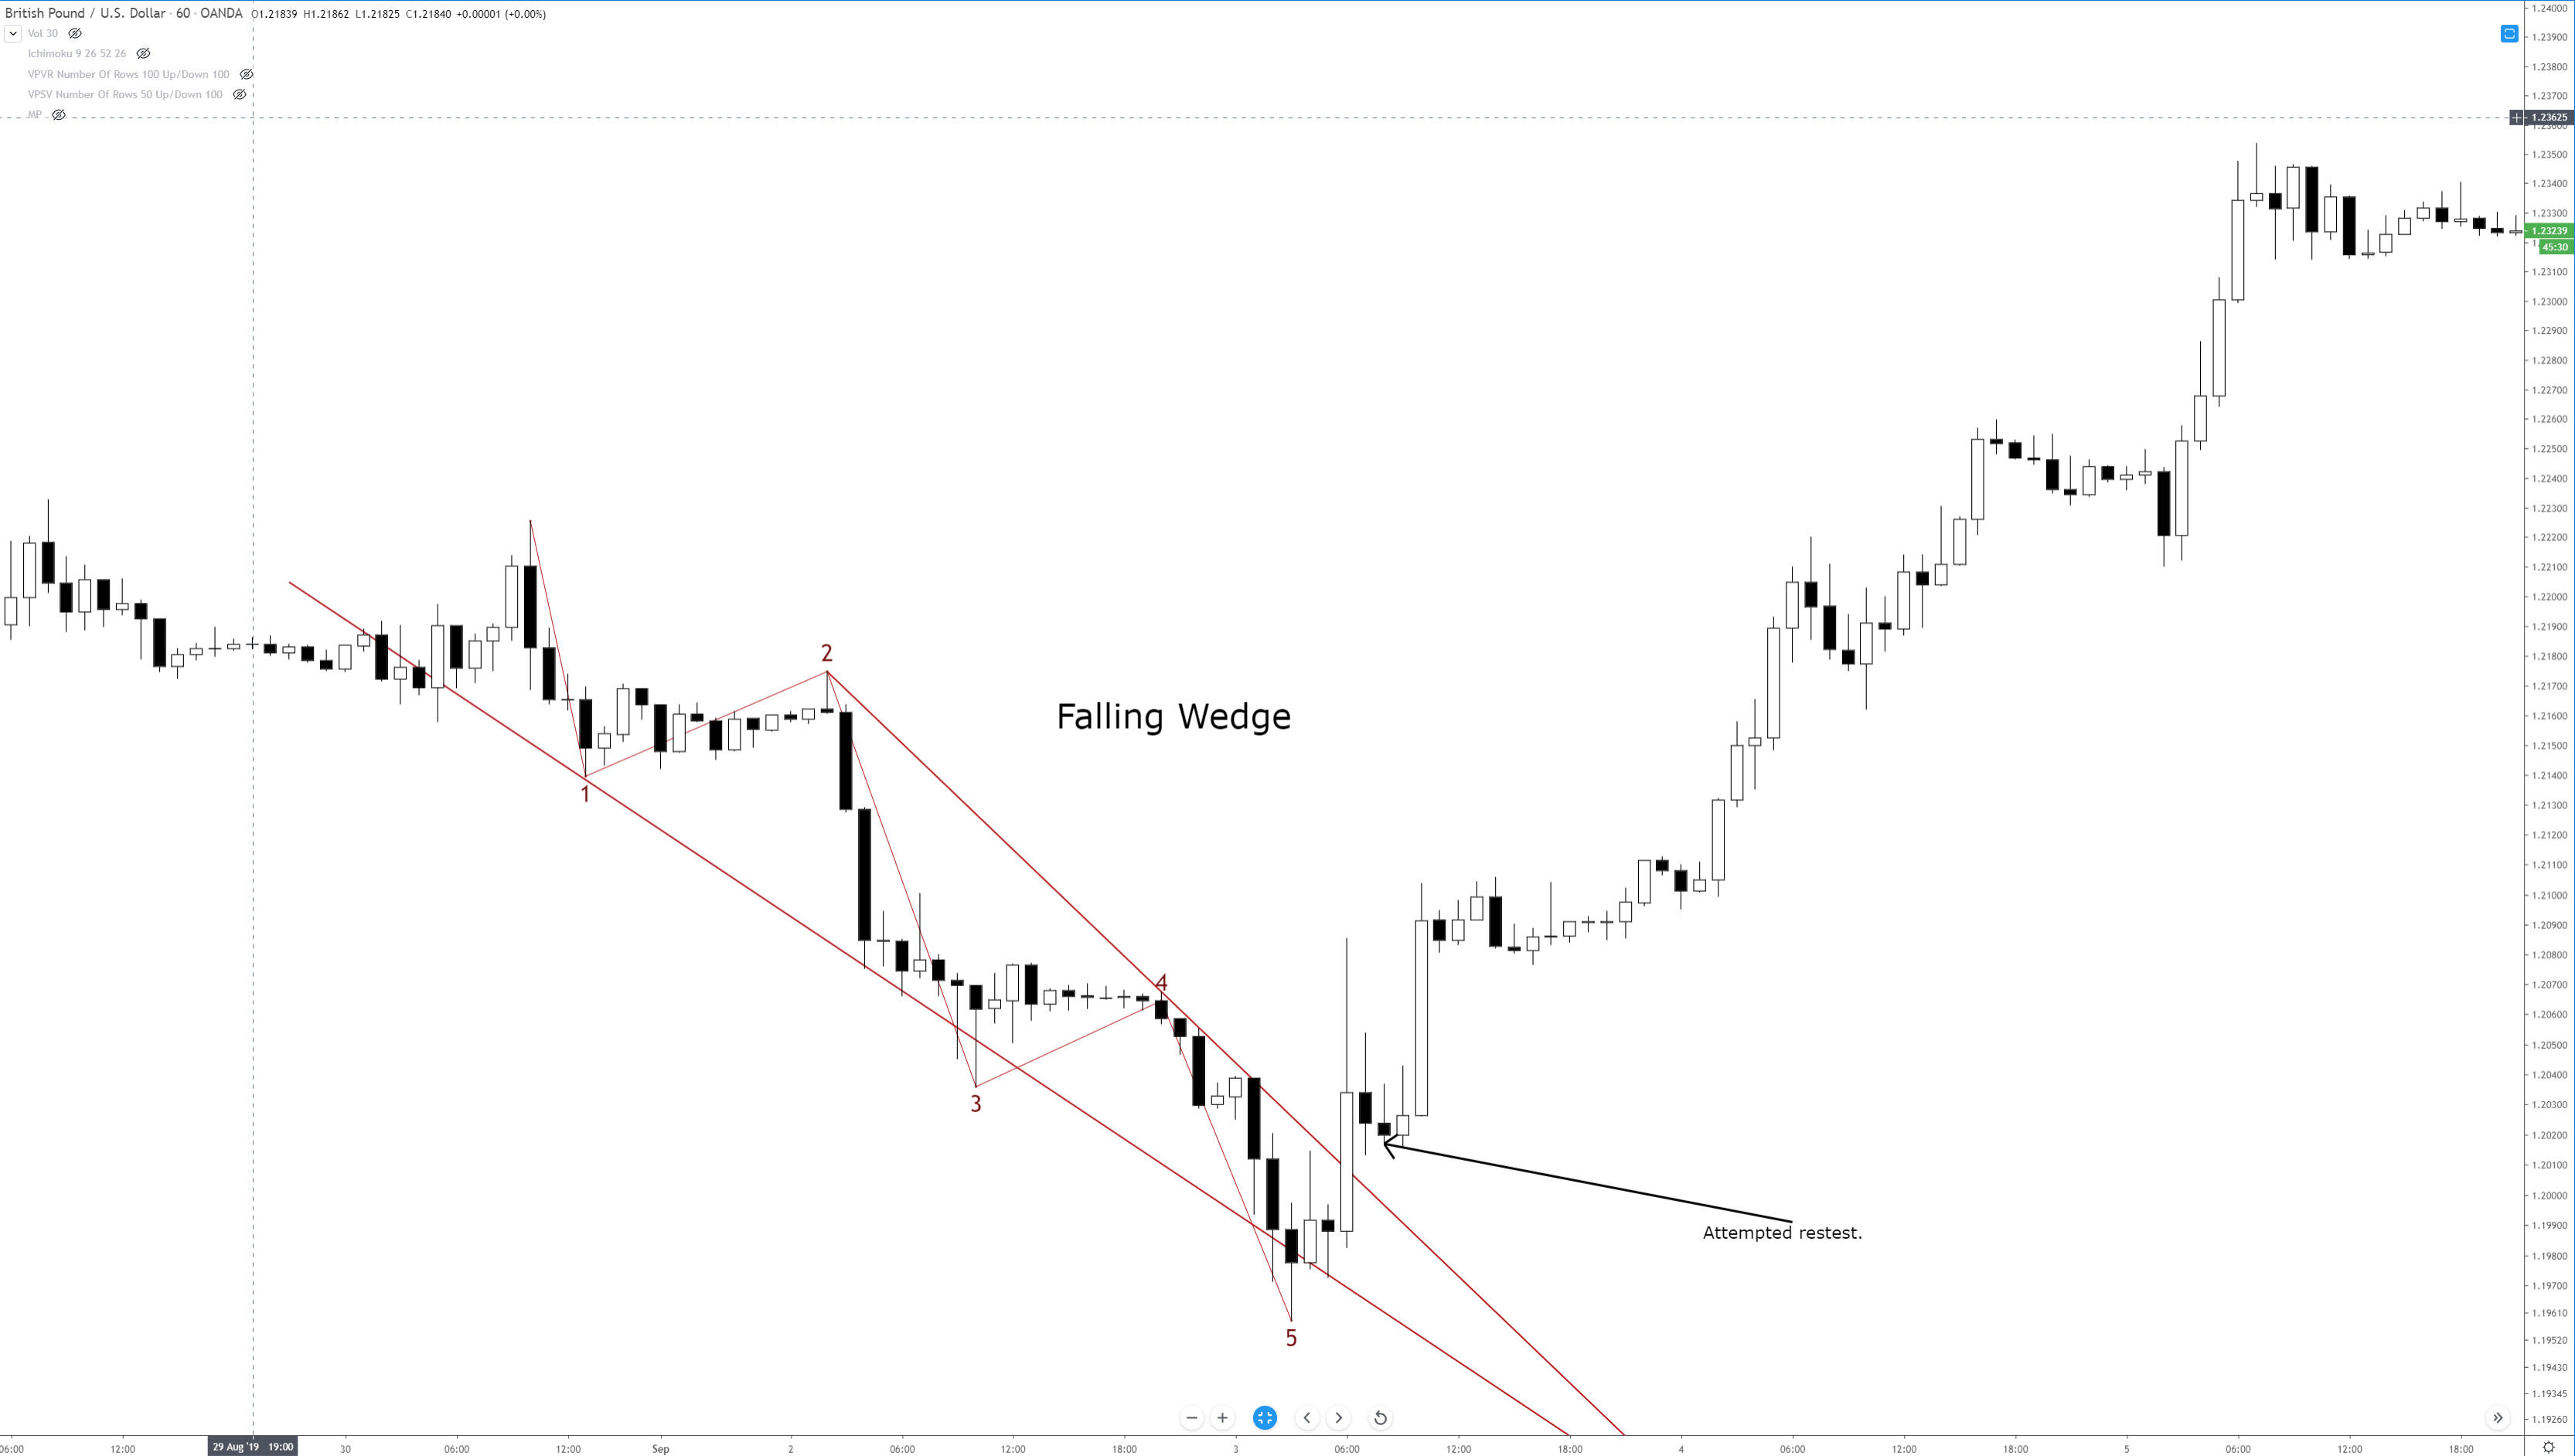
The inverse of the rising wedge pattern is the falling wedge pattern. It can show up at either the end of an uptrend or a downtrend. If you see a falling wedge that occurs at the top of an uptrend, then you could we witnessing a false breakdown lower and see a resumption of the prior bull move. If you see the falling wedge at the end of a downtrend, then you can expect a swift reversal or deep throwback. Just like the rising wedge, the falling wedge is heavily biased towards one direction: overwhelmingly bullish.
On the image above, I’ve added an Impulse Wave to show how you can use Elliot Waves to help determine whether or not a wedge pattern is valid. Remember: Bulkowski said that that a wedge pattern is only confirmed when the trendlines have been tested at least five times. Another condition on the chart above that we didn’t see on the falling wedge is the attempted retest of the break. Again, retests are common in all patterns, but they are definitely less frequent with wedge patterns – that has been my experience with them in forex markets.
When trading the falling wedge, I like to enter when price moves above the second to last swing high. On the chart above, the entry would be above wave four.
Sources:
Kirkpatrick, C. D., & Dahlquist, J. R. (2016). Technical analysis: the complete resource for financial market technicians. Upper Saddle River: Financial Times/Prentice Hall.
Bulkowski, T. N. (2013). Visual guide to chart patterns. New York, NY: Bloomberg Press.
Bulkowski, T. N. (2008). Encyclopedia of candlestick charts. Hoboken, NJ: J. Wiley & Sons.
Bulkowski, T. N. (2002). Trading classic chart patterns. New York: Wiley.

One reply on “Chart Patterns: Wedge Patterns”
excellent article. i like wedges, i mainly trade them on the d1 or weekly charts though as i find on the hourly too fast for my liking and i hate being at the screen waiting for something to happen.