Introduction
In our previous educational article, we presented a set of trend reversal patterns, which allowed the investor to participate from the beginning of a new trend. Sometimes, however, for various reasons, the investor doesn’t join the latest trend. When this situation occurs, a continuation pattern may present an opportunity for the investor to join and make an entry to the trend in progress.
In this educational article, we’ll present a set of continuation patterns that help traders to time new trades in the direction of the established trend.
Triangles
There are three basic types of triangles: symmetrical, ascending, and descending. A triangle pattern must contain at least two peaks and two valleys; however, considering the odds of a false breakout, in conservative trading, the investor should wait for the third peak (or valley) to complete and be able to recognize two valleys (or peaks) in the pattern.
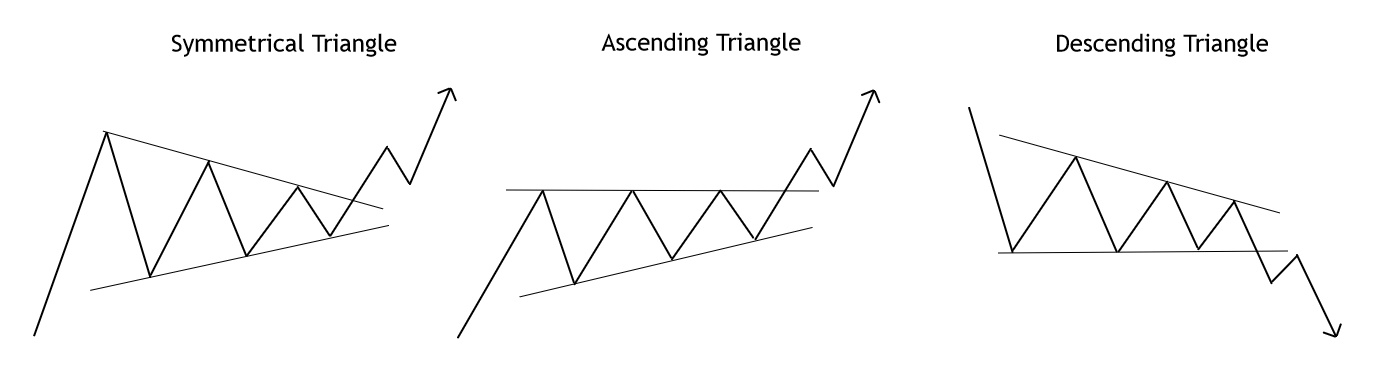
The symmetrical triangle is characterized by having two converging trend lines. In a bull market, a buy-side position will trigger once the price breaks and closes above the upper trend line. The confirmation of this setup is given by a close above the last peak preceding the breakout.
On the ascending triangle, the upper trendline is horizontal and represents a short-term resistance, while the baseline is an ascending dynamic support. A market entry will be activated once the price breaks and closes above the horizontal guideline.
The descending triangle is a bearish continuation pattern in which the base guideline is short-term support, and the descending upper trendline acts as a dynamic resistance. A sell-side signal will rise once the price break and closes below the horizontal guideline.
The initial profit target corresponds to the range of the bigger height of the triangle pattern projected from the breakout level in the trend direction.
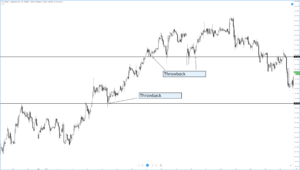
Rectangle Pattern
The rectangle formation generally acts as a continuation pattern; however, it can sometimes act as a reversal pattern when the price action develops a triple top or bottom structure. The next figure represents the rectangle pattern breakout.
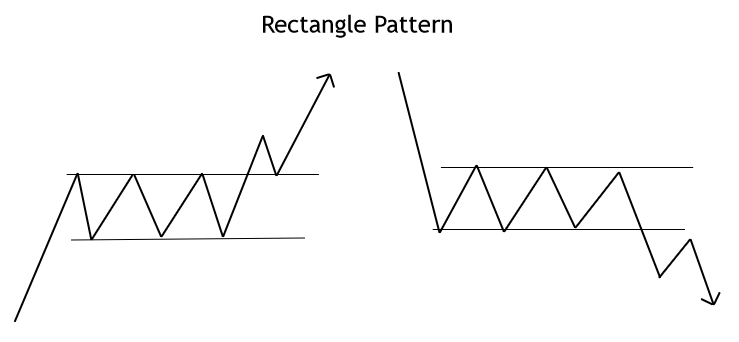
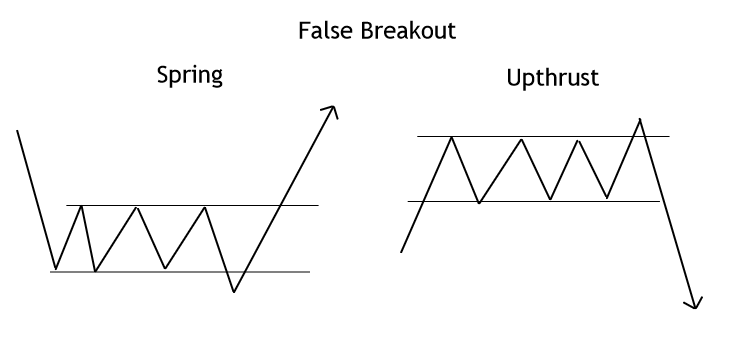
A buy-side signal will arise if the price breaks and closes above the resistance, in a bear market, a sell-side signal will trigger once the price breaks and closes below the support of the sideways formation. An initial profit target level will be the amplitude of the rectangle pattern. Investors should be alert for false breakouts and set propper stop-loss levels and breakout confirmation rules.
Broadening Formation
The broadening pattern is a complex formation difficult to trade due to its divergent guidelines expands across time as an expanding triangle. The following figure illustrates the broadening pattern.
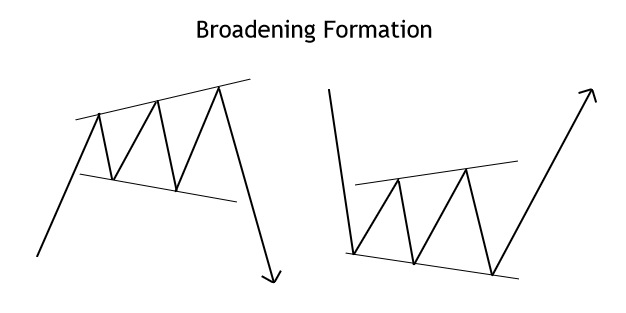
In a conservative market positioning, the investor should consider that this formation tends to appear at the end of a trend. On the other hand, investors should also wait for the completion of three peaks or valleys, and then the breakout and close above or below the previous high or low. Reward/risk ratios are a handicap in these formations, as the invalidation level tends to be far away from the entry levels.
Flag and Pennant Pattern
The flag pattern is a technical formation that goes against the prevailing trend that tends to retrace up to fifty percent of the previous movement. To trade this formation, the investor should wait for the flag structure to complete its three peaks or valleys depending on the last move.
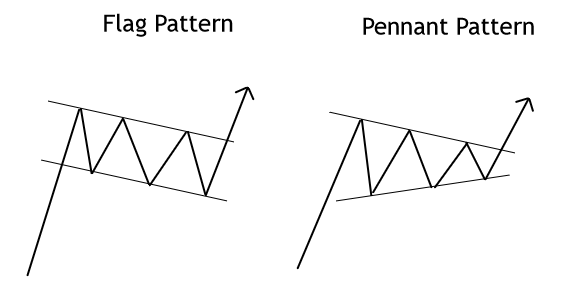
A buy-side position will trigger once the price breaks and closes above the descending dynamic resistance. The initial profit target will be the price range of the previous upward move. A sell-side position will show up when the price completes three peaks and breaks and closes below the lower line of the flag.
The pennant pattern looks similar to a symmetrical triangle, but the pennant takes less time than a symmetrical triangle. A bullish position will be valid if the price completes three valleys and then breaks and closes above the pennant’s upper guideline. Similarly, a bearish trade will emerge once the price breaks and closes below the lower trendline of the pennant formation.
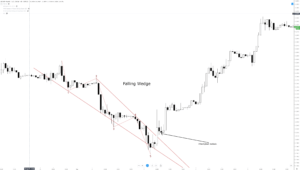
Wedge Pattern
The wedge pattern is a technical formation that looks like a symmetrical triangle moving with the primary trend, but whose outcome is mostly against it. In consequence, an ascending wedge is a bearish formation, and a descending wedge is bullish.
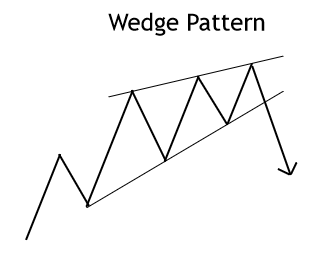
In a bullish wedge formation, the investor should wait for the three peaks to be completed before deciding a short position entry. The initial profit target will be defined by the range of the broadest side of the wedge (between the upper and lower guideline).
In a bear market, the entry setup requires that the technical formation completes three valleys before a buy-side order could be established.
Conclusions
In this educational article, we presented a set of chart patterns that could provide to the chart patterns’ investor a group of strategies to entry and exit setups from the market.
Trend-follower traders should remember that in financial markets, trends show up merely about 30%. In this context, continuation patterns provide opportunities to join the trend when it is already in progress.
In the following article, we’ll present a set of guidelines to use trendlines and trend channels to create a trading strategy.
Suggested Readings
- Fischer, R., Fischer J.; Candlesticks, Fibonacci, and Chart Patterns Trading Tools; John Wiley & Sons; 1st Edition (2003).