
Introduction
The fundamental question that any technical investor asks it is where a trend begins and ends? The final aspiration of the analyst is to identify the start of a new market direction as early as possible, enter the market, and make money with the trend.

A technical tool that could aid in the reversal trend identification process is the reversal chart patterns, which we will review in this educational article.
Three-Point Patterns
Three-point patterns are chart formations that can be broken into two categories, identified as reversal and continuation patterns. But, in this regard, the technical trader should consider that sometimes reversal chart formations may act as continuation patterns.
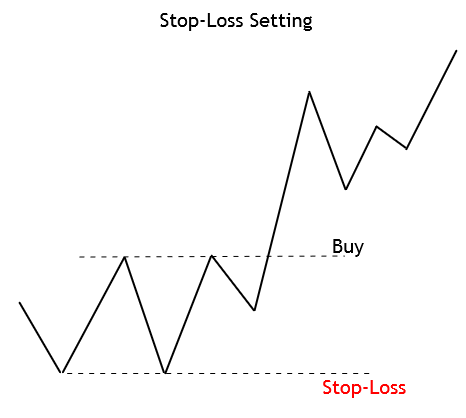
Stop-Loss Setting: In general terms, the stop-loss level should be located above (or below) of the nearest peak or valley of the entry-level of the chart formation.
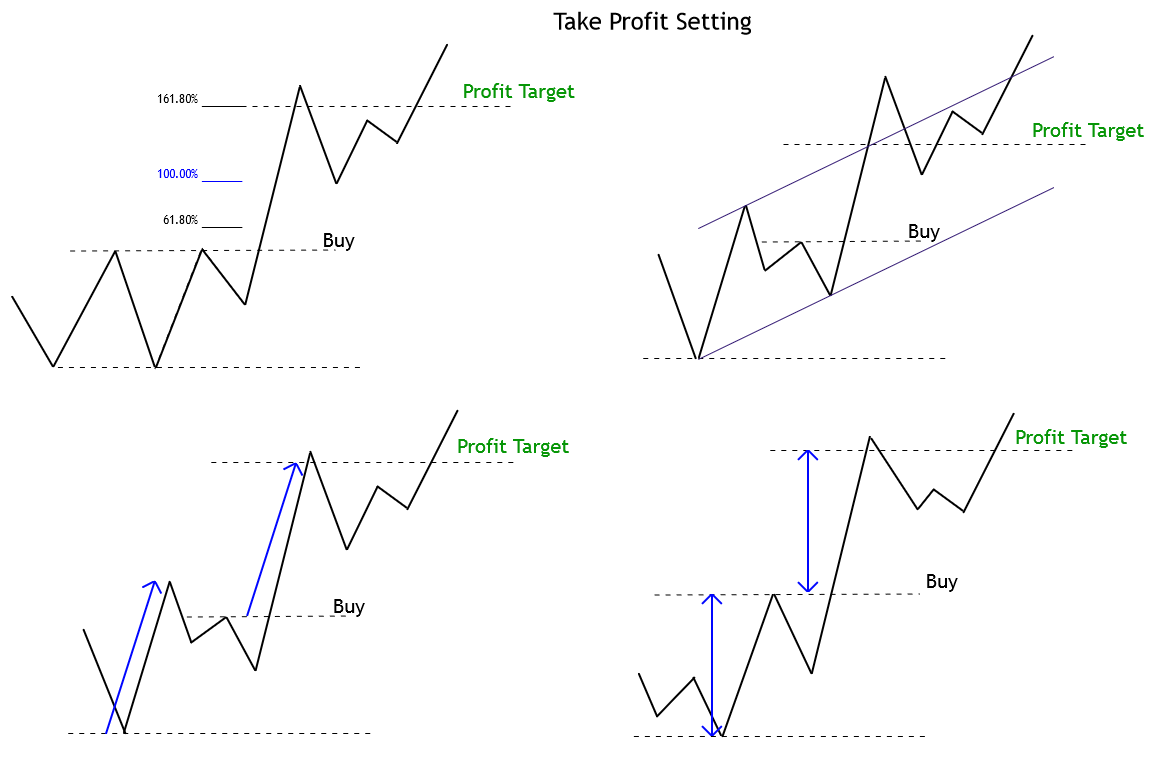
Take Profit Setting: There is a broad range of methods available to the technical trader to establish a profit target level. Some of the options to establish this level are:
- A Fibonacci ratio projection.
- Parallel trend lines defining a trend channel.
- An equivalent length to the previous impulsive wave.
- A range extent similar to the previous move.
Trailing Stop Use: A trailing stop is an added method to protect profits. The trail stop advances as the move progresses in favor of the trade, but the stop level holds during retracements. This method not always improve the results, although it is an excellent psychological anchor. The downside of using trailing stops, however, is that it could generate a premature closure of the trade, thus not allowing a trade to mature properly while the current trend is still progressing.
Classical Three-Point Patterns
In the technical analysis literature, there exists a wide variety of chart patterns. However, both Thomas Bulkowski, as Fischer and Fischer, agree on a reduced group of trend reversal patterns as the best indicators of a reversal. These are identified as follows.
Head and Shoulder Pattern: The H&S pattern is the most popular trend reversal pattern. H&S tends to appear regularly in the financial charts. However, in some cases, the H&S formation fails, and the market action continues developing with its previous trend. An ideal Head and Shoulder pattern should have the right shoulder at the same level as the right shoulder.
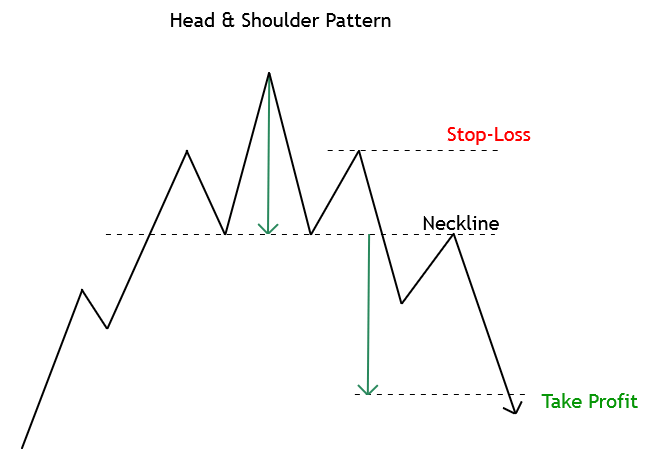
A market entry might be taken once the price action breaks and confirms the close below (or above) the neckline. The stop-loss should be placed above the second shoulder. The profit target level is assumed to be placed at an equivalent distance taken from the head to neckline, and projected from the breakout level.
Triple Top and Bottom: These formations rarely appear in financial markets. However, when they do, they tend to be profitable.
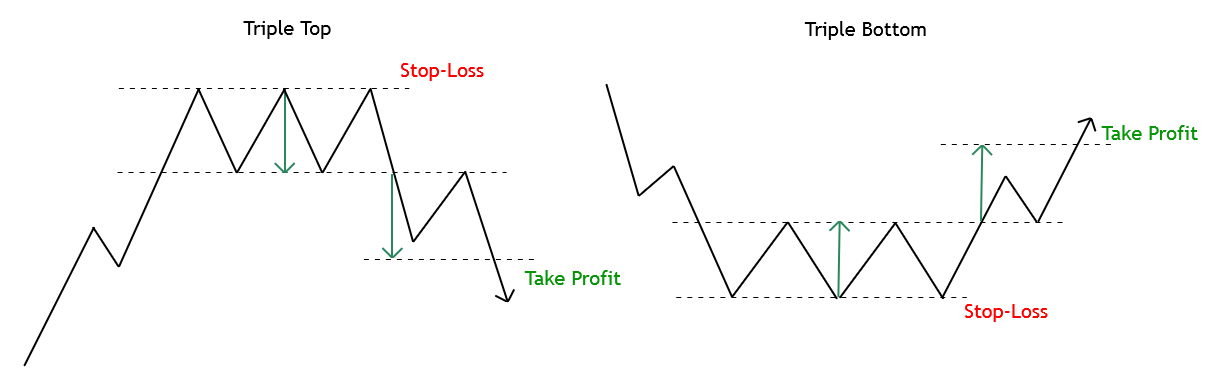
The entry signal is to be set once the price breaks and closes above (or below) the top (or the low) price range. The stop-loss level should be placed below (or above) the triple top (or bottom) range. As a profit target, it is recommended a range equivalent to the length of the high and low, projected from the breakout level.
Rectangle Pattern: In this formation, the price moves between two parallel trend-lines that progress horizontally. A trade signal will trigger after the price breaks and closes above (or below) the rectangle range.
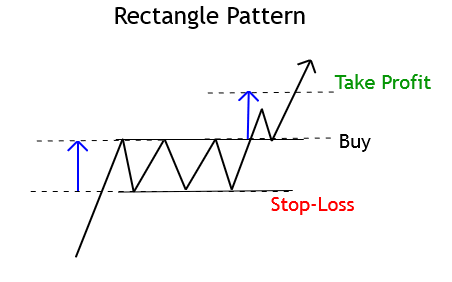
A conservative way to confirm the entry signal consists of waiting for the closeout of the rectangle formation range. The stop-loss and profit target levels hold the same arrangement as in a triple top and bottom pattern.
Key-Reversal Days: Although a Hammer Candlestick pattern offers poor performance, it tends to increase when the price action develops a hammer in a third peak or valley at the end of a fast market.
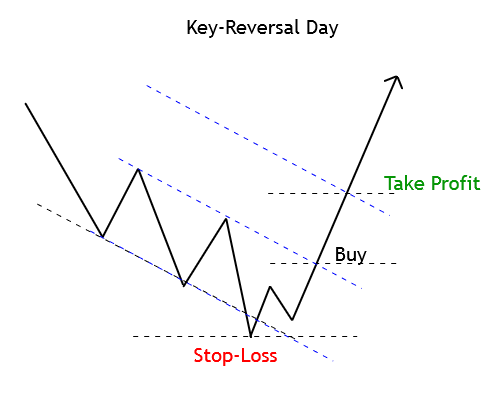
This pattern does not have any specific entry setup; however, Fischer and Fischer considers that for the pattern to be considered, the shadow’s length of the hammer should be at least three times its body.
The stop-loss should stay below (or above) the low of the key-reversal day. The profit target level may be set at the same distance as the previous trading range.
Three Ascending Valleys and Three Descending Peaks: These formations are usually the most reliable three-point patterns.
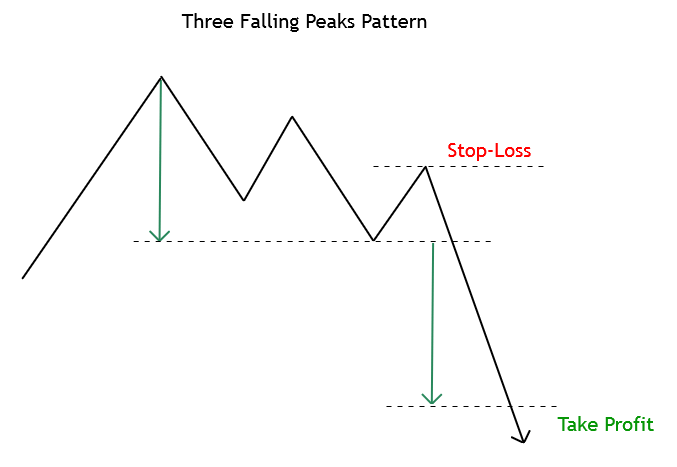
The essence of these formations, higher (or lower) highs and lows, indicate the continuation of the trend. Generally, a long position signal will trigger if the price rises above the highest peak and a short position when the price settles below the lowest valley.
The stop-loss should be located above (or below) the recent peak (or valley.) Finally, the profit-target level should be set at the equivalent distance of the previous range projected from the entry-level.
Triangles: Triangle patterns shows three basic variations, symmetric, descending, and ascending. The symmetric triangle could be both a reversal and a continuation formation; however, the ascending and descending triangles usually are continuation patterns.
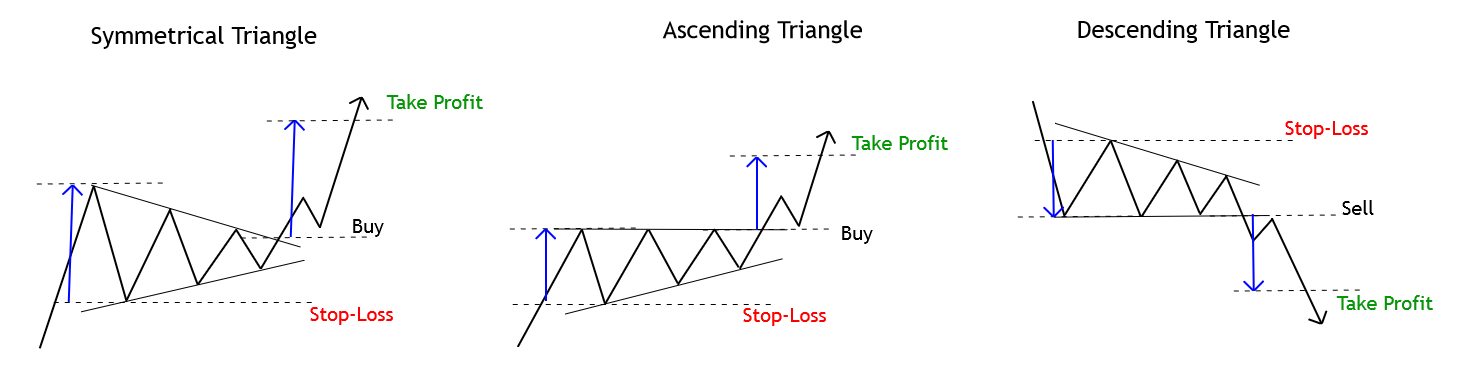
The entry signal happens when the price breaks the triangle base-line. A stop-loss order may be located above the triangle top. In the opposite case, the protective stop should be placed below the triangle.
As profit-target level, a range from the highest to the lowest level of the triangle can be projected from the breakout level.
Conclusions
The identification of the beginning of a new trend and how to make money from it has been the primary investor’s quest since Charles Dow’s era. Three-point patterns are useful tools not only to identify trend reversals but also to recognize continuation patterns.
In this context, Bulkowski’s work cited by Fischer and Fischer provides a useful statistical study, illustrating the failure rate of a broad range of chart formations. For example, the rectangle top pattern when the price breaks up has a 2% failure rate. On the other hand, the top key-reversal pattern has a 24% failure rate.
Lastly, Bulkowski’s ranking study could be a powerful tool for the technical trader, seeking ways to reduce the risk of his market entries. In this regard, identifying the patterns and their execution requires practice and confidence when placing the order on a breakout.
Suggested Readings
- Fischer, R., Fischer J.; Candlesticks, Fibonacci, and Chart Patterns Trading Tools; John Wiley & Sons; 1st Edition (2003).
- Bulkowski, T.; Encyclopedia of Chart Patterns; John Wiley & Sons; 2nd Edition (2005).