
In today’s lesson, we will demonstrate an example of a chart that makes a breakout at the weekly low, consolidates, and produces an excellent bearish engulfing candle. It looks like a good short entry for the sellers. However, things do not go as the sellers would love to see. We try to find out what may be the reason behind it.

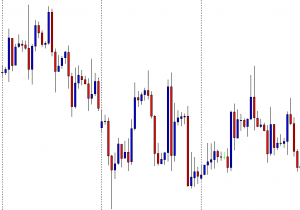
It is the H4 chart. The chart shows that the price action has been choppy for the last three weeks. The price has been roaming around within two horizontal levels. Ideally, the price action traders would love to skip eying on such a chart to trade at. Let us proceed and see the H4 chart of the last week.
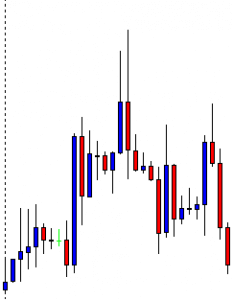
The chart shows that the price makes a bullish move to start its trading week. Then, it makes a bearish move and closes around the level where it started its week. It seems that the minor time frame sellers are driving the price down.
The chart produces a bullish engulfing candle right at the last week’s swing low. The minor time frame traders may push the price towards the North. The H4 sellers, on the other hand, may wait for the price to make a breakout at the swing low to go short on the chart. This is what the breakout traders usually do. However, the question is whether they should do it on this chart or not? We find it out in a minute.
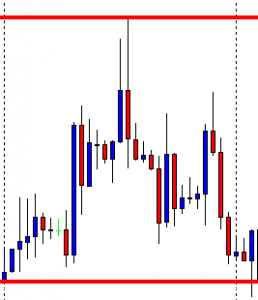
It seems that the Bear is about to make a breakout at the last week’s low. The last candle comes out as a bearish engulfing candle closing right at the level of support.
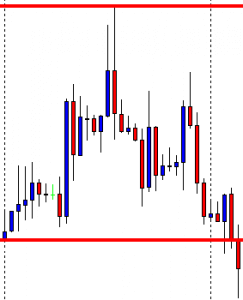
The price makes a breakout at the weekly low. The last candle comes out as a bearish candle closing well below the level of support. The breakout traders are to wait for the price to consolidate.
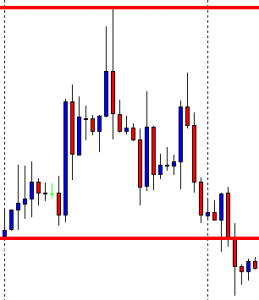
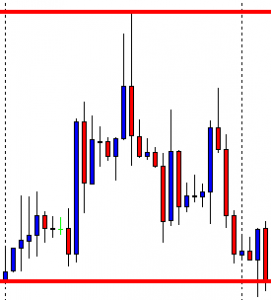
The price consolidates. The last candle comes out as a bearish inside bar. If the price makes a breakout at the last swing low, the breakout traders usually trigger a short entry. Let us proceed and see what the price does.
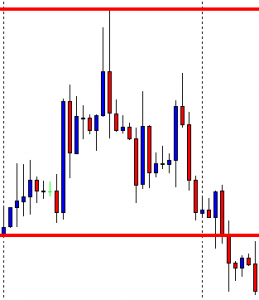
The chart produces a bearish engulfing candle. It is an A+ signal candle as far as the breakout trading strategy is concerned. The sellers may want to trigger a short entry right after the last candle closes.
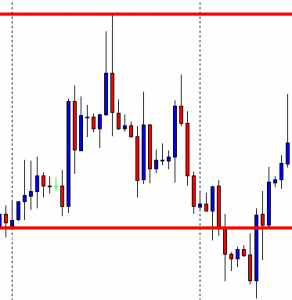
The chart produces a bullish engulfing candle and heads towards the North instead. The Forex market is unpredictable. The price could go either way anytime. However, it looks strange after the chart producing such a nice signal candle. There is nothing wrong with the entry apart from the fact that the chart has been choppy for the last three weeks. It means either the pair is waiting for a high impact news event to find its new direction or traded based on a bigger time frame. In a word, the price action traders may skip eying on such a chart to trade at. For them, choosing the right chart plays a vital role. Today’s example proves it again.