In today’s lesson, we are going to demonstrate an example of the daily-H4 chart combination trading. In the daily-H4 chart combination trading, the daily chart plays a very significant role. As long as the price in the daily chart heads towards the trend, the traders may find the opportunities to take entry. Let us now proceed and find out what that means.
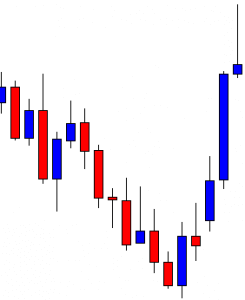
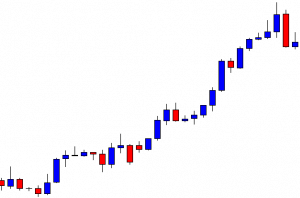
It is a daily chart. The chart shows that the price heads towards the North with good bullish momentum. The last candle comes out as an inverted hammer with a tiny bullish body. The long upper shadow suggests that the price has a strong rejection at a level of resistance. Nevertheless, the candle has a bullish body, and the candle closes above its last candle’s highest high. Thus, the daily-H4 combination traders may flip over to the H4 chart to go long in the pair.
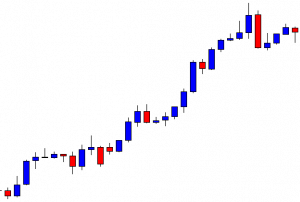
This is how the H4 chart looks. It produces a bearish engulfing candle followed by a spinning top. It seems that the price may have found its support. If the price makes a breakout at the last swing high, the buyers may go long in the pair.
The chart produces two more bullish candles. The last candle comes out as a hammer with a bearish body. It seems that the price does not know where to go. Traders must be patient here.
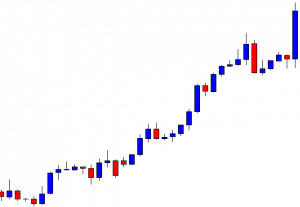
The chart produces a bullish engulfing candle closing well above the last swing high. The buyers may trigger a long entry right after the last candle closes. It seems that the bull may make another strong move towards the North. Let us find out how the trade goes.
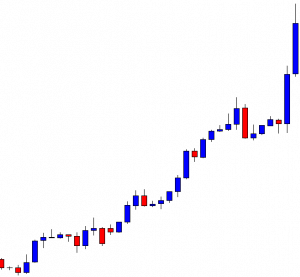
As expected, the price heads towards the trend with extreme bullish pressure. It hits 1R by the next candle. The candle closes with a thick bullish body. It means that the buyers still have control in the chart. Thus, the buyers may wait for the price to consolidate and get a bullish reversal candle followed by a bullish breakout to go long and drive the price towards the North further.
If we concentrate on the daily chart, we see that the last daily candle is not a strong bullish candle. However, consolidation and a bullish engulfing candle in the H4 chart attract the buyers to go long in the pair. As long as the daily candle closes above/below the last candles highest high/lowest low, the daily-H4 chart combination traders shall keep their eyes in the H4 chart for finding trading opportunities.