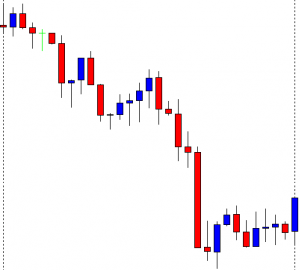
In today’s lesson, we are going to demonstrate an example of an H4 breakout at the weekly low. The price consolidates after the breakout and produces a bearish reversal candle right at the breakout level. It is a matter of time for the sellers to go short and drives the price towards the South. Let us find out what actually happens.
The chart shows that the price makes a good bearish move. It finds its support where the pair is traded for a while. The pair closes its week by producing a bearish candle. By looking at the chart, it looks that the sellers are going to keep their eyes on the chart next week.
The pair produces a bullish engulfing candle to start its trading week. The buyers on the minor charts may push the price towards the North. However, the H4 chart is still bearish biased.
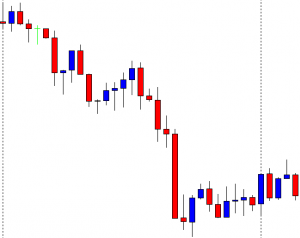
The chart shows that the price may have found its resistance. The price has been in consolidation for a while. The last candle comes out as a bearish engulfing candle. The price may make its move towards the South now.
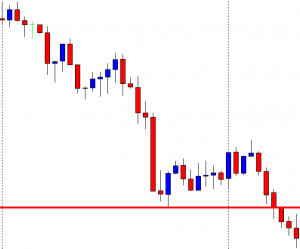
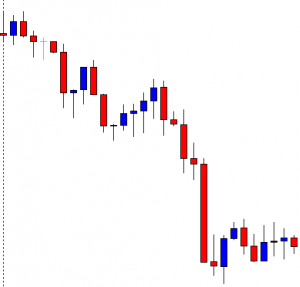
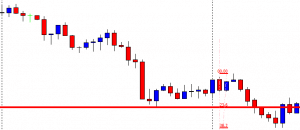
The chart produces consecutive bearish candles and makes a breakout at the last week’s low. The pair is traded below the breakout level for two more candles as well. The sellers are to wait for the price to consolidate and produce a bearish reversal candle followed by a breakout at the consolidation support to go short in the pair.
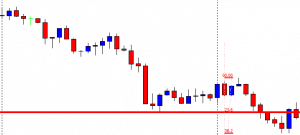
The chart produces a bullish engulfing candle closing within the breakout level. The next candle comes out as a bearish inside bar. The sellers would love to get a bearish engulfing candle closing below the bullish candle’s low. However, a breakout at the consolidation support would signal the sellers to go short in the pair. By drawing Fibonacci levels on the chart with Fibonacci extension, we see that the price finds its support at the level of 38.2% and finds its resistance at the level of 23.6%. In a word, the stage is getting ready for the Bear to make a move.
The chart produces a bullish candle. It is not a good sign, but the sellers still have hope. If the chart produces a bearish reversal candle again followed by a breakout at the level of 38.2%, the game is on for the sellers.
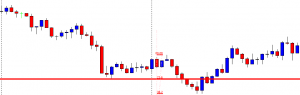
Now, the chart produces another bullish candle and heads towards the North. The sellers must be very disappointed since it seemed such a nice trade setup for them. The reality is it often happens to all traders. No point in being disappointed, but it must be dealt with professionalism.