The most common term people associate with retracements in price that retest prior areas of support or resistance is a pullback. There is another term that goes with pullback, and that is a throwback. Let’s review the differences between these two definitions.

Pullback
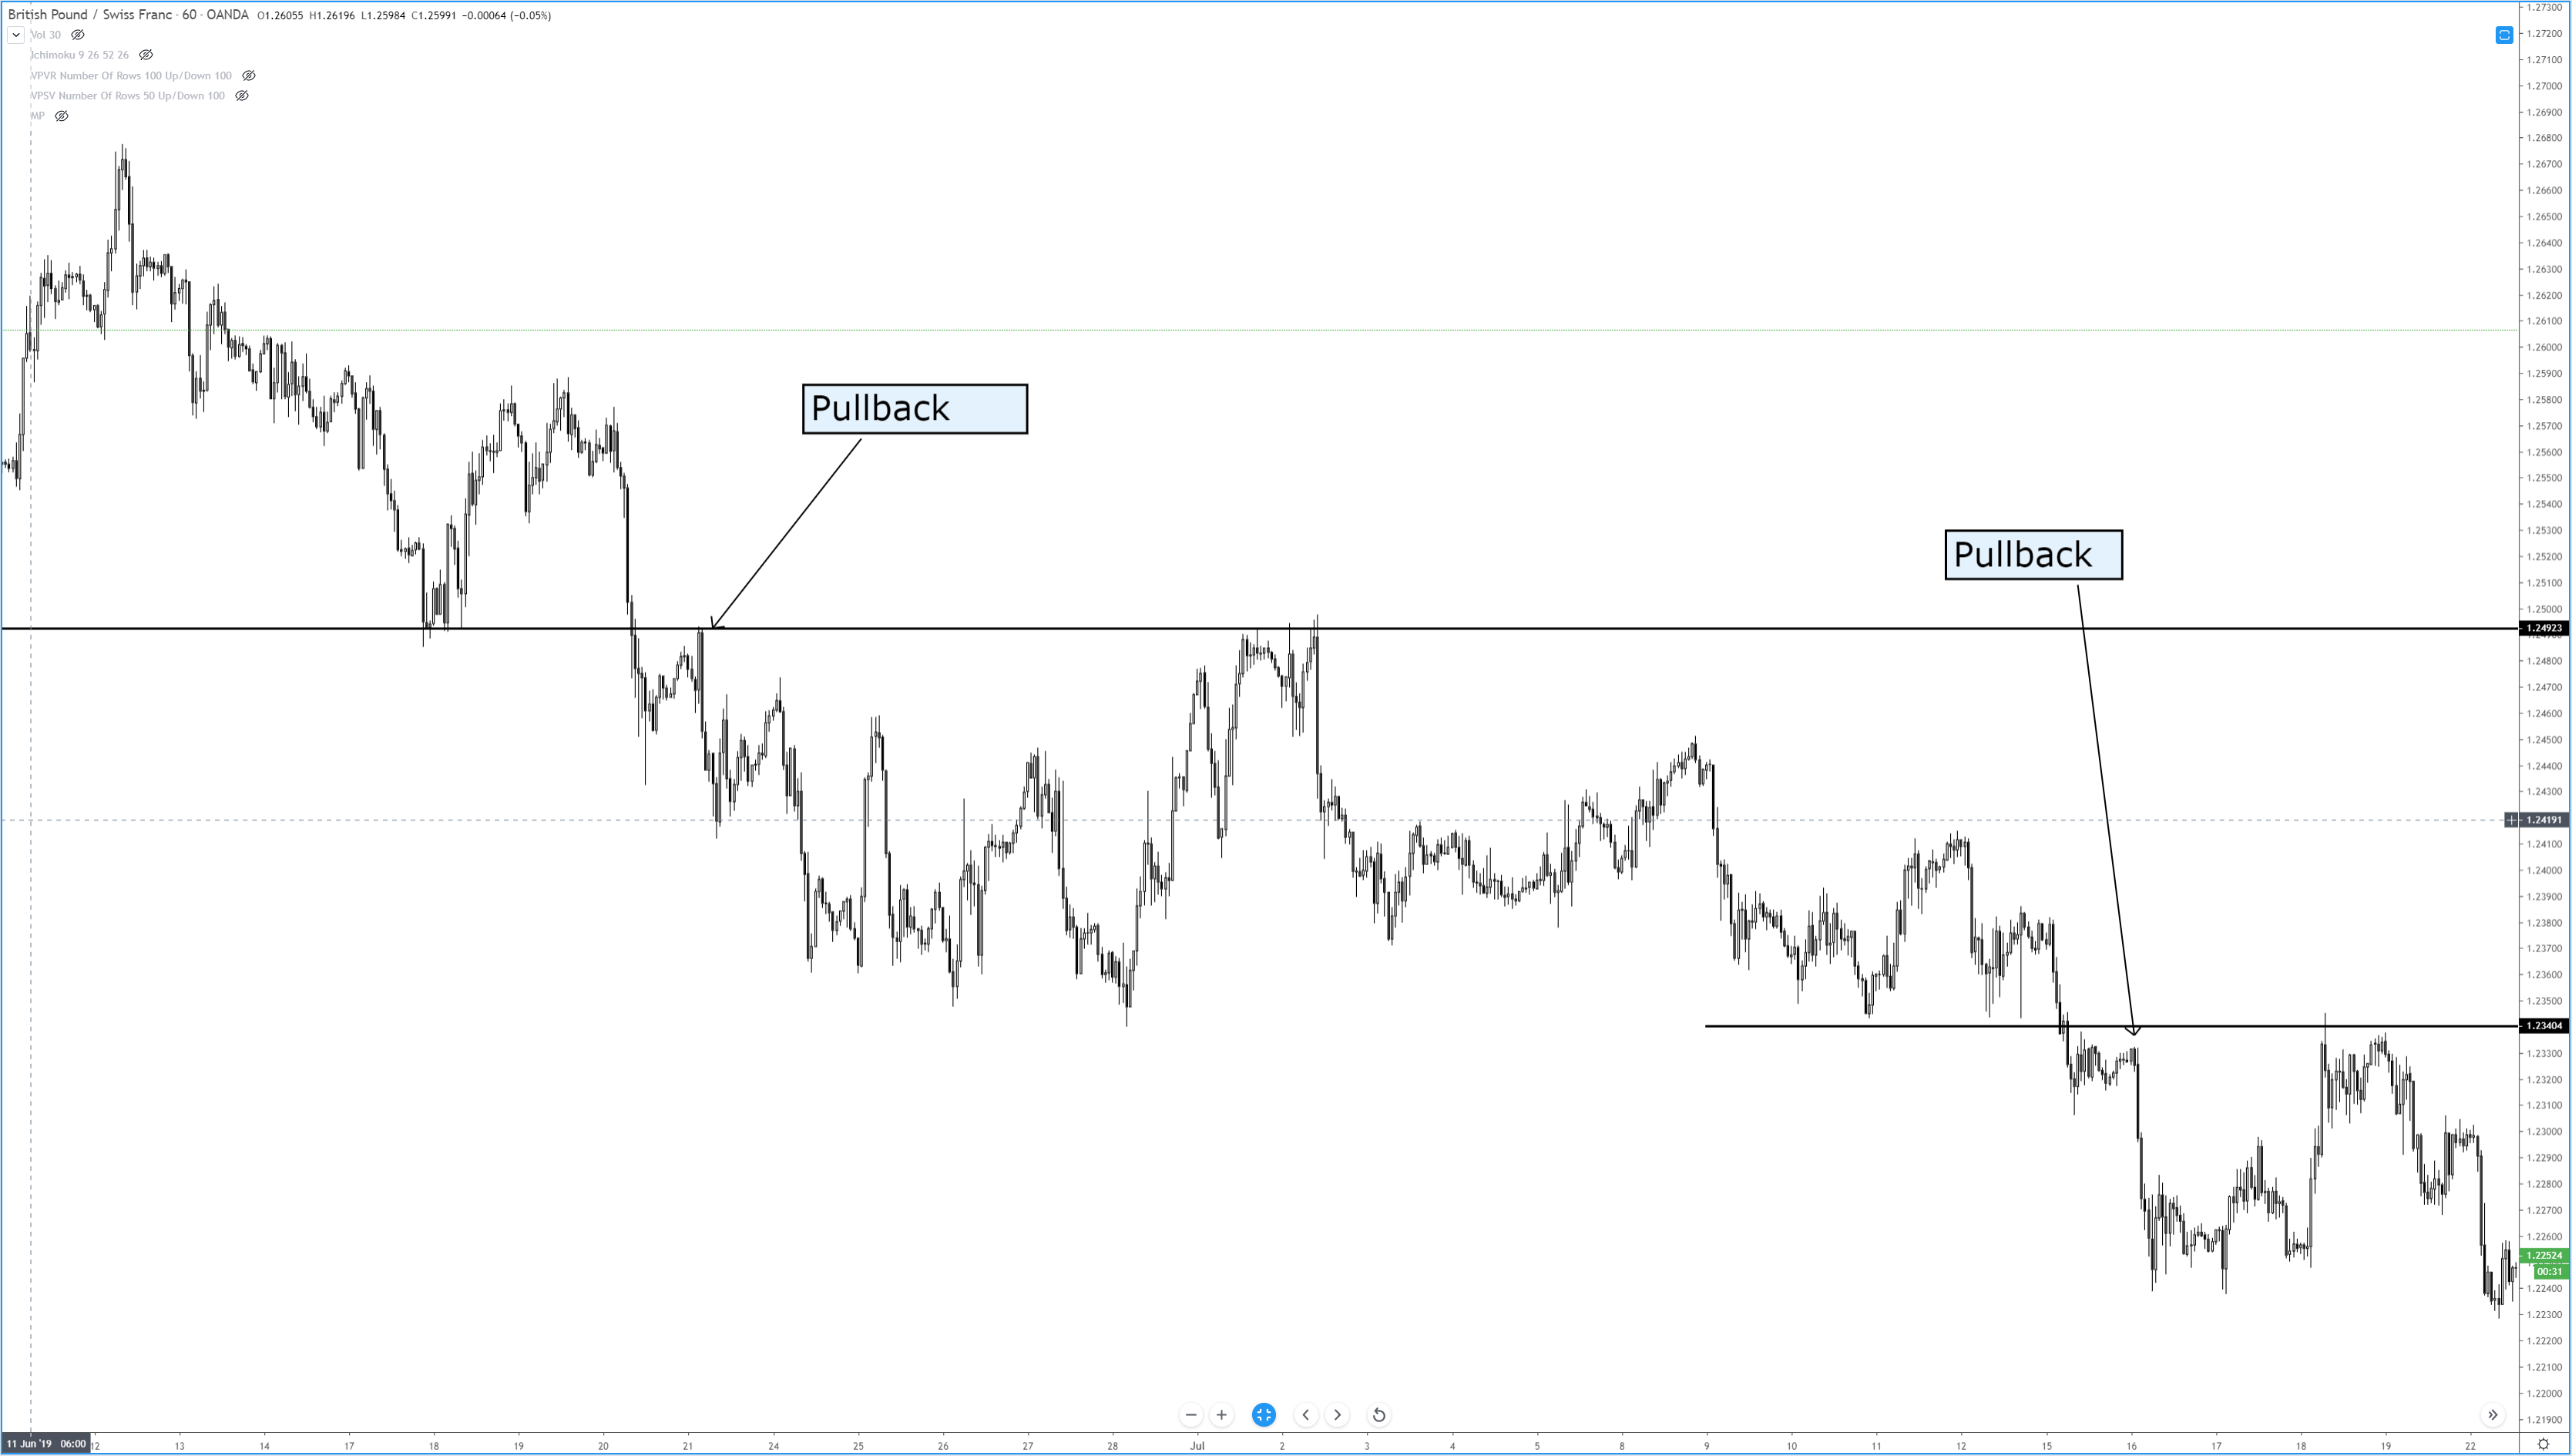
Pullbacks occur after the price has moved lower. Think of any pattern or support line that has price breaking out to the downside. When price pulls back up to the price level of the initial break, that is known as a pullback. Pullbacks occur during breakouts lower.
Throwback
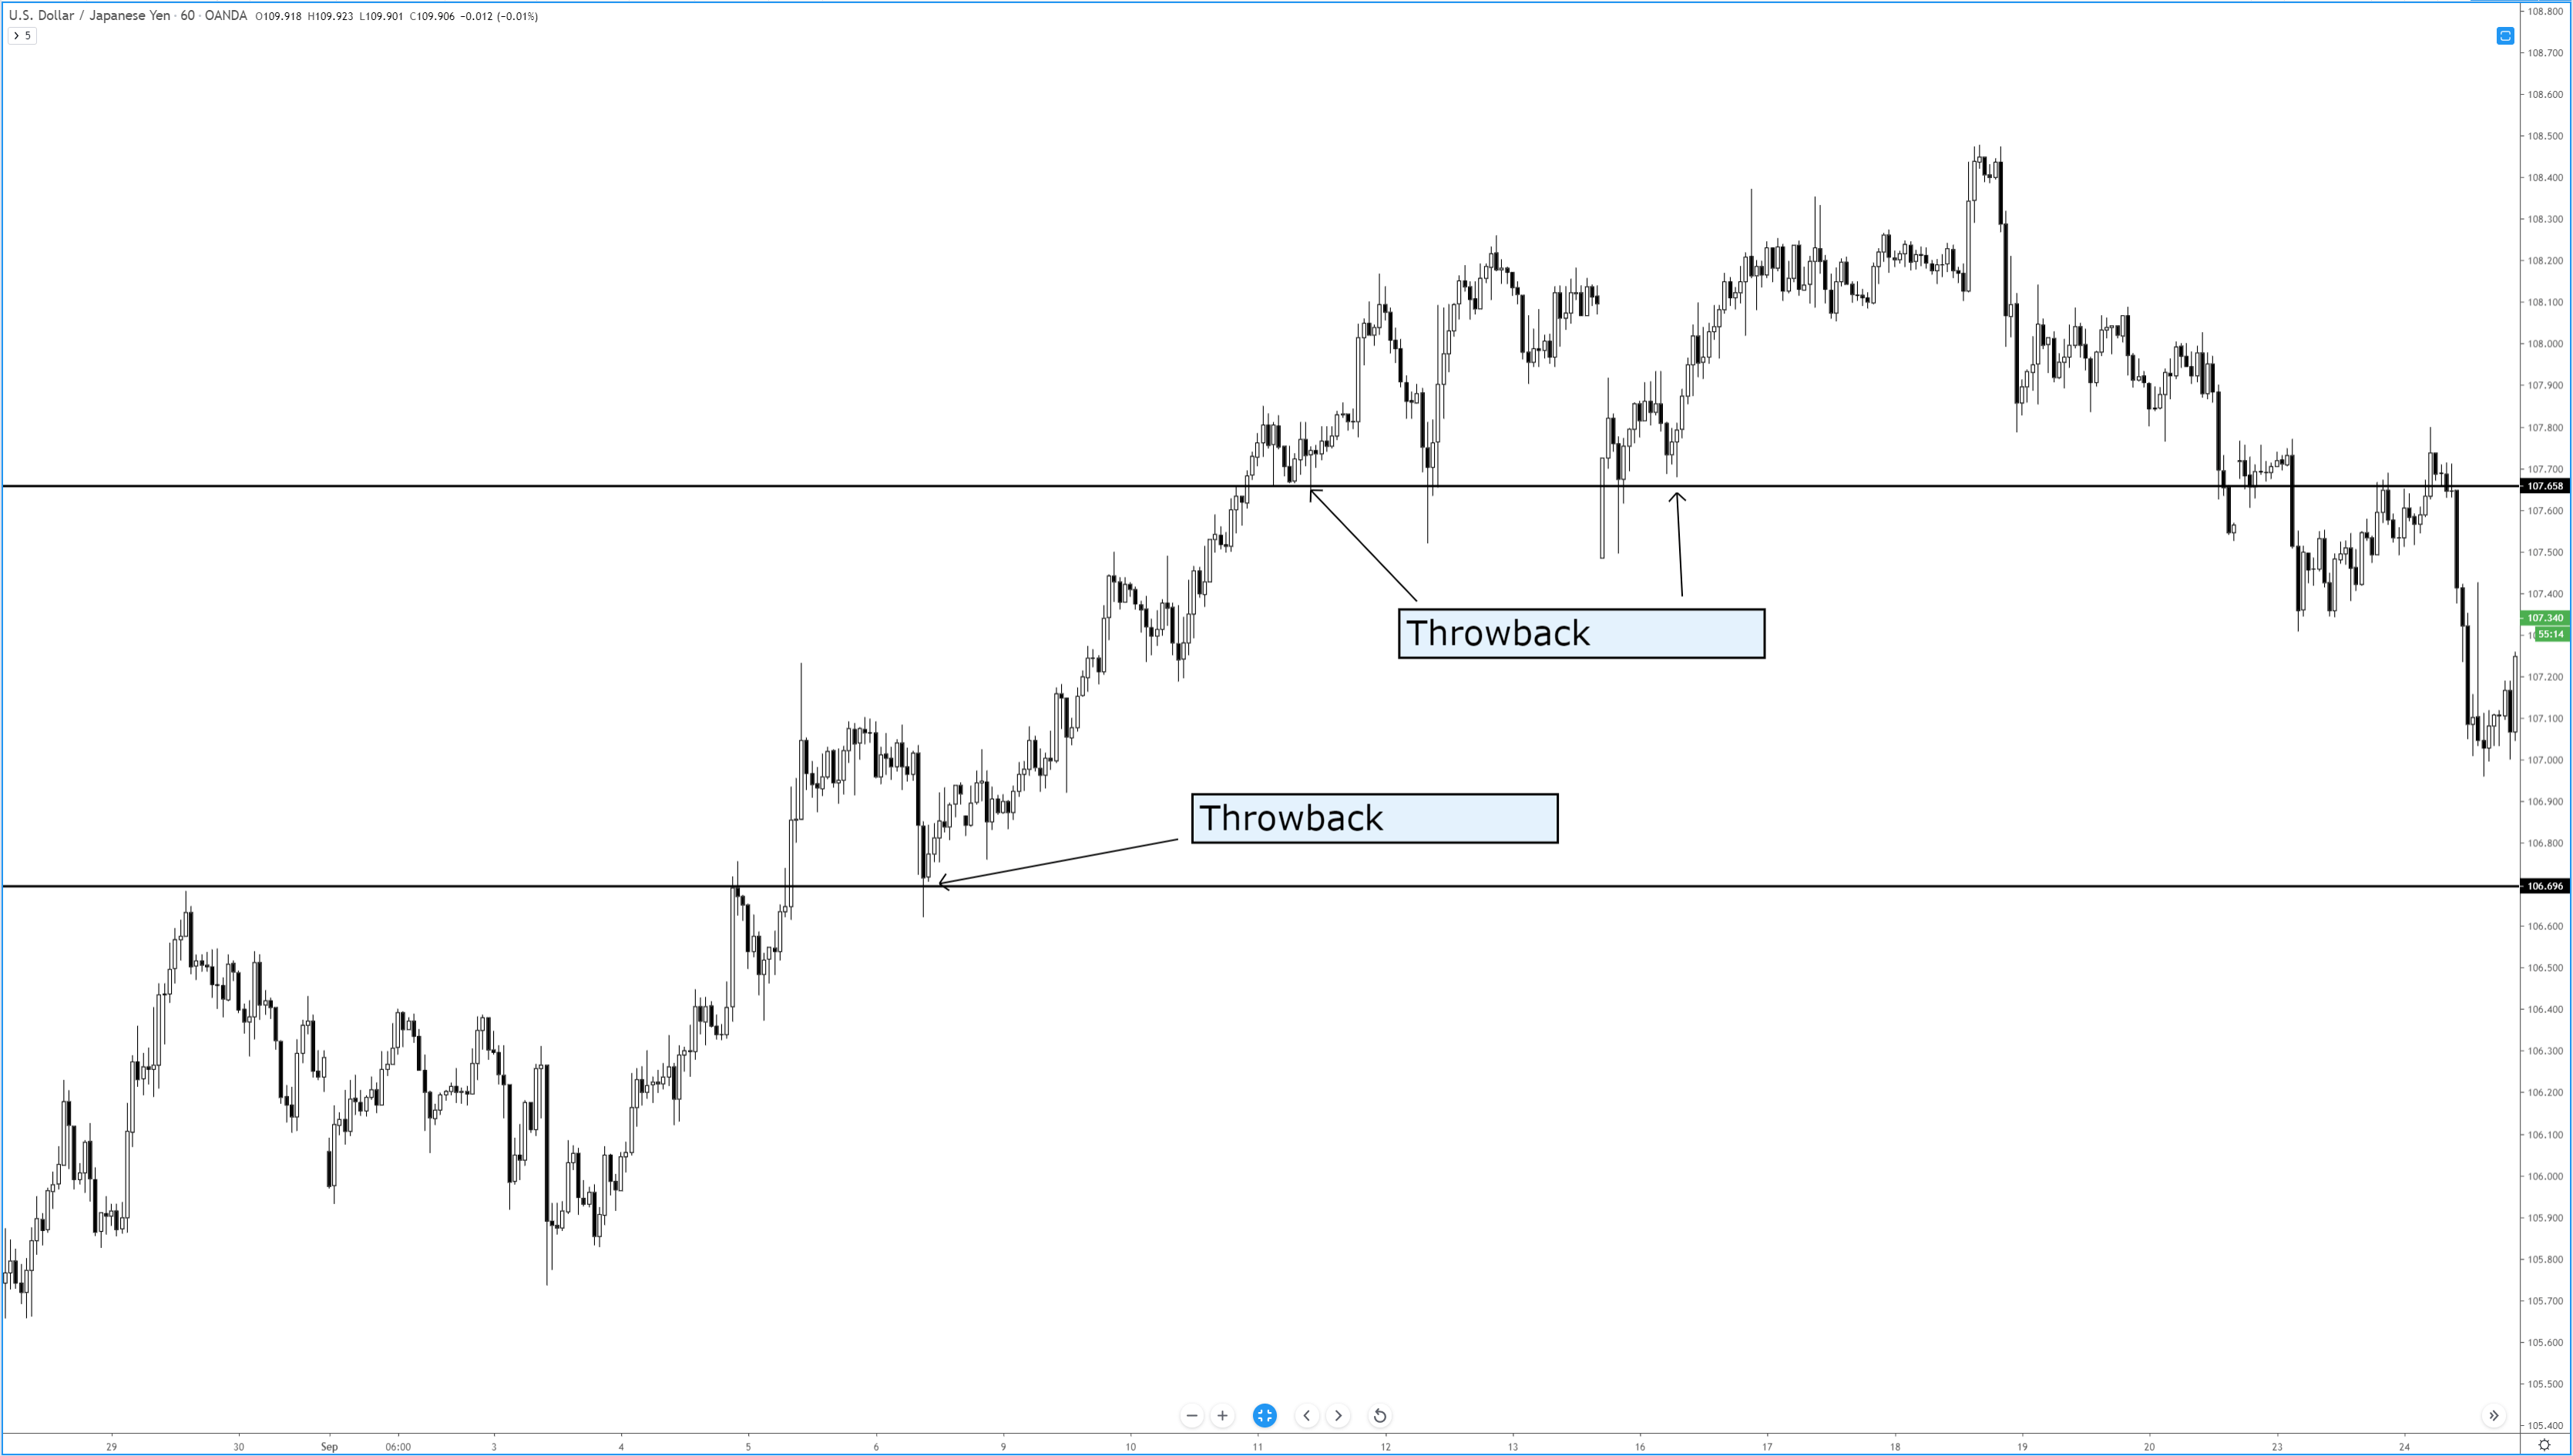
Throwbacks occur after the price has moved higher. Think of any pattern or level of resistance that has price breaking out to the upside. When the price is thrown back down to the first level of the break, that is known as a throwback. Throwbacks occur during breakouts higher.
While there are different definitions for retests of breakout zones, know that people will often call throwbacks, pullbacks. In practice, the description itself does not matter as much as you see the behavior that price exhibits after breaking out of support or resistance. The table below identifies the average occurrence rate for a pullback or throwback from the following patterns.
|
Pattern |
Pullback Rate (%) |
Throwback Rate (%) |
|
56 |
60 |
|
| Descending Triangle |
55 |
50 |
| —- |
56 |
|
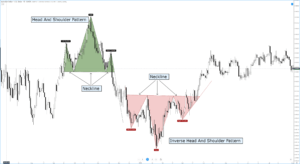
| Inverse Head-And-Shoulder |
—- |
57 |
| Head-And-Shoulder |
59 |
—- |
| Symmetrical Triangle |
58 |
58 |
| Triple Bottom |
—- |
58 |
| 63 |
— |
The table above comes from Thomas Bulkowski’s book, ‘Visual Guide to Chart Patterns.’ His book is part of the Bloomberg Financial Series. Bulkowski is, by far, the authority on the frequency of patterns experiencing pullback and throwbacks. His work focuses extensively on chart patterns. However, there is one problem, and it has nothing to do with his phenomenal work. This is a problem for anyone who focuses primarily on the Forex markets. Why? Because Bulkowski’s work and the broader technical analysis writer/education community focuses primarily on equity markets. This is a big deal because equity markets spend the vast majority of their time in one direction: up. This is especially true over the past decade. Again, this is not a dig towards the truly phenomenal authors and analysts who spend years creating their written work – it’s just a reality of the world we are in. It’s important to understand that the Forex markets, as we know them, are still a relatively new market – especially when compared to the stock market.
If you read Bulkowski’s work or any other work studying the frequency of throwbacks and pullbacks from patterns and support/resistance – I would recommend attributing the same rate of throwbacks to pullbacks in the forex market.
Sources:
Bulkowski, T. N. (2013). Visual guide to chart patterns. New York, NY: Bloomberg Press.
Bulkowski, T. N. (2008). Encyclopedia of candlestick charts. Hoboken, NJ: J. Wiley & Sons.
Bulkowski, T. N. (2002). Trading classic chart patterns. New York: Wiley.