Chart Patterns – Broadening Pattern & The Diamond Pattern
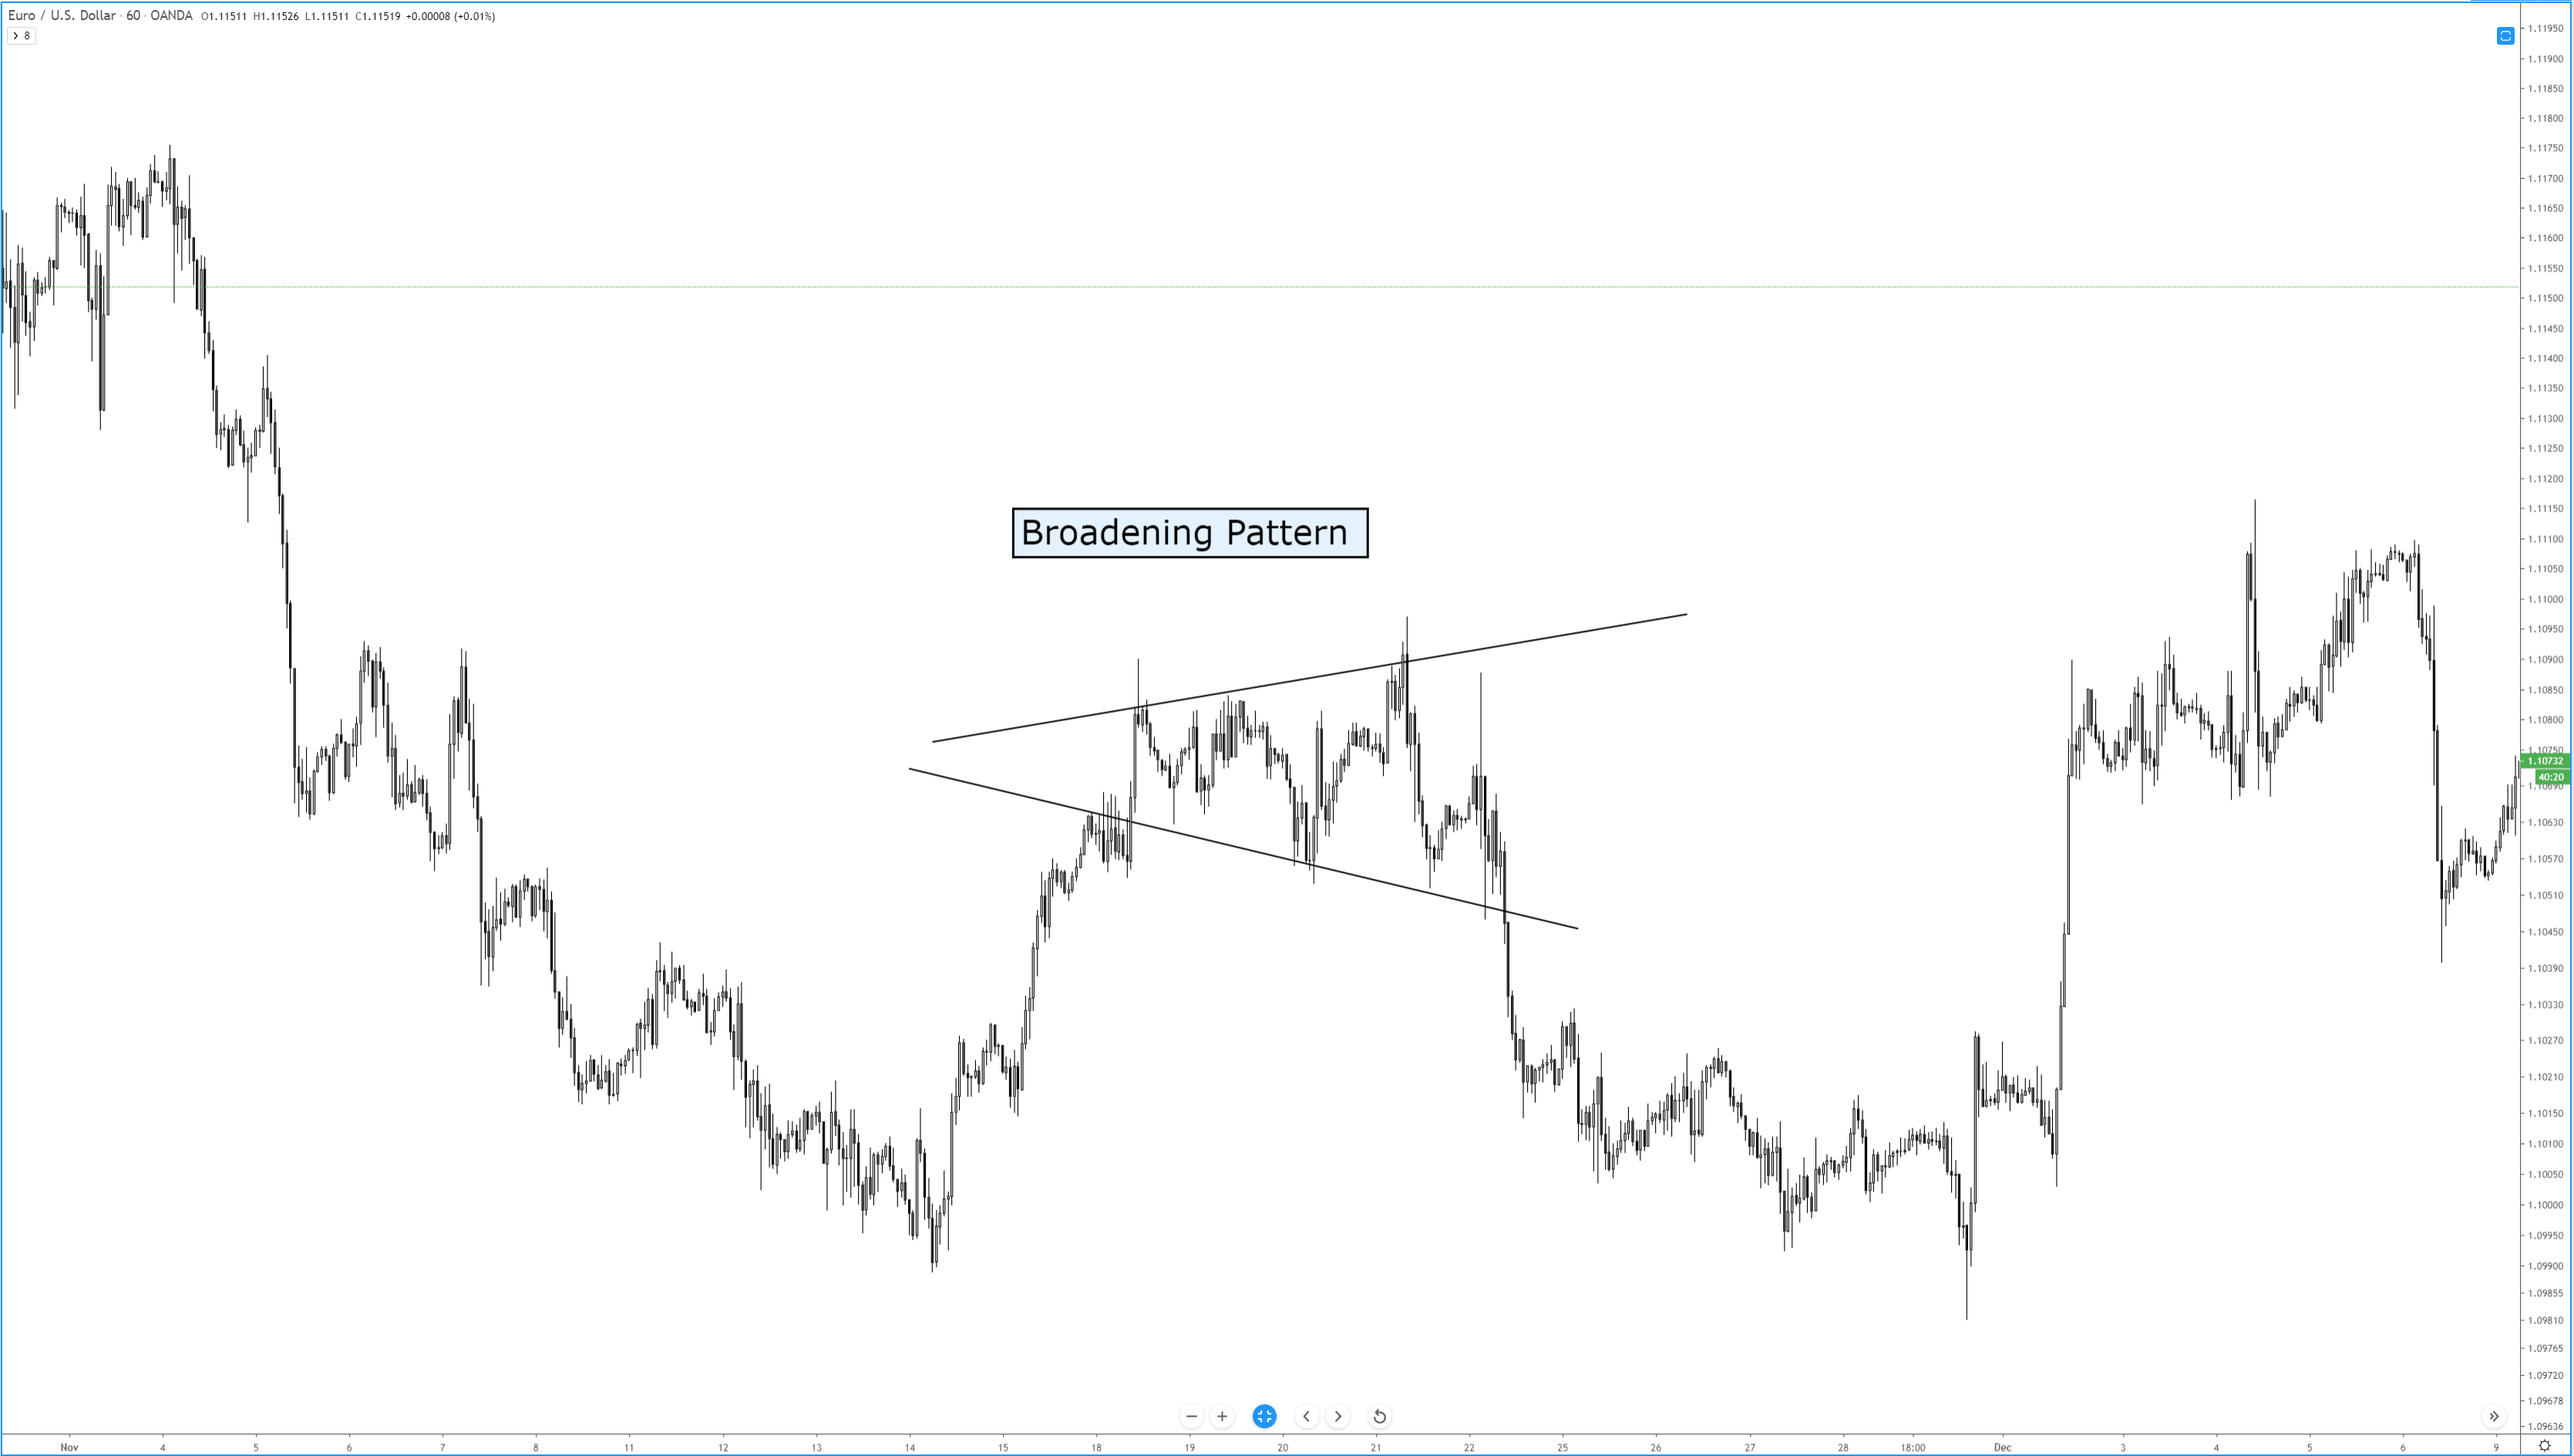
This pattern is also called a funnel or a megaphone pattern. It’s an inverse symmetrical triangle. This pattern is definitely not that common, and it’s a tricky pattern to trade. The behavior of price in a broadening pattern is to increase swing ranges where new higher highs and new lower lows are made. In my opinion, it is best to ignore this pattern. The breakout and retest of the upper or lower trendlines are the prevailing trade strategies utilized for this pattern. Of all the patterns, to trade, this is one of the least profitable. However, I’ve learned that the breakouts are often false, due to the nature of the final swing in the pattern being mostly overbought or oversold. It is not uncommon to see megaphone patterns turn into a triangle pattern – which results in a rare but profitable pattern known as a Diamond.
Chart Patterns – Diamond Pattern
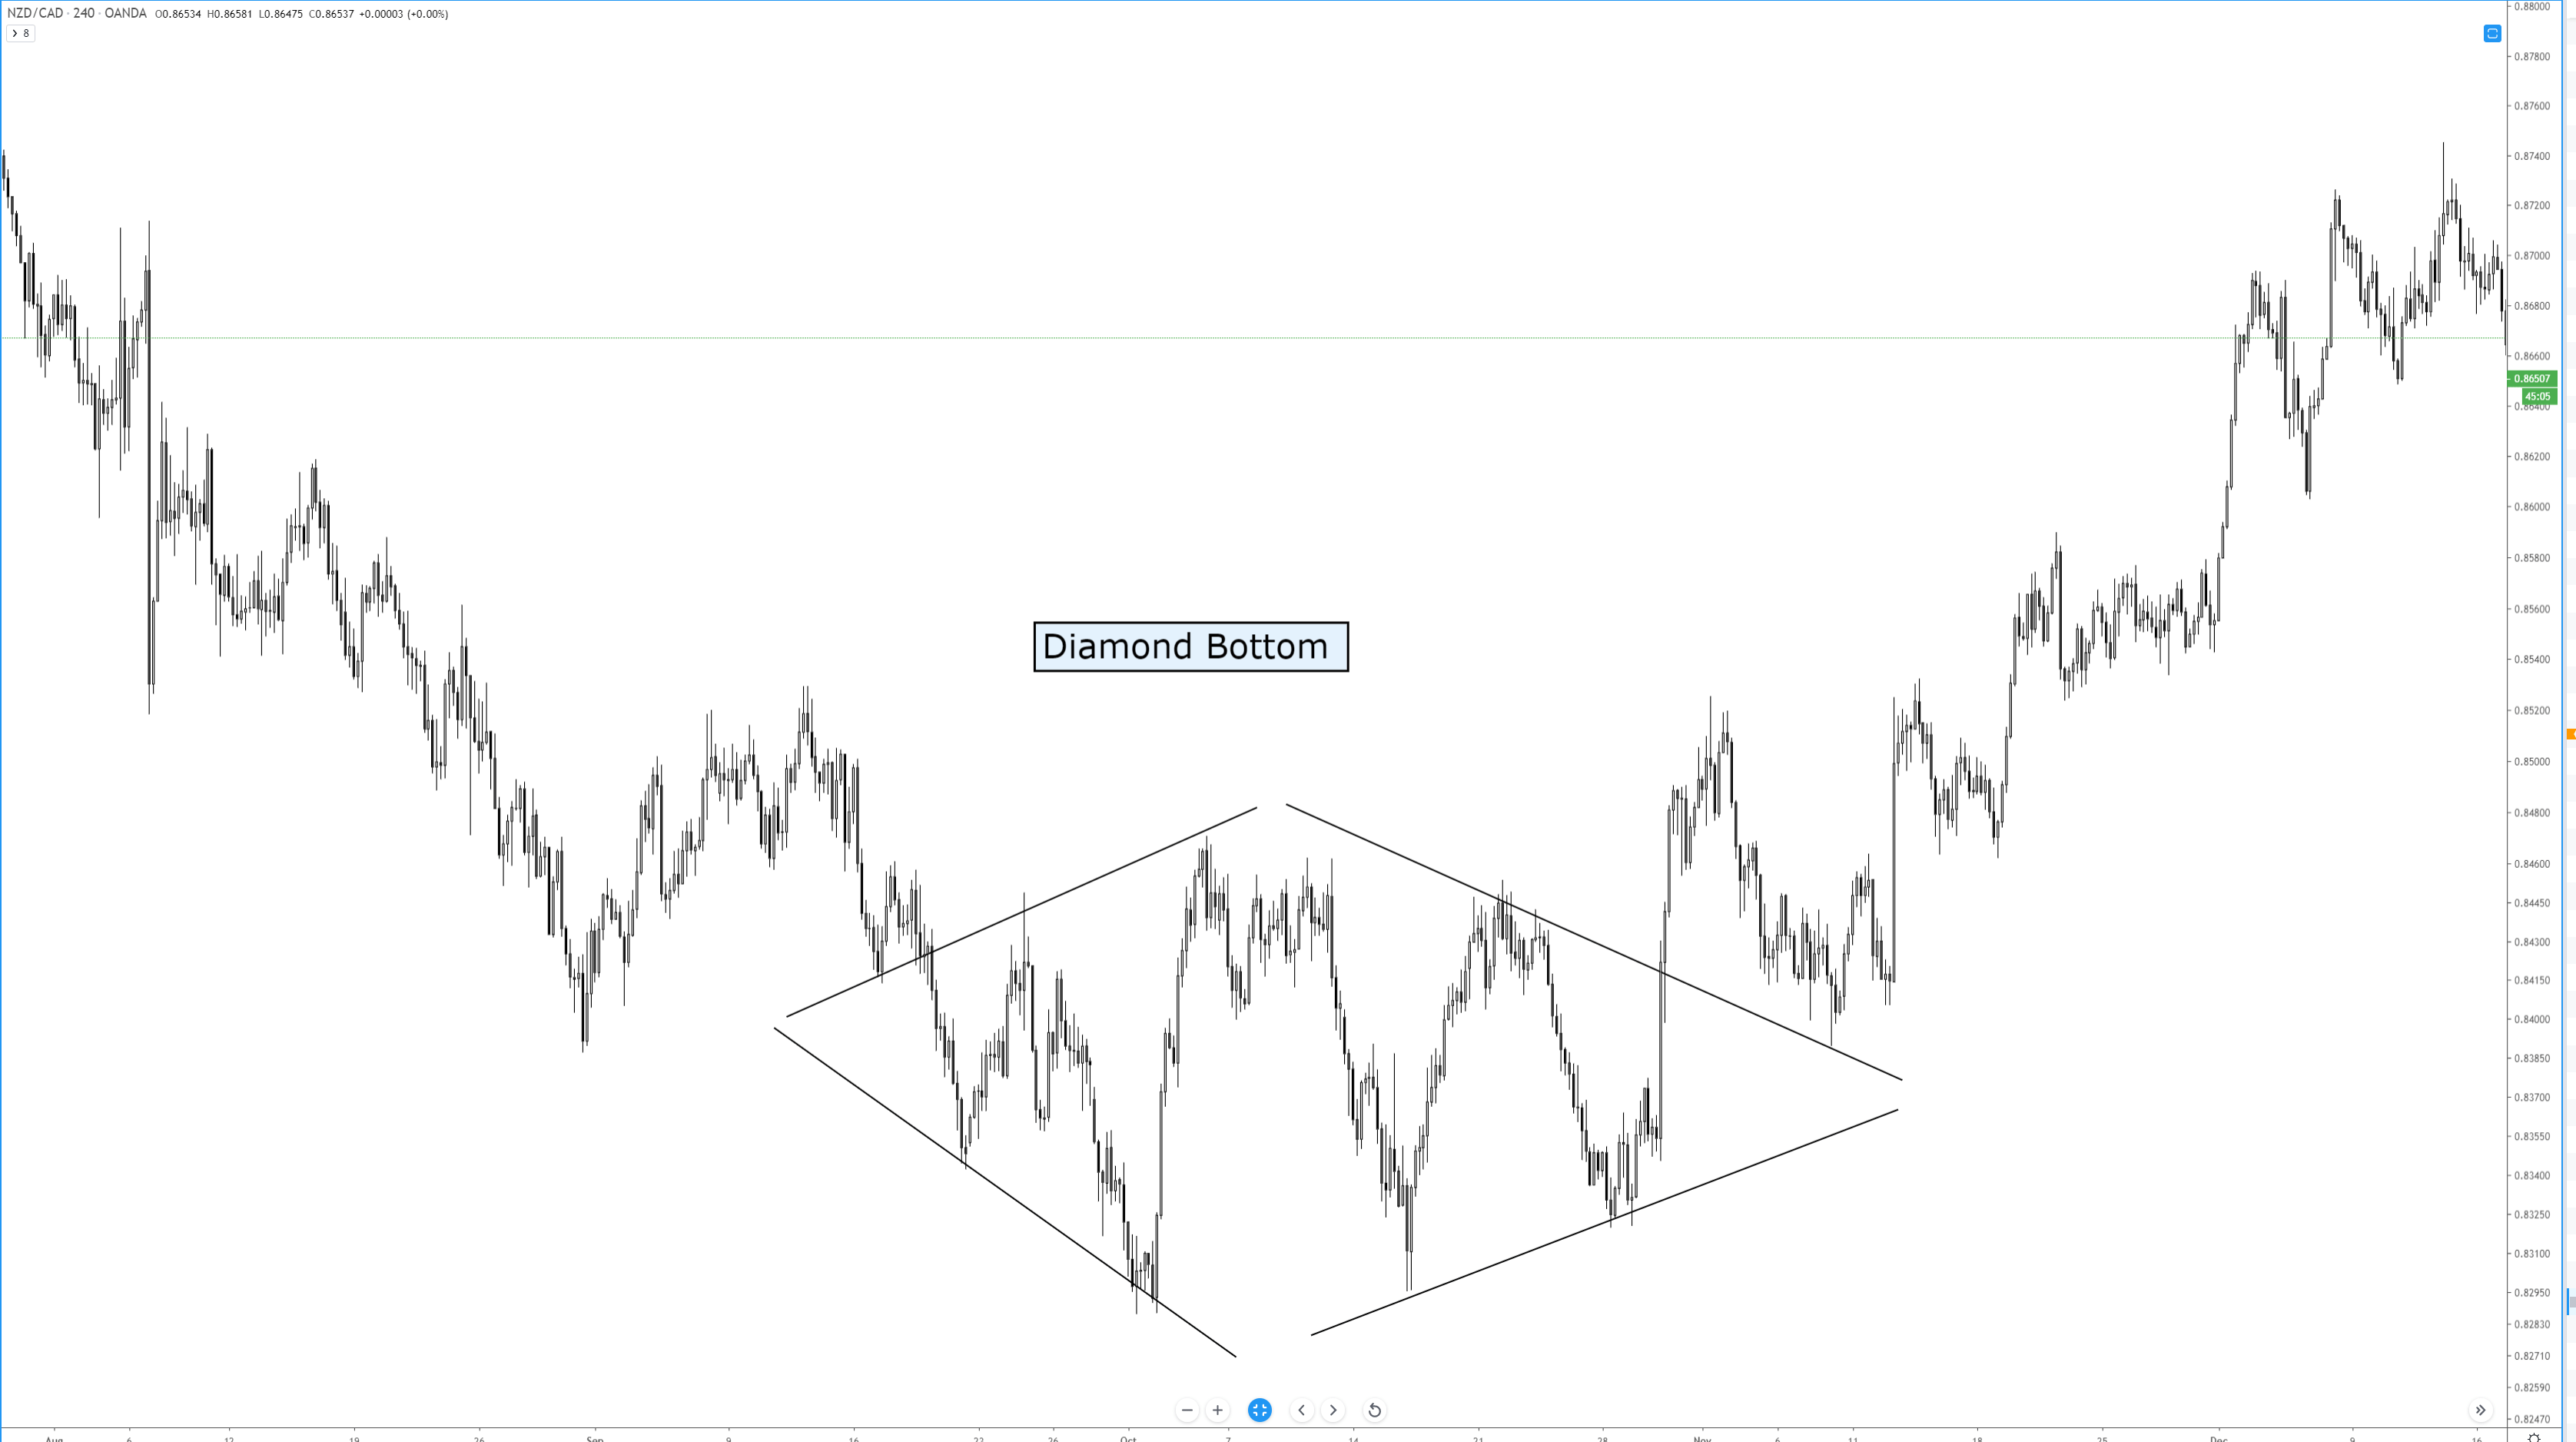
The diamond pattern is rare. It is also difficult to even notice if it exists. In fact, Thomas Bulkowsi writes on his site, ‘Let me clear about this. I don’t like diamonds. They are as tough to spot as nightcrawlers in the grass on a summer night.’ I believe that is a pretty accurate description. But, while diamond patterns are challenging to spot, they are a very powerful pattern that often results in fast and violent moves in the opposite direction – higher for diamond bottoms and lower for diamond tops. It is ok for the patterns to have one side that seems more slanted than the other and, in fact, they often do not appear as symmetrical as the example above. We trade a diamond pattern the same way we would any other triangle pattern.
Sources:
Kirkpatrick, C. D., & Dahlquist, J. R. (2016). Technical analysis: the complete resource for financial market technicians. Upper Saddle River: Financial Times/Prentice Hall.
Bulkowski, T. N. (2013). Visual guide to chart patterns. New York, NY: Bloomberg Press.
Bulkowski, T. N. (2008). Encyclopedia of candlestick charts. Hoboken, NJ: J. Wiley & Sons.
Bulkowski, T. N. (2002). Trading classic chart patterns. New York: Wiley.