Introduction
A Wedge is a technical chart pattern marked by converging trend lines on the price chart. The trend lines on the price chart are drawn to connect the highs and lows of price action over a specific period of time. The wedge pattern holds three significant characteristics:
- The converging trend lines.
- A major decline in volume as the price action progresses through the pattern.
- A major breakout on either of the sides.
The Two Types of Wedge Patterns
- The Rising Wedge (signals a bearish reversal)
- The Falling wedge (signals a bullish reversal)
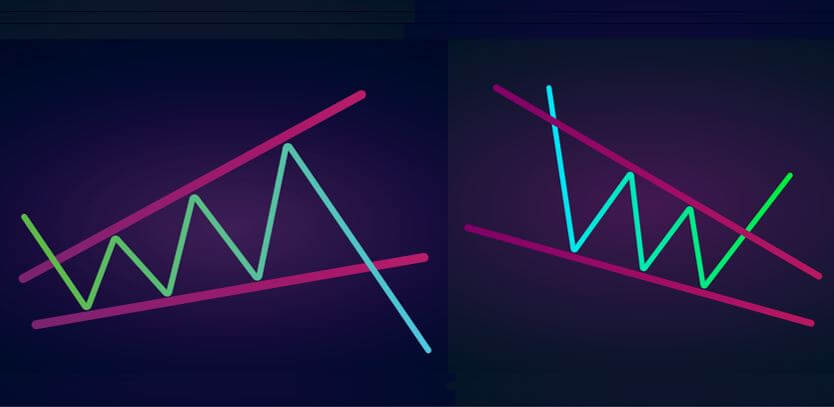
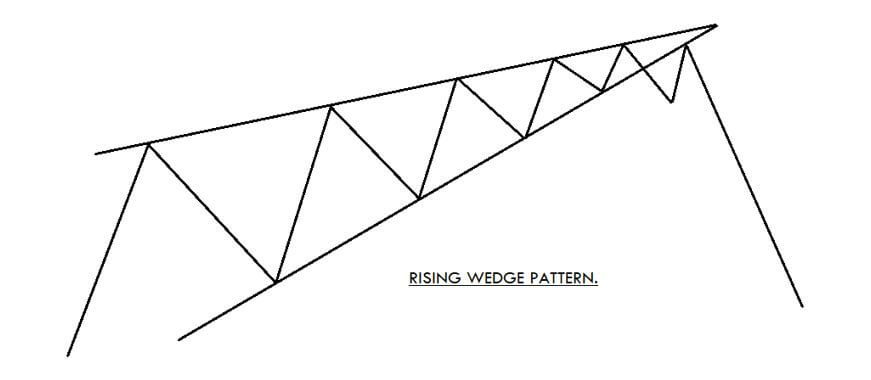
The Rising Wedge
The Rising Wedge is a bearish trading pattern that begins with a wide bottom. The pattern contracts as the prices rise. This pattern typically appears in an uptrend, and on higher timeframes, it takes nearly 3 to 6 months of time to form. Upper and lower trend lines must have at least 3 to 4 higher highs and higher lows to consider that as a Rising Wedge pattern. The loss of volume on each successive high indicates that the price is losing its momentum, and soon we can expect the downside reversal.
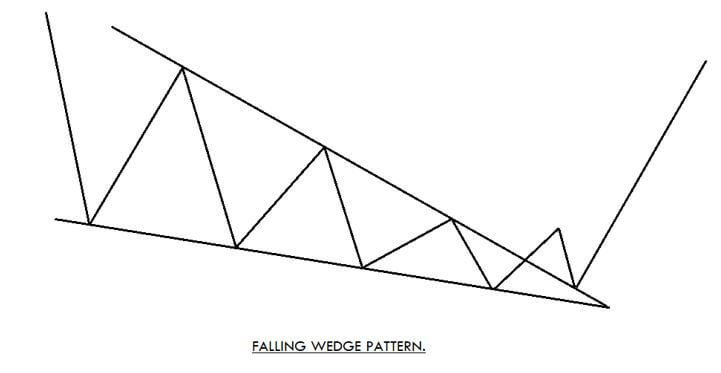
The Falling Wedge
The Falling Wedge is a bullish pattern that begins wide at the top and contracts at the bottom. To confirm this pattern, see if the direction of the trend is downward. Most often, the Falling Wedge pattern forms at the end of the downtrend, as it prints the last lower low on the chart. Mostly this pattern takes almost three to four lower lows and lower highs to print on the price chart. As the price action drops, the loss of volume and momentum increases the probability of bullish reversal.
Wedge Pattern Trading Strategy
The Falling Wedge Pattern
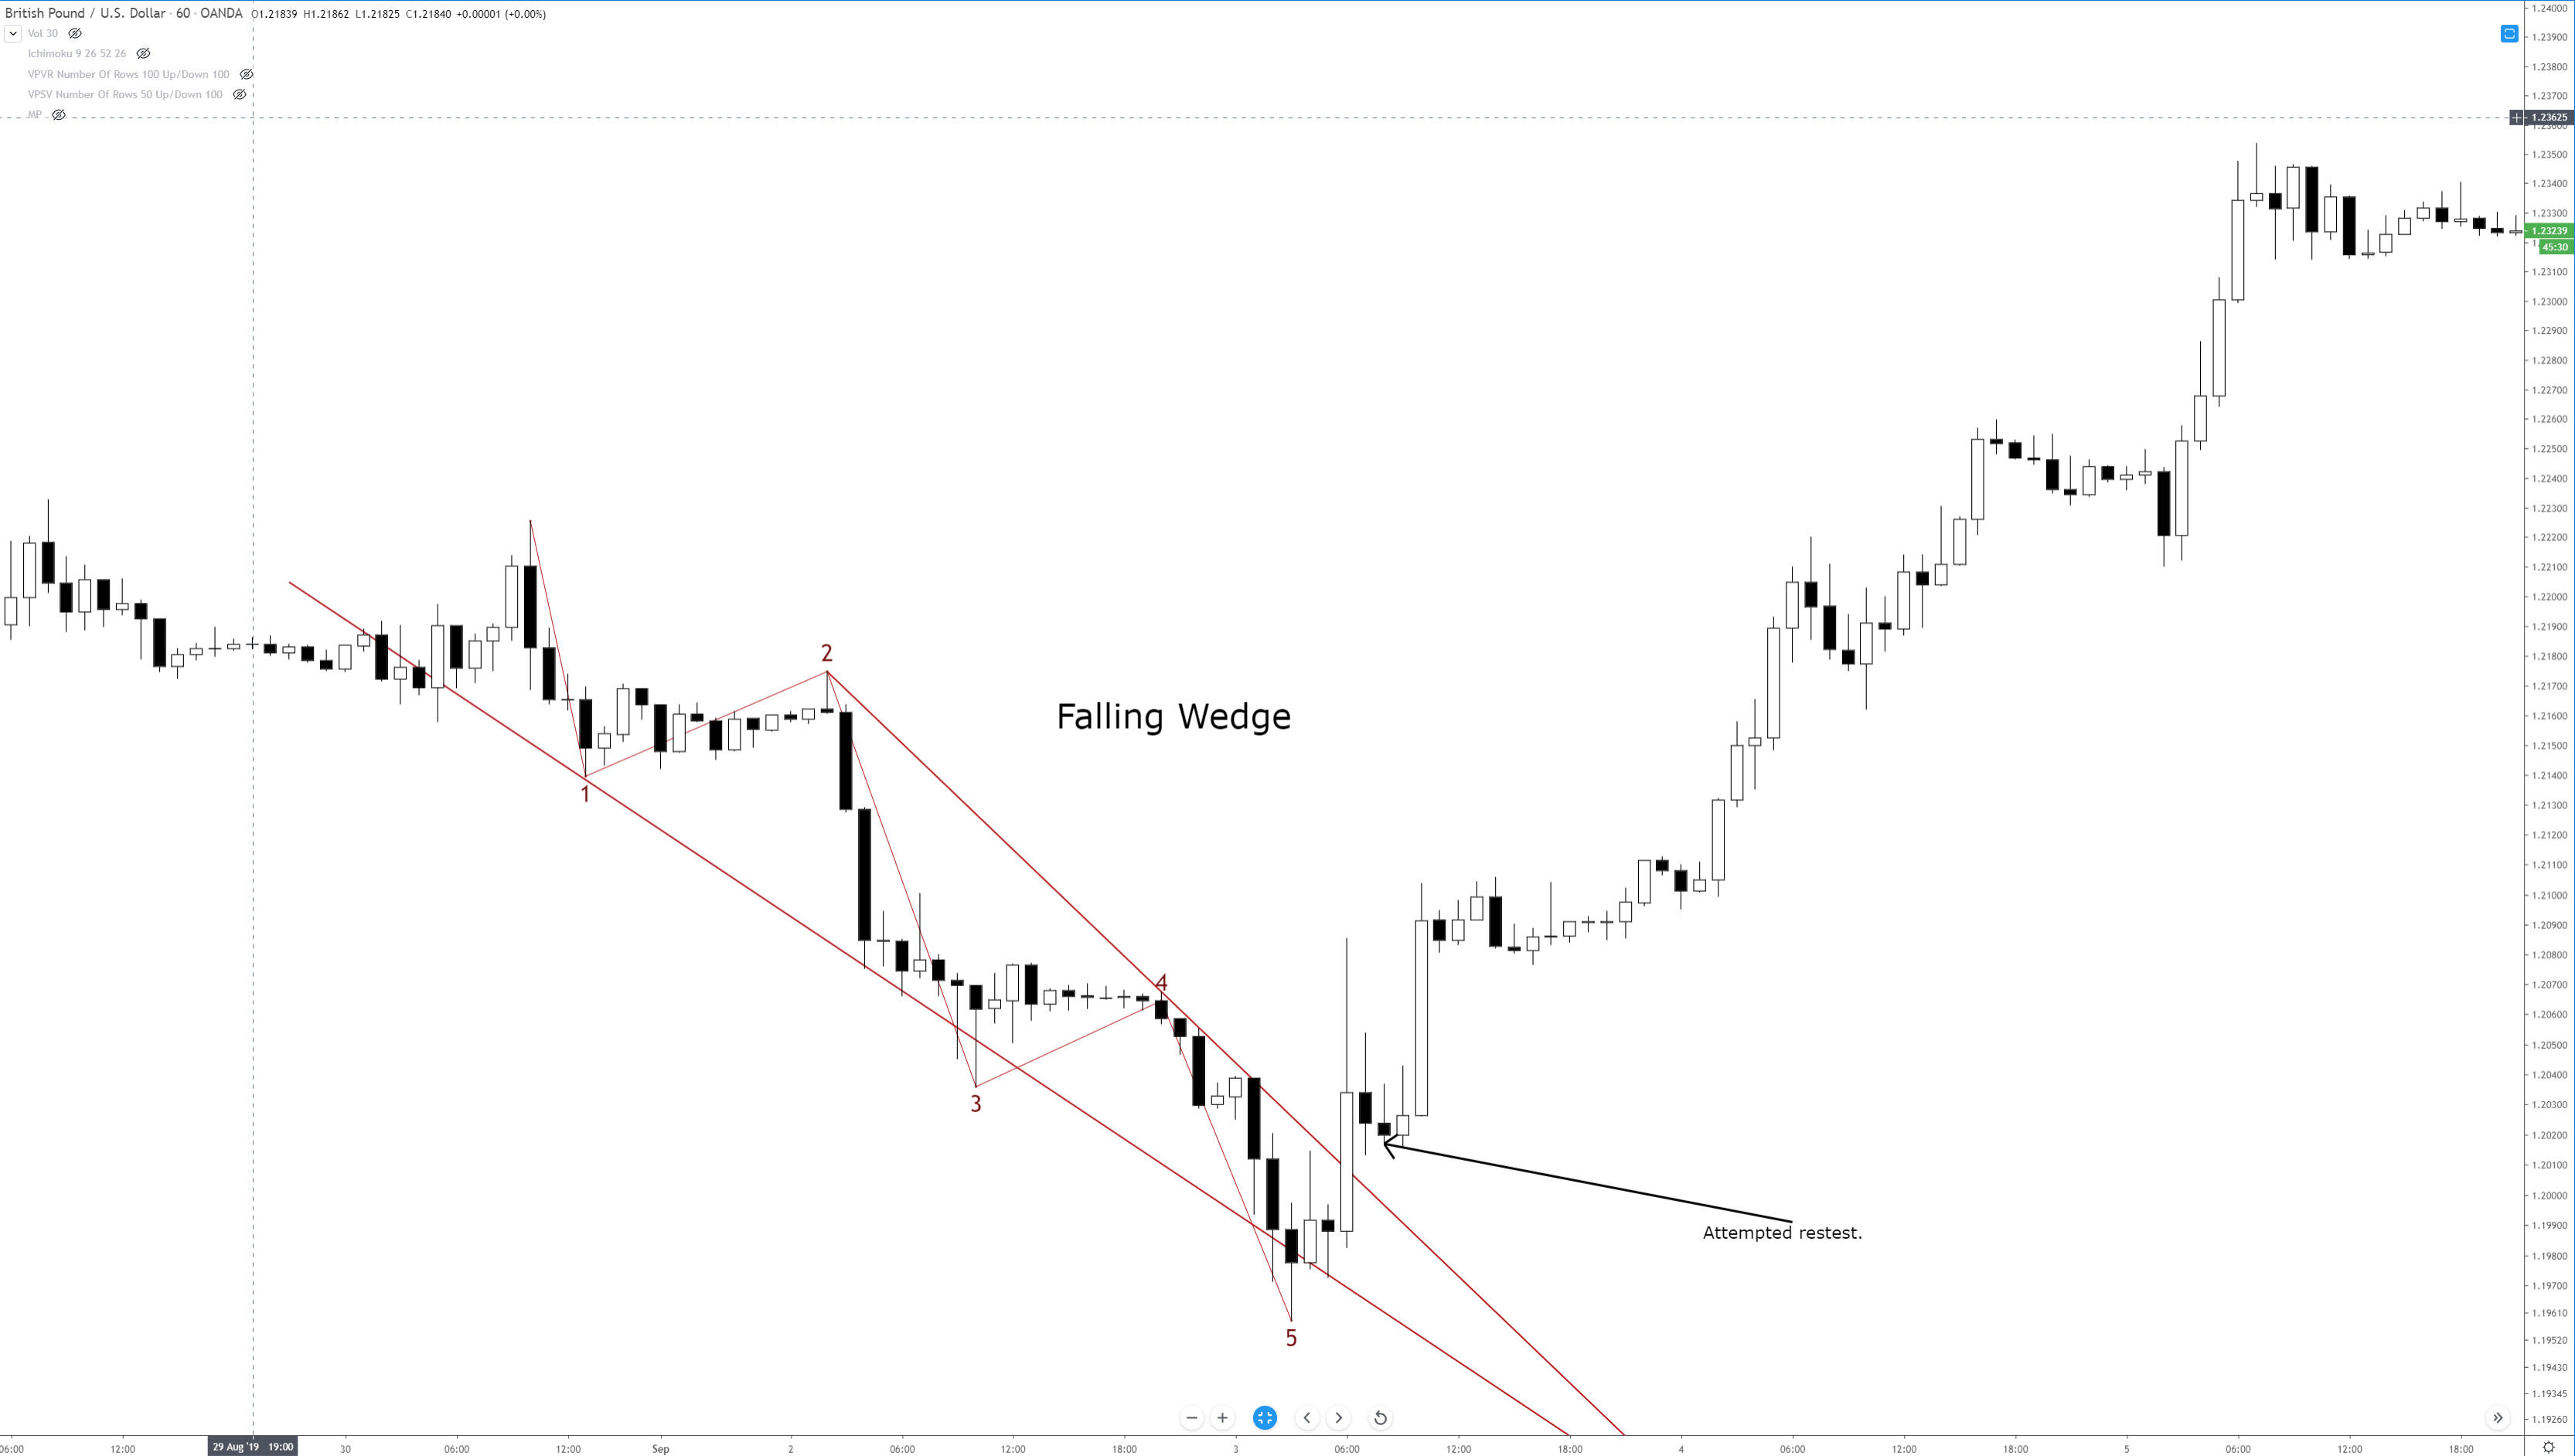
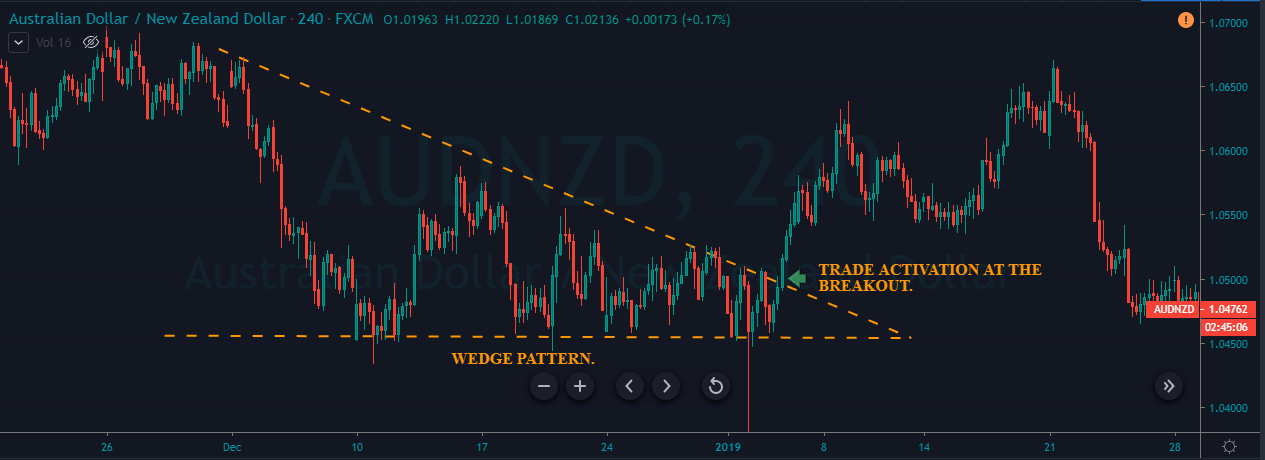
As discussed, a Falling Wedge indicates that the sellers are losing momentum in the market, and the buyers are gaining momentum. This means that we can soon expect a buy-side reversal in the trend. As we can see in the image below, we have identified a Falling Wedge pattern in the AUD/NZD Forex pair. We can clearly see that the price action is confined within the two lines, which gets closer together to create a Falling Wedge pattern. The loss of selling momentum indicates that the buyers are gaining control. When the price action breaks the upper trend line, it shows that the sellers are now out from the game, and this instrument is ready for brand new higher highs and higher lows.
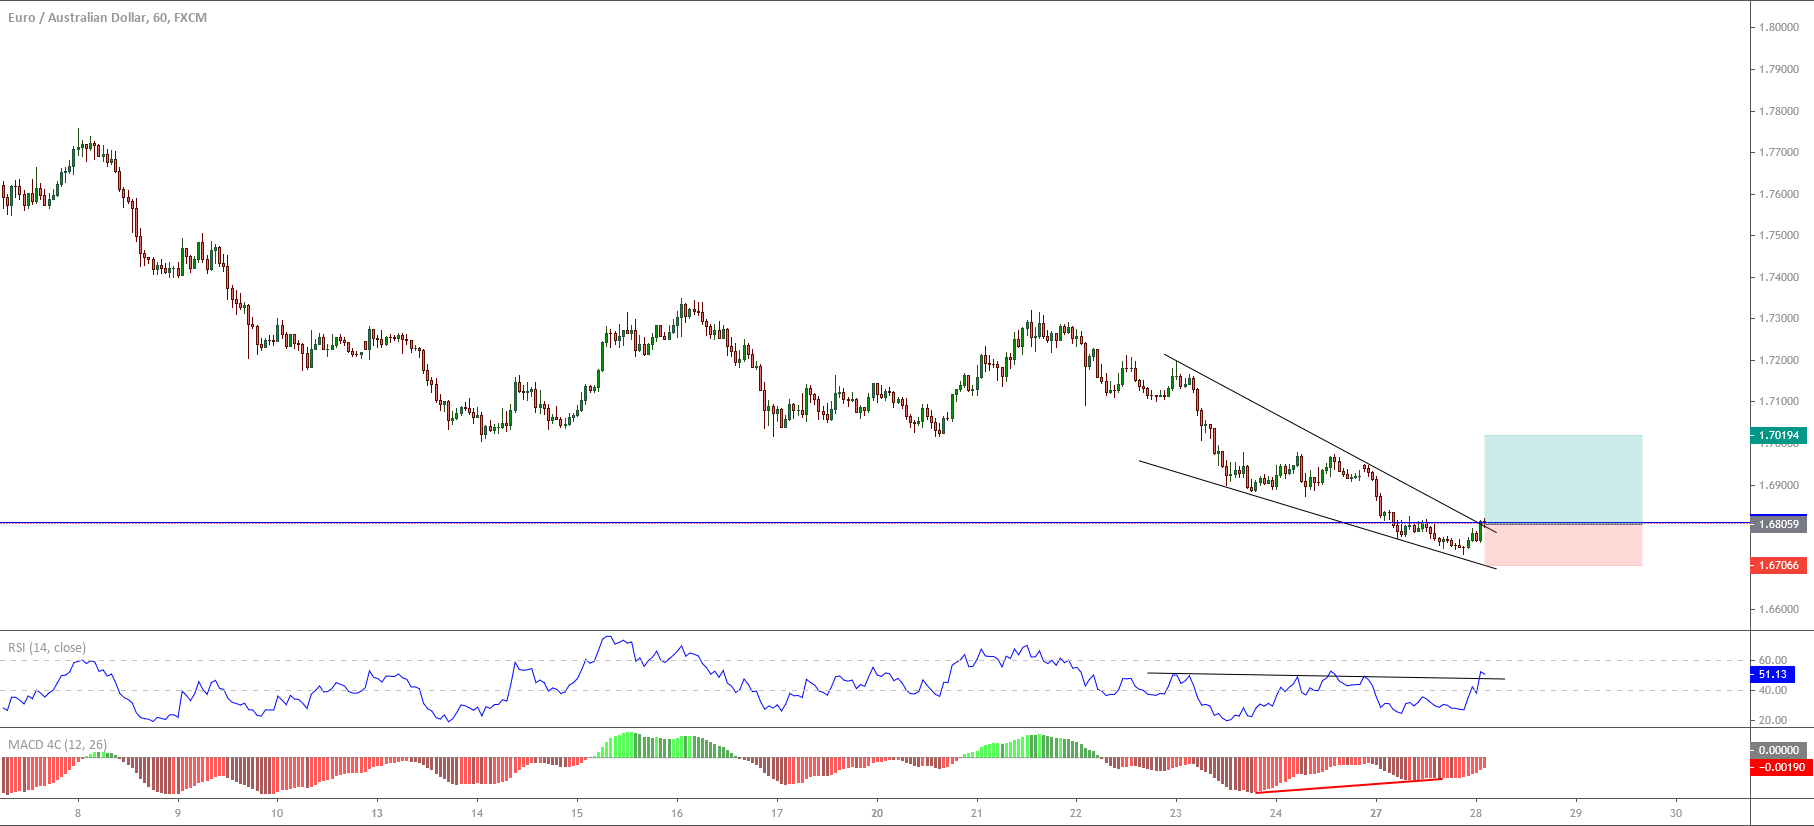
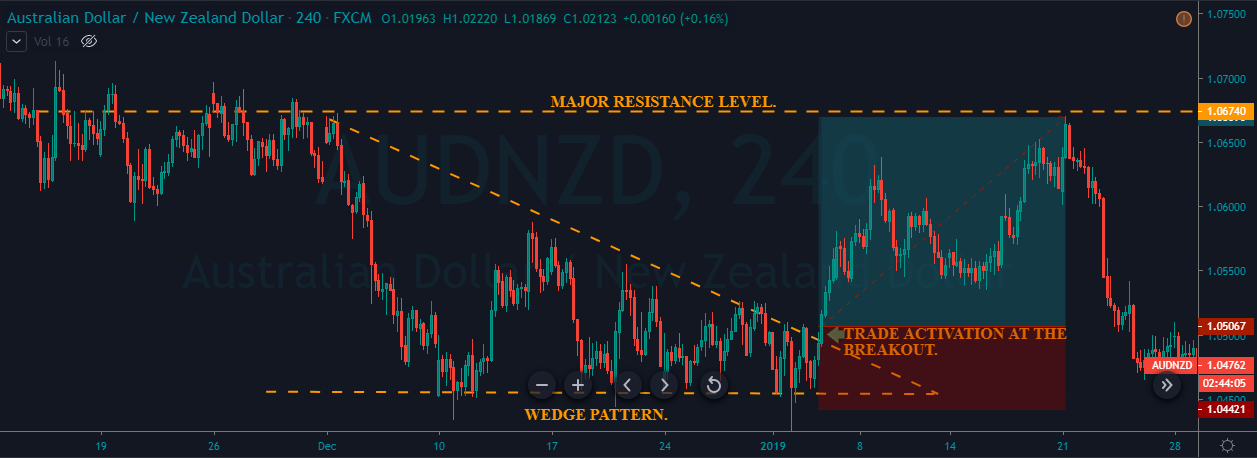
The image below represents our entry, exit, and stop-loss in the AUD/NZD Forex pair. The entry was purely based on the breakout, and the stop-loss was just below the second line. In this example, we go for deeper stop-loss because the market was quite volatile. Most of the time, the breakout line acts as a strong support to the price action. So we can go for a smaller stop-loss just below the close of the recent candle as well. The placement of take-profit order entirely depends on you. Some of the common ways to exit our position are when the price hits the major resistance line, or when the buyers start to lose momentum. In this example, we have placed the take-profit order at the higher timeframe’s resistance area.
The Rising Wedge Pattern
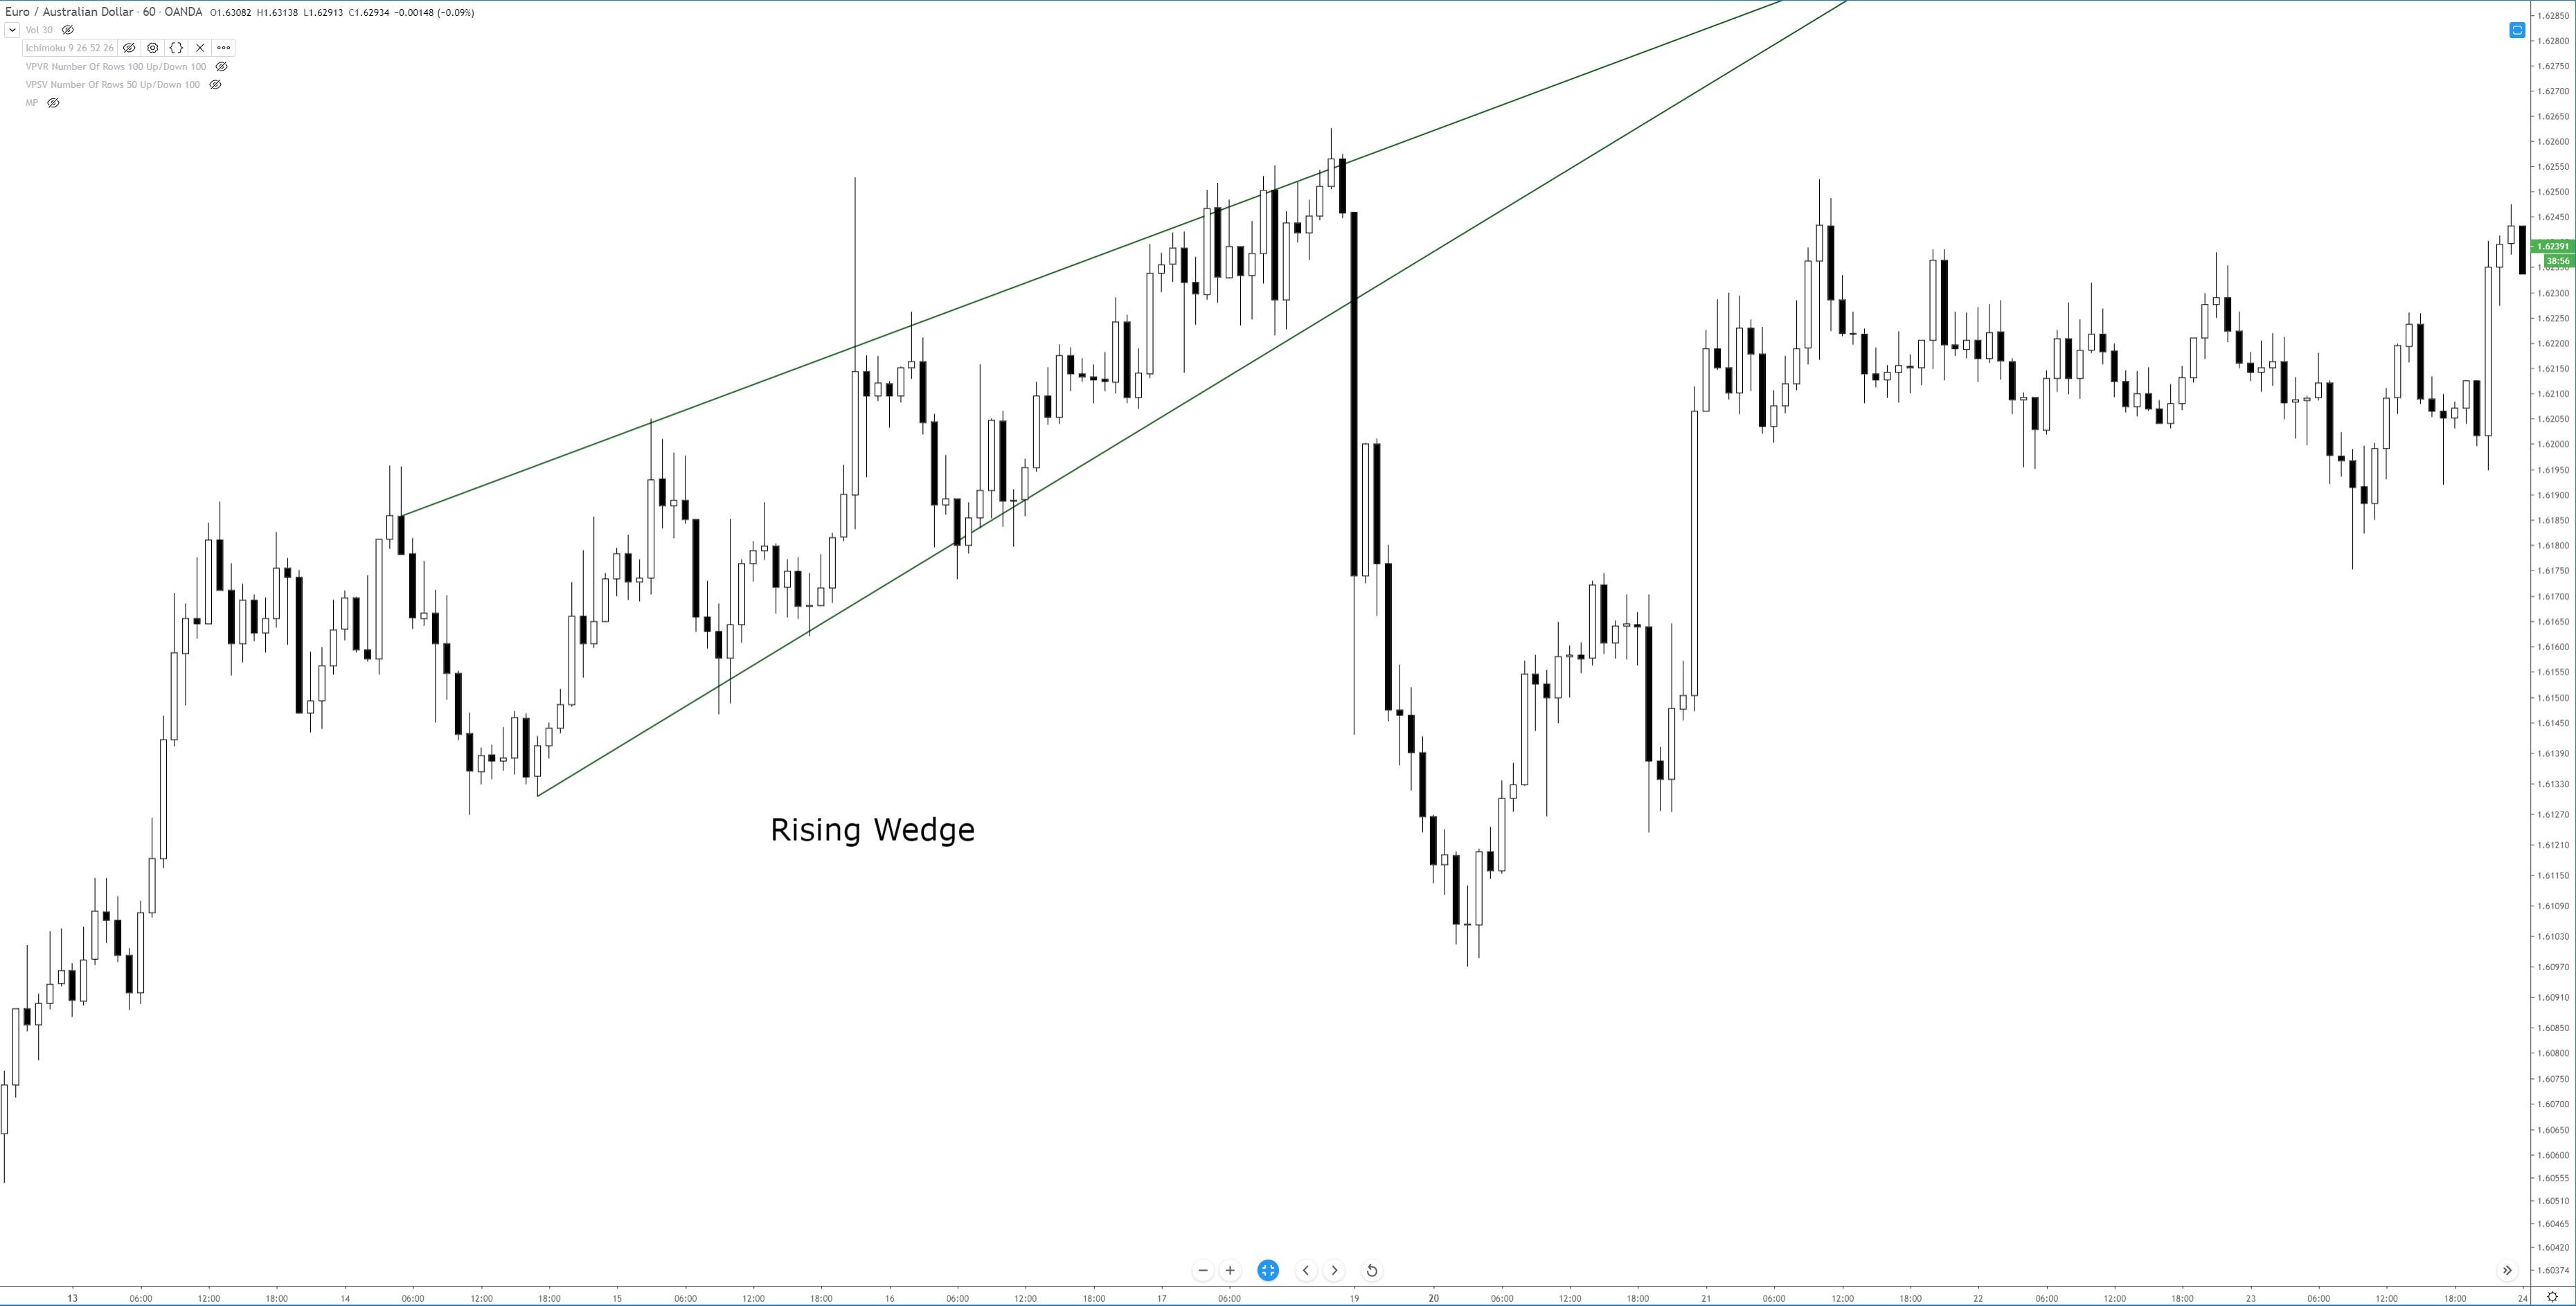
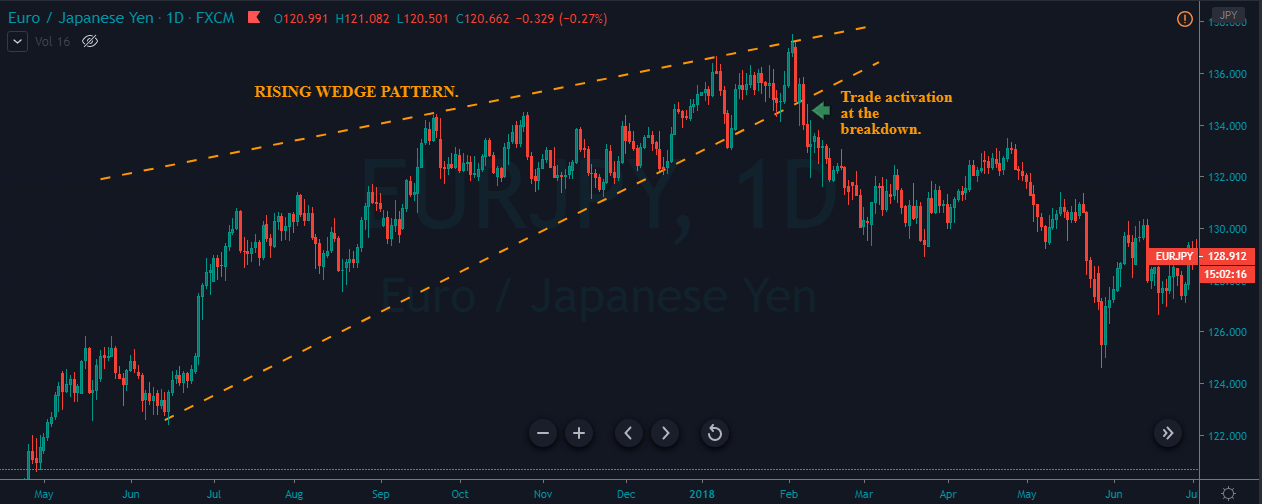
Markets prints the Rising Wedge pattern in an uptrend. When the two lines of the pattern get closer, it indicates that the uptrend is losing momentum, and the probability of the downside reversal is increasing. So when the price action breaks the lower trend line, it is an indication to go short. The below image represents the falling wedge pattern in the EUR/JPY Forex pair, and the entry was at the breakout of the lower trend line.
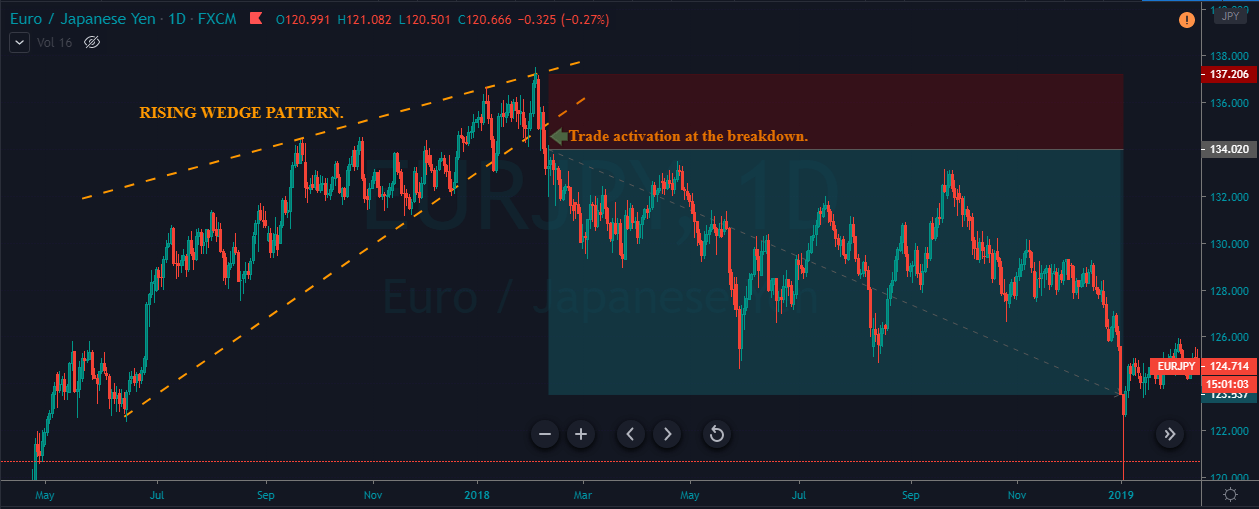
The below chart represents our entry, exit, and take profit in this pair. As mentioned, the entry was after the breakout, and the stop-loss was at the most recent higher high. To place the take-profit, we choose the major resistance line. But notice that on this daily chart, price action took so much time to hit our take profit. This is normal, and while trading this pattern, we will face these types of situations. Most of the time, this pattern offers very strong signals. So it is important to control our emotions and not panic. Holds your positions for the target you are looking for. If the price action came back to the breakeven, only then we suggest you close your position. Otherwise, place the stop-loss at breakeven and wait for the market to hit the take-profit.
Pros & Cons Involved
Just like any other technical trading pattern, the Wedge pattern also has its own pros and cons. The problem is that there is no specific benchmark for this pattern of where to enter and where to exit our positions. Some traders pair this pattern with the other technical indicators to take an entry while some traders wait for the trend line breakout to take entry.
Both ways work very well, and both have the chance to lead us to more significant profits. The biggest advantage we have is the leverage of more than two lines coming together. It is a warning for us to stop taking sell trades and expect a buy-side reversal soon. So with this, we know the shift in the direction of price action ahead of time. This will ultimately help us in entering the trend at the earliest.
Conclusion
For us to witness & confirm this pattern on the price chart, three things are required. Two trend lines must come close to each other as the price action moves and within those two lines, and that’s primary. The second rule is that one-party must be losing its momentum while the other party must show the sign of coming back in the show. The third thing is that the breakout of either one line according to the circumstances is necessary.
To take a trade, we can enter the breakout, or we can wait for the price to retest the trend line. The stop-loss should be set above/below the second line, and the take-profit order must be placed at the higher timeframe’s resistance area. Identifying this pattern is easy compared to the other trading patterns out there. We must train our eyes to find this pattern visually on the price chart and look for the best entry, exit, and stop-loss areas. All the best!