Categories
Forex Course

113. Introduction To Forex Chart Patterns

Introduction

We have learned a lot of concepts related to technical analysis in the past few course lessons. Starting from Moving Averages, we have extended our discussion to Fibonacci Trading, Candlestick Patterns, and Indicator based analysis. We have also gone through some of the advanced technical trading concepts like Pivot Trading and Elliot Wave Theory.

We hope you have understood these concepts and started to apply them in a demo account. If you have any queries, please post them in the respective lesson comments so that we can address them in the right place. However, this is not the end of the technical analysis basics. We must go through one most crucial concept before going further. And that is to learn the trading of Forex Chart Patterns.

What are Forex Chart Patterns?

Do not mistake these Forex chart patterns with the Candlestick Patterns that we have learned before. Two or more candlesticks form candlestick patterns. And the maximum number of candlesticks in a single candlestick pattern is not more than four. But when it comes to Forex Chart Patterns, there are more candlesticks involved. The number can range from 50 to 500 and beyond.

To explain in simple terms, we know the price action moves in three different stages – Trends, Channels, and Ranges. When moving in these stages, the candlesticks follow specific patterns at times. Primarily, these patterns are formed by a group of candlesticks, and they look similar to the shapes that we see in real life. For instance, below is the snapshot of one of the very well known Forex chart patterns known as Cup & Handle Pattern.

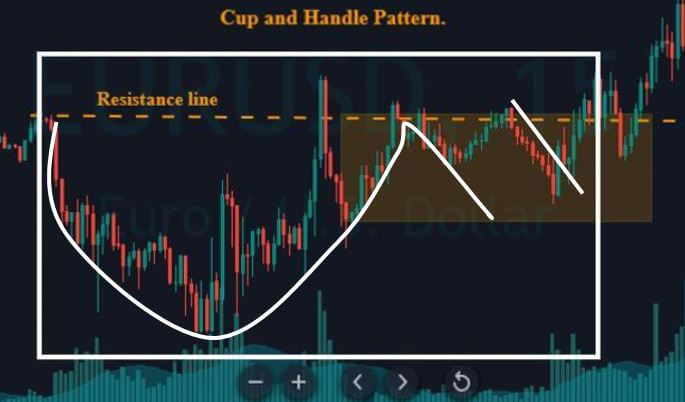
(Image Taken From – Forex Academy)

In the above image, we can see how candlesticks combined to form a Cup & Handle Pattern.

Why is it important to know them?

We can consider these Forex Chart Patterns as land mine detectors. Because, when mastered, we will be able to detect the market explosions before even they occur. Hence any technical trader needs to learn to identify and trade these chart patterns. Forex chart patterns are given the highest importance because of one simple reason – high probability performing trades.

For technical analysts and price action traders, these chart patterns offer reliable clues to make their moves in the direction in which the price might go in the future. The reason behind this is that these patterns have the potential to push the price in a specific direction. There is a logical reason behind the formation of every single chart pattern, and why the price will go in a particular direction after the formation of these patterns.

Types of Forex Chart Patterns

Just like what we have learned in the Candlestick pattern lessons, there are three different types of Forex Chart Patterns.

Continuation Patterns – The appearance of these patterns indicates that the underlying trend will continue, and the price will continue moving in the direction that it is currently moving.

Examples – Pennant Chart Pattern and Rectangular Chart Pattern

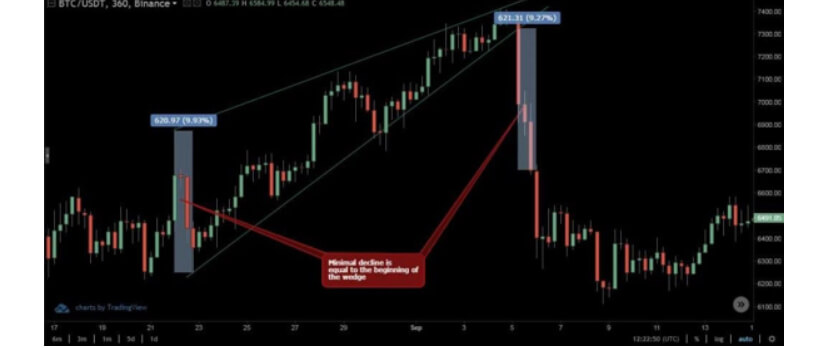
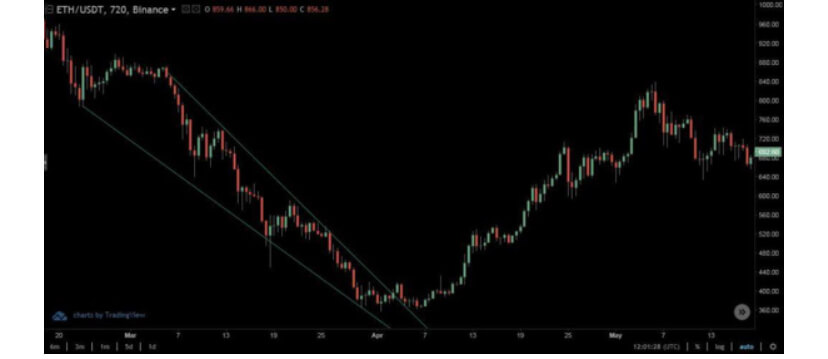
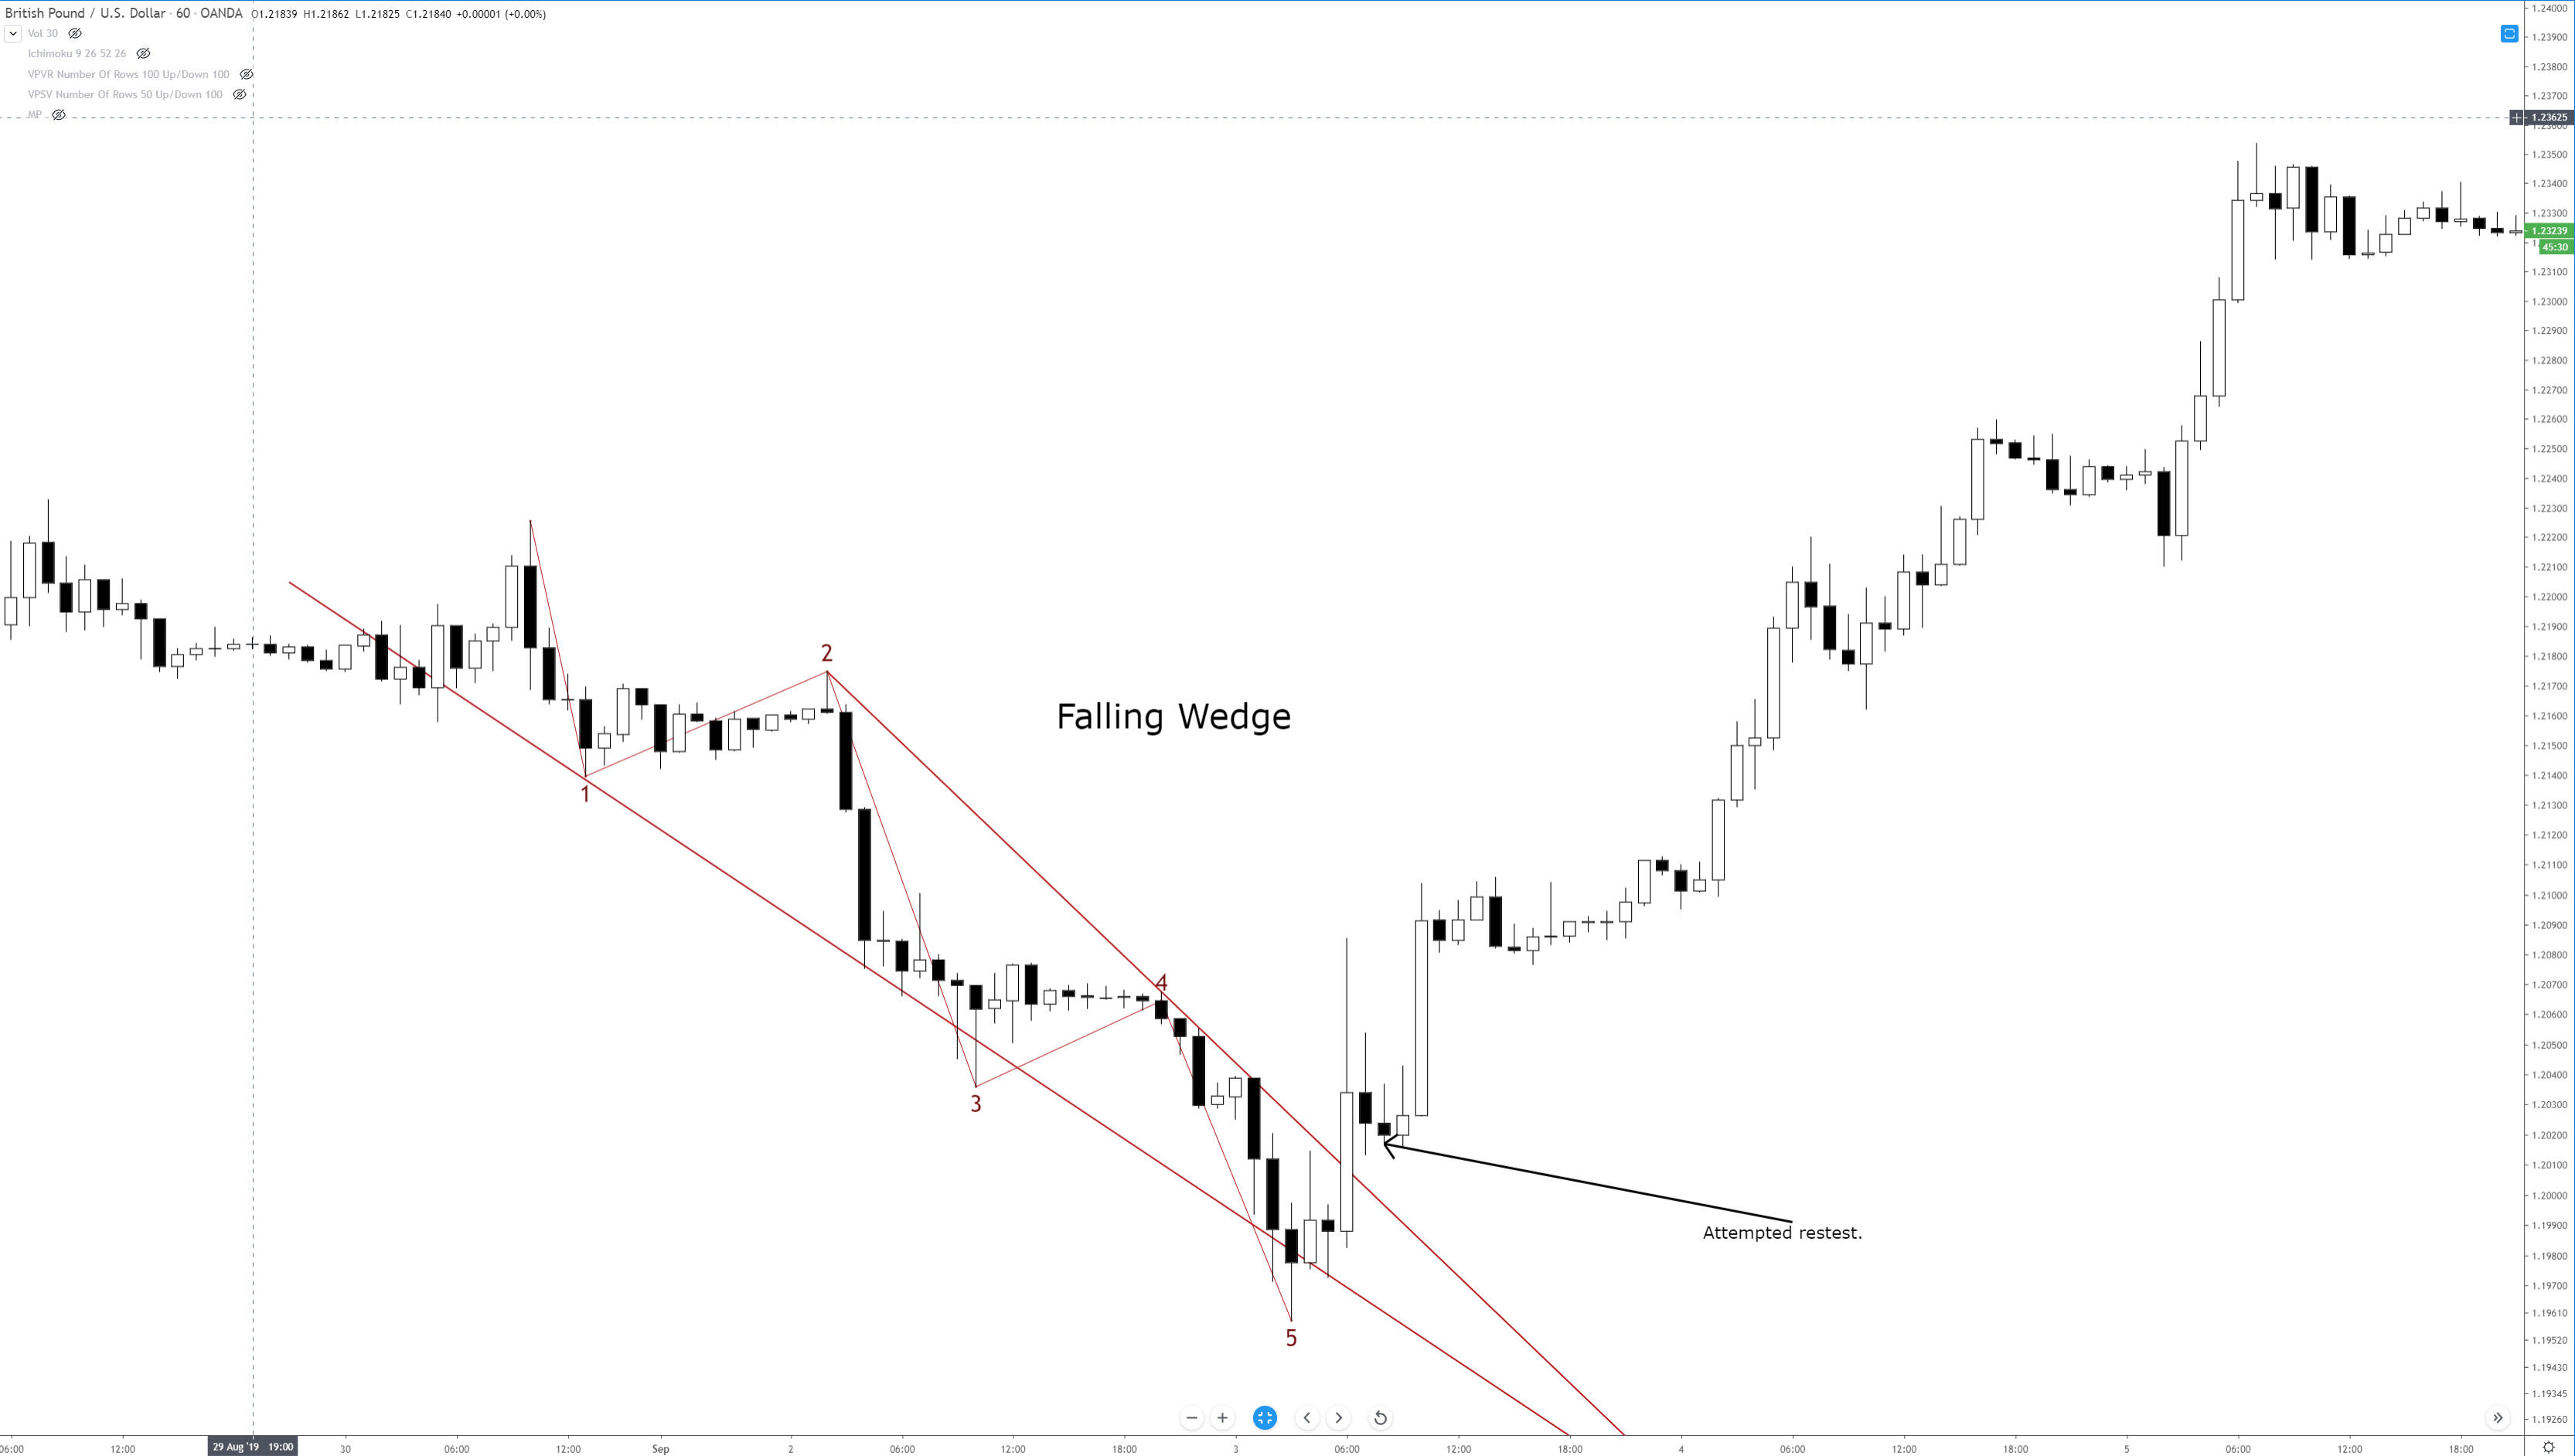
Reversal Patterns – If we have identified these kinds of patterns on the price chart, it is an indication that the market is about to reverse its direction. Hence the name – Reversal Patterns.

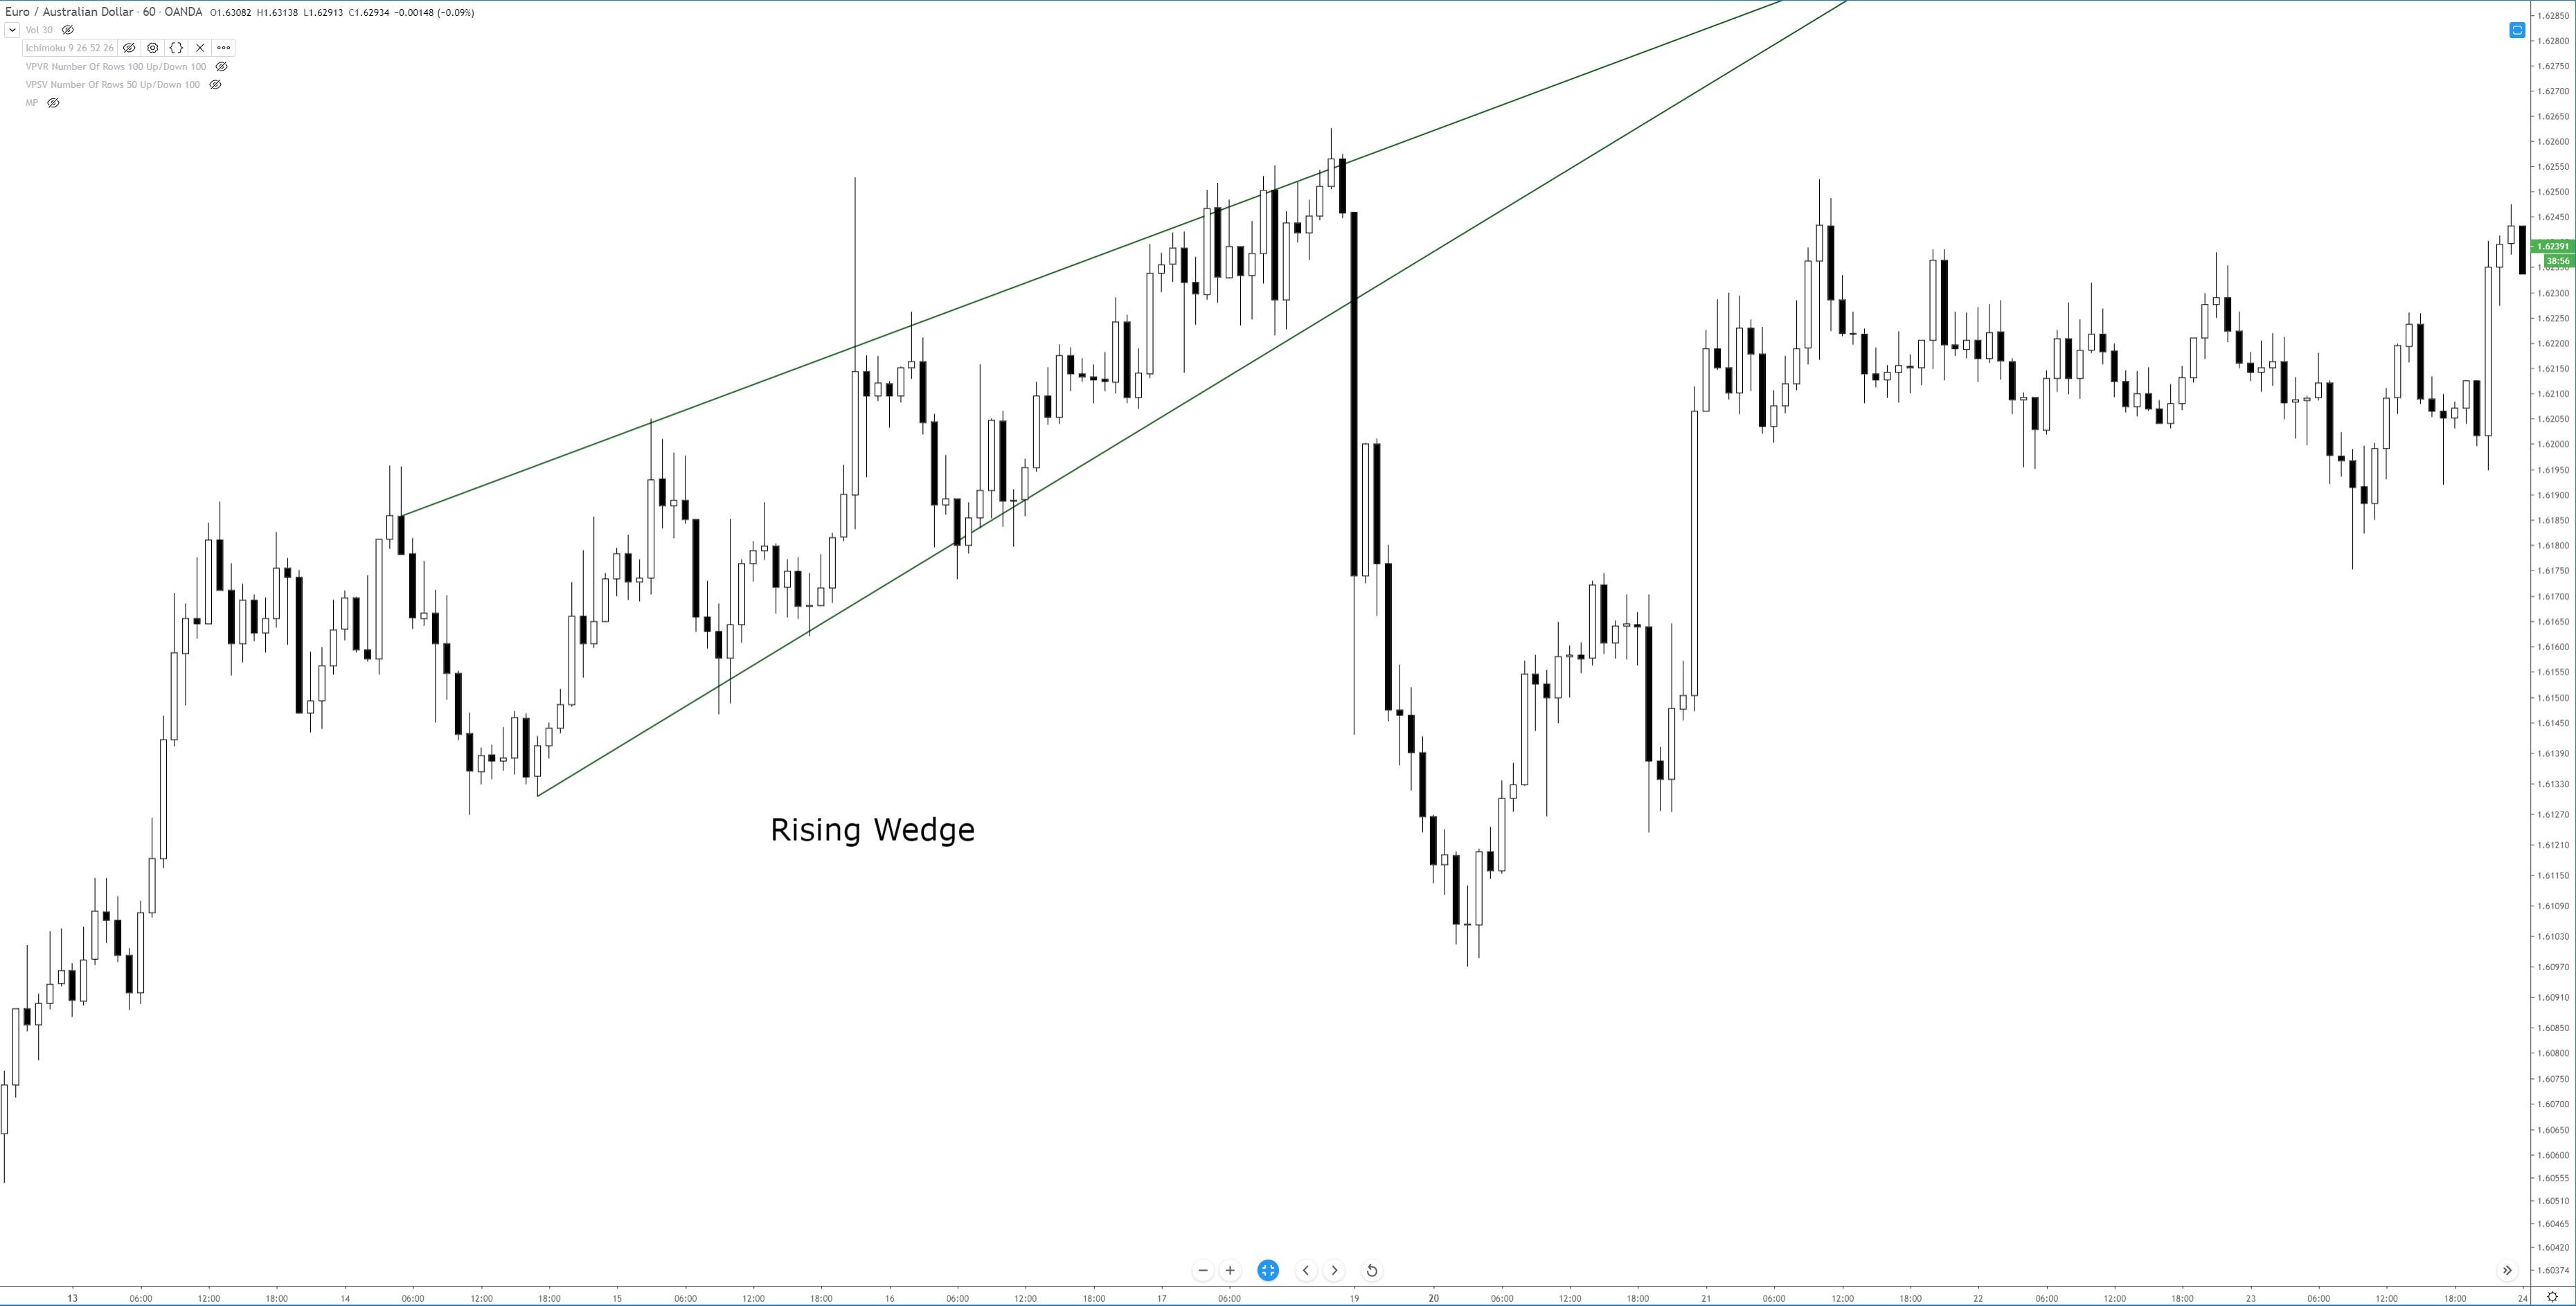
Examples – Wedge Pattern, Head & Sholders Pattern, and Double Tops & Bottoms.

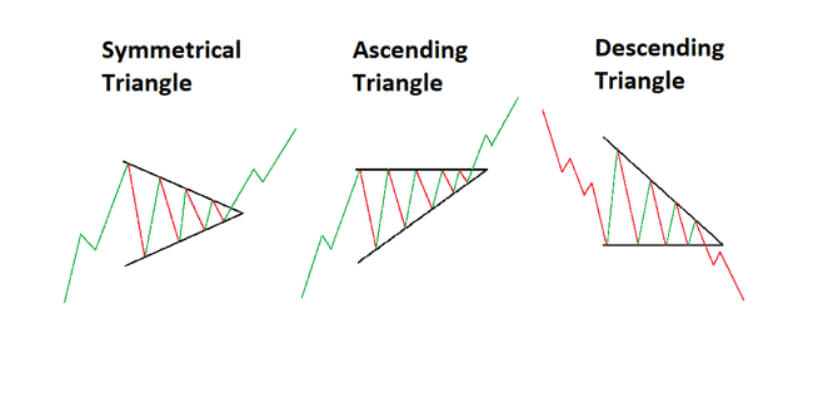
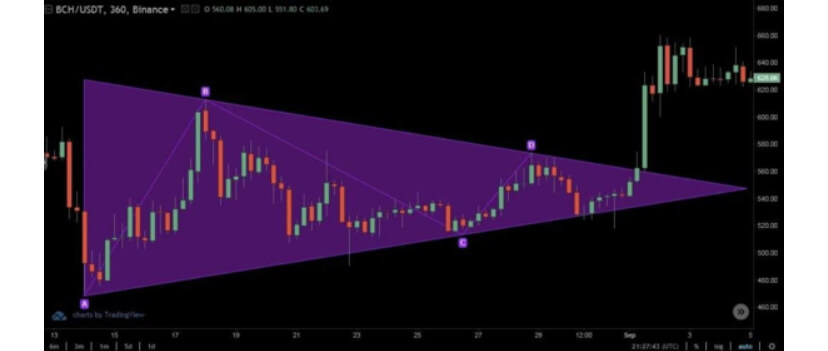
Neutral Patterns – These patterns are termed neutral because the price can move in either of the directions after the formation of these patterns. So we must be careful while trading these kinds of patterns.

Example – Symmetric Triangle Pattern

We will be covering a combination of these in the upcoming articles so you will get a holistic knowledge of trading Forex patterns. Stay Tuned!

Categories
Crypto Videos

Make Huge Profits Market Pattern Trading In Crypto (Head and Shoulders, Triangles, Wedges) Part 2/2


pattern trading in cryptocurrencies (Head and Shoulders, Triangles, Wedges) – part 2/2

This part of the guide will cover various triangle formations as well as wedges.

Triangles

Triangles come in three formations:
Ascending triangle
Descending triangle
Symmetrical triangle

Ascending triangle

Traders can spot an ascending triangle by the price going up and down between the constant line of resistance and the rising support.
The ascending triangle is widely considered to be a bullish formation, which leads to massive profits if approached the right way.
However, those not careful enough might consider taking a position near the support line in hopes of enhancing their gains, only to end up with a loss as formation didn’t complete, and the price movement turns to be a double or triple top bearish formation.
Targeted prices are measured by the widest distance between the highs and the lows, and applied up from the point of the breakout.
Experienced traders will wait for a confirmation of the upward breakout accompanied by a much bigger volume before taking a position, as breakouts without an increase in volume can catch traders in a bull-trap (as we showed on the chart).

Descending Triangle

A descending triangle is considered a typical bearish formation. For it to form, the price action needs to flow between a steady support line and descending resistance.
The pattern is confirmed only once a downward breakout with increased volume happens. Only then can a trader expect the continuation of the price movement to the downside.
Just like with ascending triangles, the price target is equal to the widest swing inside the triangle transferred from the breakout point to the downside.

One of the most famous descending triangles in cryptocurrencies is the one that formed on the 2018 Bitcoin chart.

Symmetrical triangle

These triangles are probably the most common formations in cryptocurrency trading. However, at the same time, they are the most unpredictable.

As the symmetrical triangle approaches its closure, the trading volume drops as traders are often indecisive about whether the price will unfold to the upside or downside. When the war between the bulls and the bears resolves, we get two outcomes: positive and negative.
Any of these breakout movements will be followed by an increase in volume, which will be even more visible due to the reduced trading volume before the breakout.
Once the breakout happens, traders can expect the target price to be the same distance as the distance between the breakout side and the base of the triangle.

Wedges

Wedges are very common formations in crypto trading as well. They are considered a multiple price wave reversal patterns.
The price action in a wedge swings from highs to lows multiple times before breaking out of the pattern.
Wedge formations come in two forms:

Rising wedges
Falling wedges

Rising wedge

As opposed to the ascending triangle formation, the rising wedge has price swings that travel through highs and lows, but both the highs and lows are getting higher. This formation announces a bullish trend reversal into a strong bearish sentiment.

Falling wedge

The falling wedge formation, on the other hand, looks like a mirror image of the rising wedge and announces a trend reversal from bearish to bullish.

As with other patterns, it is advisable for traders to get the confirmation of the breakout before taking a position.
The minimum targeted price for the falling wedge is the exact opposite of the ascending wedge.

One thing to notice is that, in the cryptocurrency market, peaks do not necessarily follow highs and lows in an exact straight line. They are rather just close enough in the price range to mark the formation.

Categories
Chart Patterns

Chart Patterns: Wedge Patterns

Wedge Patterns

I want to stress, again, that the frequency and positive expectancy of patterns in technical analysis will vary from market to market. Most of the literature is written for the stock market, which is an overwhelmingly long-biased market. So, bullish patterns perform much better than bearish patterns in the stock market. I don’t have any real statistics to reference other than my years of trading experience. It has been my experience that wedge patterns are one of the most profitable setups in the forex market.

Wedges look like (and in fact, are) extended triangles. Wedges are made of two trend lines that are drawn just like a triangle. The difference between wedge patterns and triangle patterns is simple: the trendlines in a wedge pattern point in the same direction. Ascending triangles have flat tops and a rising bottom. Descending triangles have flat bottoms with declining tops. Symmetrical triangles have a downtrend line and an uptrend line. Wedges are different. Rising wedges have a trendline both above and below price sloping up. Falling wedges have a trendline both above and below, but sloping down. Depending on the technical analysis material you read, you will see wedges that may look like channels, and that is fine – many do.

Wedge patterns should tell you one thing: the end is coming. Because wedges have two trendlines that point in the same direction, the slope of the move is often extreme and is indicative of a climax move. These are incredibly profitable and favorable patterns when you spot them – and they are horrible to trade against if you are trading inside of them. If you read Bulkowski’s work, you’ll know that he recommends at the trendlines in a wedge should be touched at least five times in order for the wedge pattern to authentic. This is true in the stock market as well as in the forex market.


Rising Wedge

Rising Wedge
Rising Wedge

You might think that a rising wedge pattern shows up at the top of a trend, and it often does. But you will also find the rising wedge appear at the bottom of a trend. When you see the rising wedge appear after a prolonged downtrend, be careful! The rising wedge that forms after a long bear move is often a continuation pattern. An easy way to think of the rising wedge is that it is an overwhelmingly bearish pattern. It doesn’t matter where it shows up in any trend – it is an extremely bearish pattern.

When I am trading the rising wedge, I generally take the initial breakout that moves below the second to last test of the bottom trendline. The example above shows that there is no immediate retest of the breakout lower. Retests do happen, but they are less frequent than what we see in the ascending, descending and symmetrical triangles.


Falling Wedge

Falling Wedge
Falling Wedge

The inverse of the rising wedge pattern is the falling wedge pattern. It can show up at either the end of an uptrend or a downtrend. If you see a falling wedge that occurs at the top of an uptrend, then you could we witnessing a false breakdown lower and see a resumption of the prior bull move. If you see the falling wedge at the end of a downtrend, then you can expect a swift reversal or deep throwback. Just like the rising wedge, the falling wedge is heavily biased towards one direction: overwhelmingly bullish.

On the image above, I’ve added an Impulse Wave to show how you can use Elliot Waves to help determine whether or not a wedge pattern is valid. Remember: Bulkowski said that that a wedge pattern is only confirmed when the trendlines have been tested at least five times. Another condition on the chart above that we didn’t see on the falling wedge is the attempted retest of the break. Again, retests are common in all patterns, but they are definitely less frequent with wedge patterns – that has been my experience with them in forex markets.

When trading the falling wedge, I like to enter when price moves above the second to last swing high. On the chart above, the entry would be above wave four.


Sources:

Kirkpatrick, C. D., & Dahlquist, J. R. (2016). Technical analysis: the complete resource for financial market technicians. Upper Saddle River: Financial Times/Prentice Hall.

Bulkowski, T. N. (2013). Visual guide to chart patterns. New York, NY: Bloomberg Press.

Bulkowski, T. N. (2008). Encyclopedia of candlestick charts. Hoboken, NJ: J. Wiley & Sons.

Bulkowski, T. N. (2002). Trading classic chart patterns. New York: Wiley.