Categories
Forex Education

How to Use Reversal Patterns to Create a Trading Strategy

Introduction

The basic premise of technical analysis is to identify the dominant trend in the financial market and make money trading in its direction. Likewise, when the trend changes, the market analyst should recognize that the previous trend has ended and that it is time to join the new trend.

In this context, the chart pattern analysis offers a wide range of technical formations that reveals the reversion or continuation of a trend. These formations repeat themselves again and again in financial markets. 

This educational article will review a set of chart patterns of reversal and continuation of the trend.

Reversal Chart Patterns

Reversal patterns tend to appear after a prolonged uptrend or downtrend and is usually accompanied by higher volatility. Likewise, the size of the chart formation is indicative of the future movement, as the next move usually experiences advances or declines of similar proportions.

Double Top and Bottom

The double top and bottom is the most common reversal formation that appears in a chart. The following figure illustrates a double top and a double bottom formation.

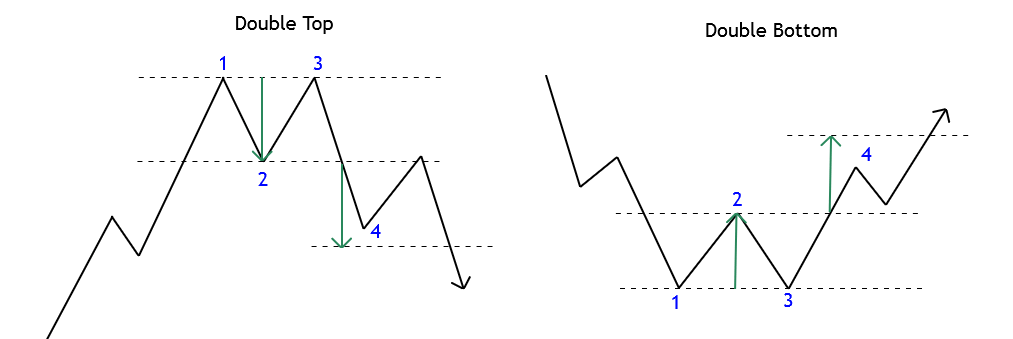
In a double top, the price reaches a determined top level twice, and it will be confirmed once the price breaks and closes below the valley between the two highs. In the double bottom case, the price moves up, then retraces but cannot break through the previous support level. The pattern is confirmed once the price rises and closes above the minor top between the two lows.

The profit target of this structure can be set to a distance similar to the range between the top and the valley that conforms to the double top/bottom pattern. The invalidation level is located above (or below) the top (or bottom) of the reversal formation.

Triple Top and Bottom

The triple top and bottom formation arise from the same market factors of a double pattern, the next figure shows the setup of this formation. The stop-loss and profit target calculations are similar to those of a double top/bottom pattern. 

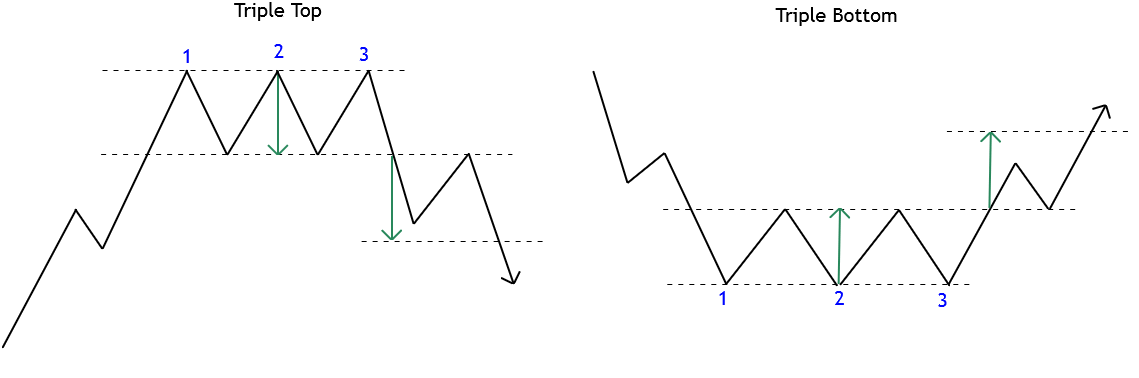
In technical terms, the triple top and bottom pattern will be completed when the price action advances a distance similar to the range between the top and the valley that conforms to the triple pattern.

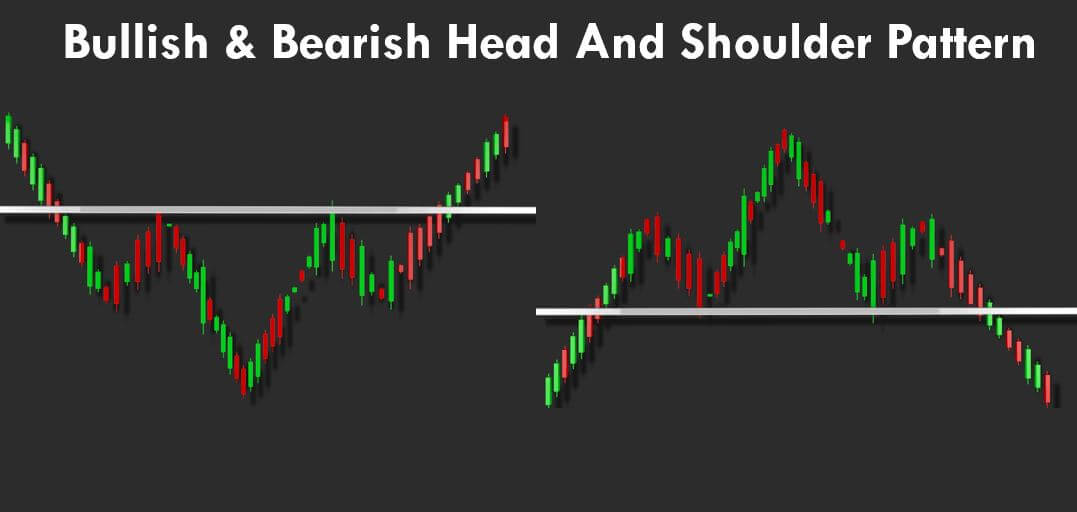
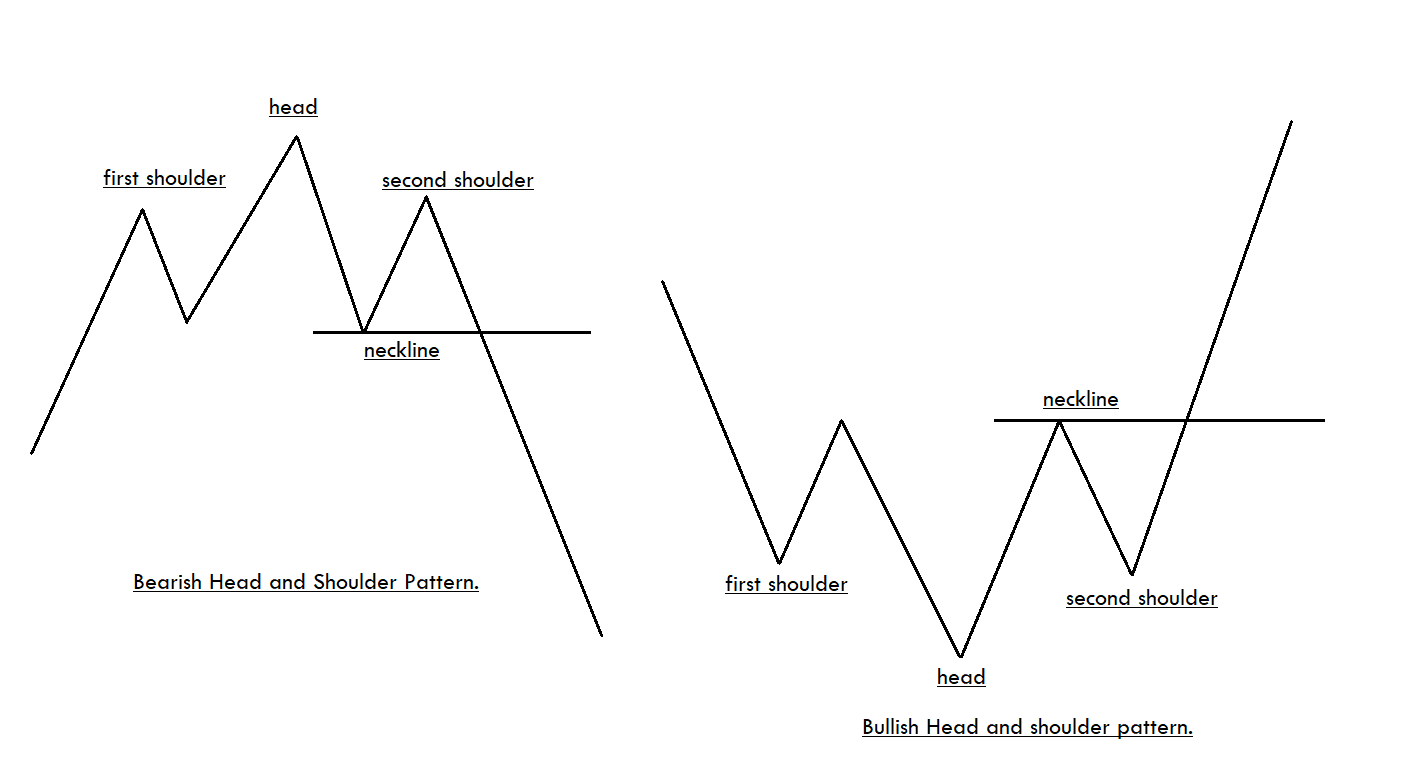
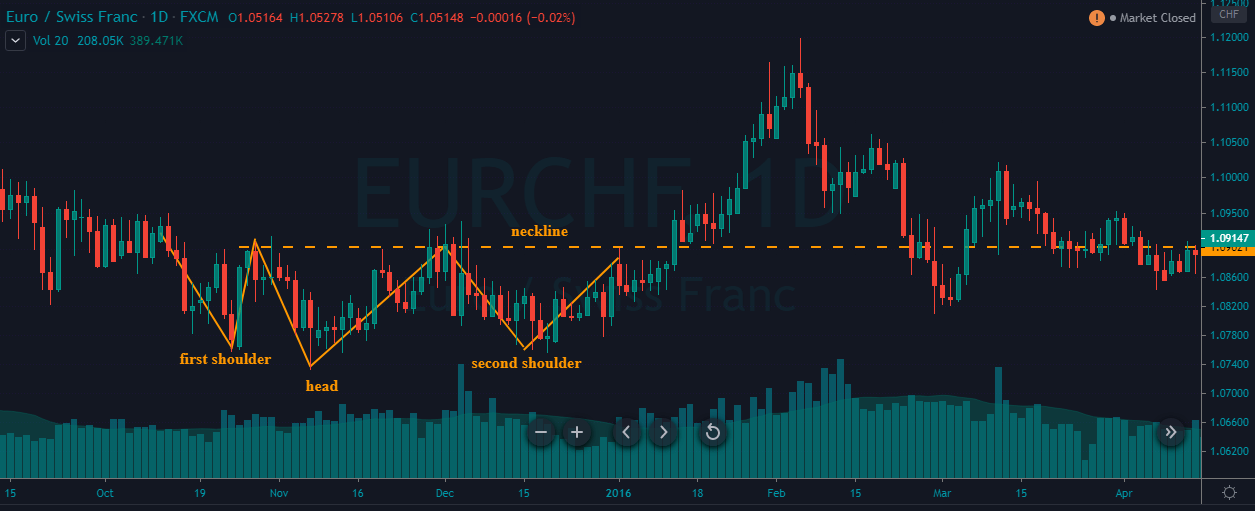
Head and Shoulder Pattern

The head and shoulder pattern is by far the best-known formation warning of the end of a trend. This reversal pattern looks similar to the triple top and bottom structure. The second high (identified as 3 in the following figure) is higher than the tops preceding and following the central high.

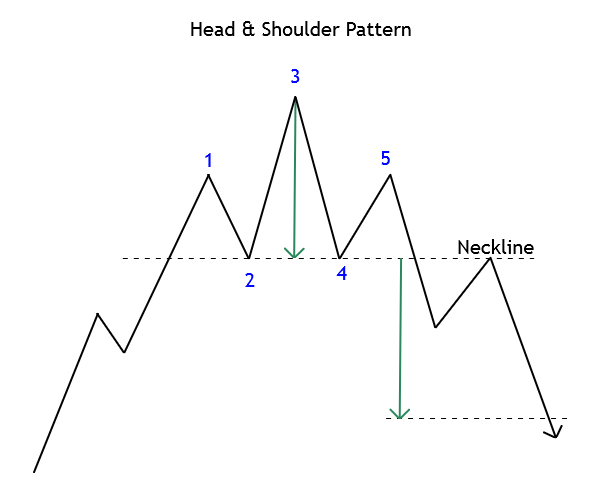
The formation is said to be completed once the price breaks and closes below the neckline. The target will correspond to the length between the head and the neckline when projected from the neckline. A possible choice for the stop-loss level is to place it above the second shoulder (5). An alternative to this placement is to put it above the top level of the head (3).

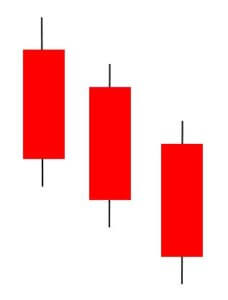
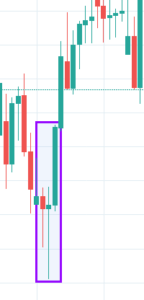
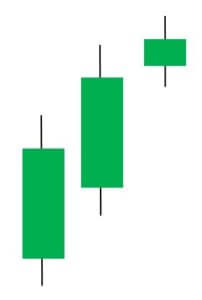
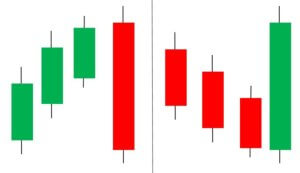
Three Falling Peaks or Three Rising Valleys

The three falling peaks or rising valleys are seldom spotted, although its technical structure is clear. The following figure illustrates both cases.

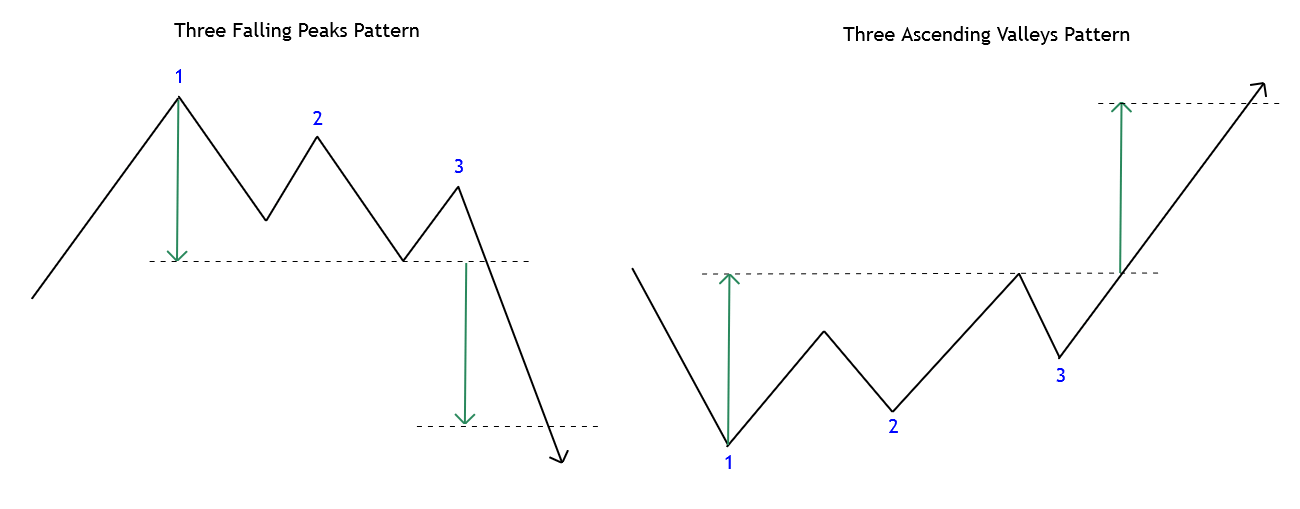
The three falling peaks will generate a sell-side position if the price breaks and closes below the second valley. In the three rising valleys case, a buy-side position will be activated if the price climbs and closes above the second peak. 

A potential zone of profit target would correspond to the length from the top (or bottom) to the second valley (or peak) and projected from the breakout zone. The stop-loss level could be set above the second peak or valley.
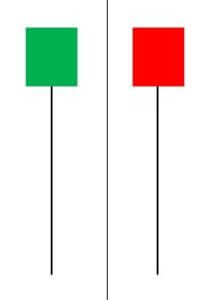
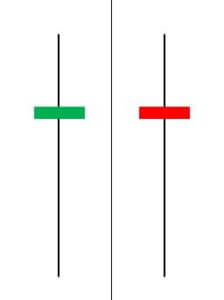
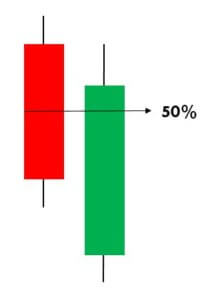
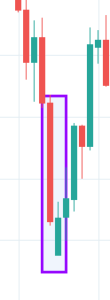
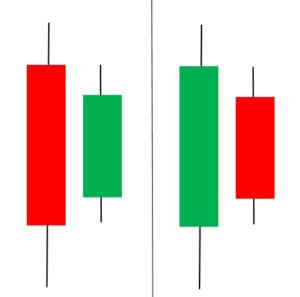
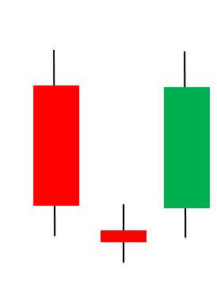
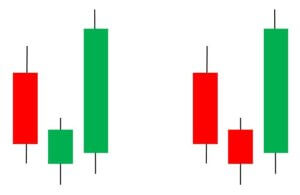
Key-Reversal Day

The key-reversal formation requires that the price action moves in a volatile trading session triggered by high impact news, leading to an extreme euphoric or panicked sentiment on investors. 

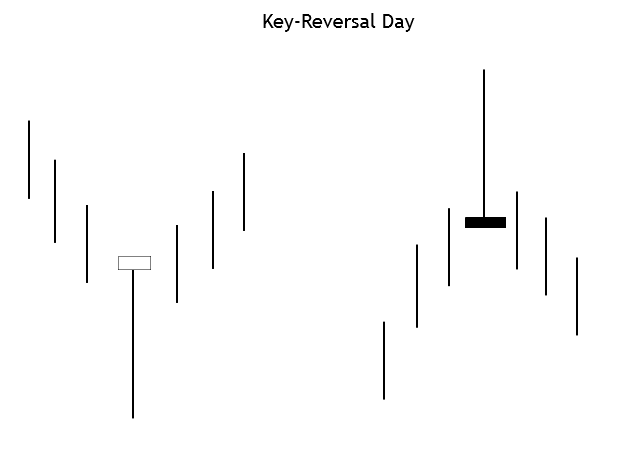
These movements could also cause the market to develop false moves, especially when the price moves in an extreme zone. This pattern could be combined with one of the previous formations reviewed previously.

Conclusions

Chart patterns are technical configurations, which, based on its internal structure, provides a clue of the likely market’s next movement. In this context, there are two main groups of chart patterns: reversal and continuation formations.

In this educational article, we reviewed five trend-reversal patterns that can be the basis of a trading strategy that, hopefully, triggers its entries in the early stages of a new trend. Moreover, the chart analyst should consider that each entry setup must have a stop-loss and a profit target identified before jumping into the market.

In the next article, we’ll present continuation chart patterns that can help enter the market when the price moves in a prolongued trend.

Suggested Readings

  • Fischer, R., Fischer J.; Candlesticks, Fibonacci, and Chart Patterns Trading Tools; John Wiley & Sons; 1st Edition (2003).
Categories
Forex Course

121. Trading The Bullish & Bearish AB=CD Harmonic Pattern

Introduction

The ABCD is one of the most straightforward patterns in the Harmonic lot. There are two types of ABCD patterns – Bullish AB=CD & Bearish AB=CD. For both the bearish and bullish versions, the AB and CD lines are the legs, whereas the BC line is considered the Retracement or correction. To confirm the formation of this pattern, we use Fibonacci levels that we have discussed in the previous course lessons.

By using the Fibonacci tool on leg AB, see if the BC retracement is reaching the 0.618 level. Next, the line CD should be the extension of 1.272 Fibonacci extensions of BC. This rule applies to both bearish and bullish AB=CD patterns. We go long or short when the price action reaches the point D of the corresponding pattern formed.

How To Trade The ABCD Harmonic Pattern

Bullish ABCD Pattern

The chart that you see below represents the formation of a bullish AB=CD pattern. The CD leg of the pattern is equal to the size of the AB leg. The BC move, which is a pullback, is 61.8% retracement of the AB move. Likewise, the CD move is the 127% retracement, which confirms the formation of a bullish AB=CD pattern on the EUR/USD Forex pair.

We have entered the market at point D, and the stop-loss is placed just below the D point. As you can see, we went for smaller stops, and there is a reason behind it. If the price action goes below point D, the pattern automatically gets invalid.

There are two take-profit areas in the pair. The first one is at point C, and the second is at point A. It all depends on at what point you desire to close your position. It is always advisable to close your positions at higher targets because the end goal for us is to milk the market as much as we can.

Bearish ABCD Pattern

The below NZD/CAD Forex pair represents the formation of a bearish AB=CD pattern. The AB leg of the pattern is equal to the CD leg. Furthermore, the BC is respecting the 61.8% retracement of the AB move, and the CD move was close to 127% extension of the BC move. We have gone short at point D as the price breakout happened.

In this example, we went for deeper targets. If the momentum of the prevailing trend is strong enough, going for a new lower low will be a good idea. The key to winning in trading is to follow the rules and think according to the market situation. These Harmonic patterns require a lot of patience and effort to trade. So it is strongly recommended to master this pattern in a demo account than to trade it in a live market.

Conclusion

The AB=CD is a reversal pattern that indicates the market trend reversal. The AB=CD pattern consists of three legs, and they form the zig-zag shape. This pattern is also known as a lightning bolt, as it looks like one. The AB=CD pattern can be used in any financial market and also in any trading timeframe. Follow the rules, no matter what, to make consistent profits from this pattern. Always execute your trade at point D and ride for the brand new higher high/lower low. Cheers.

[wp_quiz id=”76393″]
Categories
Forex Course

117. How to Trade the ‘Head and Shoulders’ Forex Chart Pattern?

Introduction

The Head and Shoulders formation is a popular Forex chart pattern, which is pretty easy to recognize on the price charts. There are both bullish and bearish Head and Shoulders patterns, and both indicate potential market reversals. This pattern consists of three peaks, which is developed after a strong bullish trend. The first and third peaks are of the same height, and they are classified as shoulders. The second peak of the pattern is the highest and hence classified as the head.

There are both bullish and bearish Head and Shoulder patterns. The appearance of bullish Head and Shoulder pattern on the price chart indicates that the momentum is transferring from the sellers to buyers. Likewise, the appearance of the Bearish Head and Shoulder pattern indicates the momentum is transferring from the buyers to sellers. While trading the Bearish Head and Shoulders pattern, it is advisable to go short when the price breaks below the neckline. Contrarily, go long when the price goes above the neckline while trading the Bullish pattern.

How To Trade The Head And Shoulders Pattern?

It is advisable not to wait for the perfect pattern instead look for the good entry/exits when you spot the pattern on the price chart. Sometimes the left shoulder will be bigger than the right shoulder and vice-versa. Please do not focus on minute details. Instead, our focus must be on deciding if the pattern looks reliable enough to trade or not. If the answer is yes, only then take entries.

Trading The Bearish Head And Shoulders Pattern

The below chart represents the formation of the Head and Shoulder pattern on the NZD/JPY forex pair.

As you can see, in the below NZD/JPY chart, the formation of the pattern doesn’t look perfect, but the overall pattern looks reliable to trade. We went short as soon as the price action broke below the neckline. The stop-loss order was placed above the second shoulder. For TP, we went double the size of the pattern. We had exited the market when the price got consolidated, as it implies the opposite party is gaining strength.

Trading The Bullish Head And Shoulders Pattern

In the below chart, we have identified the Bullish Head and Shoulder pattern in the EUR/CHF Forex pair.

In a choppy downtrend, a bullish Head and Shoulder pattern is formed. When the price goes above the neckline, it is an indication for us to go long. The take-profit is again placed two times the size of the pattern, and the stop-loss is just below the second shoulder.

In the above chart, we can clearly see that the Bullish Head and Shoulder pattern is not perfect, like the ones we see in textbooks. But still, our trade worked beautifully. So it is crucial to bends our rules here and there; we will hardly find such kind of perfect patterns. If we just wait for them, we will hardly get to trade. Also, once you gain some experience in trading this pattern, you will automatically be able to decide which pattern works and which will not. Mastering any pattern requires tons of practice and patience.

That’s about identifying and trading the Head and Shoulders pattern. Advanced strategies related to this pattern can be found in our trading strategies section. Please feel free to explore. Cheers!

[wp_quiz id=”73064″]
Categories
Forex Course

113. Introduction To Forex Chart Patterns

Introduction

We have learned a lot of concepts related to technical analysis in the past few course lessons. Starting from Moving Averages, we have extended our discussion to Fibonacci Trading, Candlestick Patterns, and Indicator based analysis. We have also gone through some of the advanced technical trading concepts like Pivot Trading and Elliot Wave Theory.

We hope you have understood these concepts and started to apply them in a demo account. If you have any queries, please post them in the respective lesson comments so that we can address them in the right place. However, this is not the end of the technical analysis basics. We must go through one most crucial concept before going further. And that is to learn the trading of Forex Chart Patterns.

What are Forex Chart Patterns?

Do not mistake these Forex chart patterns with the Candlestick Patterns that we have learned before. Two or more candlesticks form candlestick patterns. And the maximum number of candlesticks in a single candlestick pattern is not more than four. But when it comes to Forex Chart Patterns, there are more candlesticks involved. The number can range from 50 to 500 and beyond.

To explain in simple terms, we know the price action moves in three different stages – Trends, Channels, and Ranges. When moving in these stages, the candlesticks follow specific patterns at times. Primarily, these patterns are formed by a group of candlesticks, and they look similar to the shapes that we see in real life. For instance, below is the snapshot of one of the very well known Forex chart patterns known as Cup & Handle Pattern.

(Image Taken From – Forex Academy)

In the above image, we can see how candlesticks combined to form a Cup & Handle Pattern.

Why is it important to know them?

We can consider these Forex Chart Patterns as land mine detectors. Because, when mastered, we will be able to detect the market explosions before even they occur. Hence any technical trader needs to learn to identify and trade these chart patterns. Forex chart patterns are given the highest importance because of one simple reason – high probability performing trades.

For technical analysts and price action traders, these chart patterns offer reliable clues to make their moves in the direction in which the price might go in the future. The reason behind this is that these patterns have the potential to push the price in a specific direction. There is a logical reason behind the formation of every single chart pattern, and why the price will go in a particular direction after the formation of these patterns.

Types of Forex Chart Patterns

Just like what we have learned in the Candlestick pattern lessons, there are three different types of Forex Chart Patterns.

Continuation Patterns – The appearance of these patterns indicates that the underlying trend will continue, and the price will continue moving in the direction that it is currently moving.

Examples – Pennant Chart Pattern and Rectangular Chart Pattern

Reversal Patterns – If we have identified these kinds of patterns on the price chart, it is an indication that the market is about to reverse its direction. Hence the name – Reversal Patterns.

Examples – Wedge Pattern, Head & Sholders Pattern, and Double Tops & Bottoms.

Neutral Patterns – These patterns are termed neutral because the price can move in either of the directions after the formation of these patterns. So we must be careful while trading these kinds of patterns.

Example – Symmetric Triangle Pattern

We will be covering a combination of these in the upcoming articles so you will get a holistic knowledge of trading Forex patterns. Stay Tuned!

Categories
Forex Course

65. Combining Fibonacci Levels With Candlestick Patterns

Introduction

In the previous lessons, we understood how Fibonacci levels could be combined with trendlines to generate confirmation signals. After discussing many applications of the Fibonacci indicator, we are now ready to explore some complex strategies using these levels. In this lesson, we will be discussing how the Fibonacci levels can be used with Japanese candlestick patterns.

The candlestick patterns are an intrinsic part of trading, and we cannot ignore them. We have learned many candlestick patterns in the previous lessons, and you can find them starting from here. We have also learned that these patterns can not be used stand-alone, and we should be using any reliable indicators to confirm the signals generated by these patterns. So we will be using Fibonacci retracements to confirm the opportunities generated by the chart patterns.

For the explanation purpose, let’s discuss one of the most reliable candlestick patterns – Dark Cloud Cover. To know more about this pattern, you can refer to the second part of this article. We will be trading the market today by combining both Fibonacci levels and the Dark Cloud Cover pattern.

Strategy – Dark Cloud Cover Pattern + Fibonacci Levels 

For explaining the strategy, we considered a downtrend, on which we will be plotting our Fibonacci indicator and later evaluate its retracement. The below chart shows the same with a trading region in which we will be identifying our swing high and swing low. We will also see if the retracement shown in the chart is going to react at the important Fib levels.

In the below chart, we can see the market has moved down quite swiftly from the swing high to swing low. This shows the strength of the underlying downtrend. Trading a retracement of a strong and big move on any side is always preferable. The next step is to plot the Fibonacci levels on the chart.

After the Fibonacci indicator is rightly plotted as shown in the below chart, let’s see what happens at the important Fibonacci levels, such as 50% or 61.8% level. In the chart below, we see that the last Red candle of the retracement exactly touches the 50% level and closes midway of the previous Green candle.

These two candles together remind us of one of the very well known candlestick patterns – The Dark Cloud Cover. More importantly, this pattern is formed exactly at the 50% Fib level. So if we get a confirmation to the downside, it could result in a perfect setup to go short on this pair.

In the above picture, we can clearly see the formation of a bearish confirmation candle. So we can confidently take short positions in the market by placing a stop-loss near the 61.8% level with a target below the recent low.

The above chart shows how the trade works in our favor by hitting our pre-determined ‘take profit.’ We can see that, right after the entry was made, the market moves so fast in the direction of the trend producing continuous red candles. This shows the accuracy of candlestick patterns when combined with indicators like Fibonacci. Since the market is still in a strong downtrend, aggressive traders can take profit at the second or third swing low of the trend, after crossing the initial ‘take-profit.

Conclusion

From the previous articles, we have seen how the Fibonacci tool can be used with support resistance levels, trendlines, and now even candlestick patterns. By this, we can be assured that the Fibonacci tool is potent and should never be underestimated. Instead, we recommend you to widen its usage in technical analysis to identify more accurate trading opportunities.

[wp_quiz id=”64541″]
Categories
Forex Course

58. Exploring More Candlestick Patterns – Cheat Sheet!

Introduction

In the previous lessons, we have discussed many candlestick patterns out of which some were single, some were multi-candlestick patterns (Dual & Triple). But there are many more patterns that one needs to be aware of. Since it is not possible to cover each and every one of them, we have picked some of the most profitable and important patterns everyone should be aware of. So, this article basically acts as a cheat sheet for any reference. By referring to this guide, one can get the basic price-action structure of all these important patterns that are mentioned below.

Hammer Candlestick Pattern

It is a single candlestick pattern signaling a possible reversal to the upside. The Hammer is mostly seen after a prolonged downtrend. On the day this pattern is formed, the market will be inclined towards the sell-side. As the candle comes to a close, the market recovers and closes near the unchanged mark or maybe a bit higher.


That is a clear indication of the market reversal. We must take trades only after the appearance of a confirmation candle and not before. So we see a bullish candle on the charts immediately after the Hammer pattern, consider buying the currency pair.

Doji Candlestick Pattern

This pattern is formed from a single candle and is considered a neutral pattern. A Doji represents the equilibrium between demand and supply. The appearance of this pattern indicates a tug of war in which neither the bulls nor the bears are winning.


In the case of an uptrend, the bulls will be winning the battle, and the price goes higher, but after the appearance of Doji, the strength of the bulls is in doubt. The opposite is true in case of a downtrend. If we come across this pattern, we must wait for extra confirmation to take any action.

Piercing Candlestick Pattern

The Piercing Pattern is a two candle reversal pattern that implies a possible reversal from downtrend to an uptrend. This pattern is typically seen at the end of a downtrend. The second candle in the pattern must be bullish and should open below the low of the previous day and closing more than halfway into the previous day’s bearish candle.


We generally will have two options after noticing this pattern. Either we can buy the forex pair to benefit from the uptrend that is about to begin, or we can look at buying ‘options’ to reduce risk.

Engulfing Candlestick Pattern

It is two candle reversal pattern that is formed at the end of a downtrend or an uptrend. Bullish Engulfing Pattern is formed when a small ‘Red’ candlestick is followed by a large ‘Green’ candlestick that completely engulfs the previous day’s candle. For a Bearish Engulfing Pattern, the situation is vice-versa.


The shadows of the small candle should be preferably short, and the body of the large candle should overpower the entire previous day’s candle. When we come across a Bearish candlestick pattern, we must activate our sell trades and vice-versa.

Meeting Line Candlestick Pattern

This pattern is a two candle reversal pattern that occurs in a downtrend. The first candle must be a bearish candle followed by a second long bullish candle that gaps down and closes higher. It has the close at the same level as the close of the first candle.


This pattern only signals partial bullishness and buying strength, but not completely. Traders must look for other signs of reversal than just relying on the pattern stand-alone because just the Meeting Line pattern is not a clear confirmation for a complete reversal of the trend.

Harami Candlestick Pattern

It is a dual candlestick reversal pattern indicating the reversal of a bullish or bearish trend. In Bullish Harami pattern, the first candle is usually a Red candle with a large real body, and the second one is a small Green Candle. It’s opposite in the case of a bearish Harami pattern.        

Traders must look at the appearance of a bullish Harami pattern as a good sign of taking long positions in the market. Likewise, we must be shorting once we confirm the appearance of the bearish Harami Pattern.

Three Black Crows Candlestick Pattern

This pattern consists of three Red candles and predicts the reversal of an uptrend. It does not occur very frequently, but when it occurs, we can be sure that the market is going to reverse.


The first candle in this pattern is a long bearish candle that appears in a prevailing uptrend. The second and third are also approximately the same size and color, indicating that bears are firmly in control. This pattern is most useful for long-term traders, who take short positions and hold them for several weeks.

Abandoned Baby Candlestick Pattern

It is a three candle reversal pattern that occurs during a downtrend. The first candle in this pattern is a bearish one. The second candle is a Doji, which gaps down from the previous candle. The third candle is a long bullish candle and opens above the second candle.


We must take long positions only if the price breaks above the third bar in this pattern. Also, make sure to use a stop-limit order for additional risk management.

Deliberation Candlestick Pattern

The Deliberation is a three-line bearish reversal candlestick pattern that occurs during an uptrend. This pattern is comprised of three bullish candles. The first and second candles have significantly large bodies than the third one.


This pattern signals a bearish reversal of the current uptrend. The confirmation is usually a Red candle that overcomes the midpoint of the second candle’s body. We can take aggressive short positions in the currency pair right after we notice the confirmatory candle. This pattern is rarely seen on the price charts, but it does appear, it is highly rewarding.

Three Line Strike Candlestick Pattern

We have discussed single, dual, and triple candlestick patterns till now. Three Line Strike is the first four candlestick pattern, which signals the continuation of the current trend. This pattern can be found in both bullish and bearish markets, depending on the trend.

In an uptrend, the first, second, and third are bullish, and each candle needs to close above the previous candle. The fourth candle is bearish and closes below the open of the first candle. We can take long positions only after the trend is confirmed by technical indicators like RSI & MACD

Learning to recognize and interpret candlestick patterns is important for anyone who aspires to be a professional technical trader. Perfecting this skill will take time and practice. But once you master these patterns, you can trade with enough confidence as you will know how to read the market better.

That’s about candlestick patterns and how to trade them. In the upcoming lesson, we will see how to trade candlesticks using support and resistance levels. We hope you practice these patterns better and become a better trade. Kindly let us know if you have any questions in the comments below. Cheers.

[wp_quiz id=”61830″]
Categories
Forex Course

57. Trading Triple Candlestick Patterns – Part 2 (Reversal)

Introduction

We have discussed some of the major triple candlestick continuous patterns in the previous articles. In this lesson, let’s talk about the triple candlestick reversal patterns. Morning Star and Three Inside Up patterns are very well known as they provide some of the most profitable signals. Let’s get right into the topic.

Morning Star Candlestick Pattern

Morning Star is a bullish candlestick pattern consisting of three candles and is interpreted as a bull force. The pattern is formed following a downtrend and indicates the start of an uptrend, which is a complete reversal. After an occurrence of the Morning Star, traders seek reversal confirmation through additional technical indicators. The RSI is one such indicator which tells that the market has gone into an oversold condition and that a reversal can happen anytime.

Below is how a Morning Star Pattern looks like on a price chart

Criteria for the Morning Star pattern

  1. The first candle is a long bearish candle with little or no wicks.
  2. The second candle is a smaller bullish or bearish candle that captures the indecision state of the market, where the sellers start to lose control.
  3. The third and last candle is a long bullish candle that confirms the reversal and marks a new uptrend.

A trader must lookout for a bullish position in the Forex pair once they identify the Morning Star pattern on the charts. Another important factor for traders to consider is to pair this pattern with a volume indicator for additional confirmation.

Three Inside Up Candlestick Pattern

The Three Inside Up is also a triple candlestick reversal pattern. This pattern indicates the signs of the current trend losing momentum, and warns the market movement in the opposite direction. It is a bullish pattern that is composed of large bearish candle, a smaller candle contained within the previous candle, and then a bullish candle that closes above the second candle.

Below is the picture of how the Three Inside Up pattern would appear on a chart.

Criteria for the pattern

  1. The market should be in a downtrend with a large bearish first candle.
  2. The second candle should open and close within the real body of the first candle, which shows that sellers have stopped selling further.
  3. The third candle is a bullish candle that closes above the second candle, trapping all the short-sellers and attracting the bulls.

Traders must take long positions at the end of the third candle or on the following green candle, which provides additional confirmation. This pattern is not always reliable when used stand-alone. So there are chances that the trend could reverse once again quickly. So risk management should be in place before taking any trades. A stop-loss must be placed below the second candle, and it depends on how much risk the trader is willing to take.

Conclusion

The opposite of the Morning Star candlestick pattern is the Evening star. Even this is a reversal pattern, but it signals a reversal of an uptrend into a downtrend. Likewise, the opposite of the Three Inside Up pattern is the Three Inside Down pattern, which reverses an uptrend. Learn about more triple candlestick patterns and how to trade them. The more you research, the better trader you will be. Cheers.

[wp_quiz id=”61446″]
Categories
Forex Course

53. Trading The Single Candlestick Patterns – Part 2

Introduction

In the previous lesson, we discussed some basic single candlestick patterns, which gave us trend continuation signals. In this lesson, we will look at reversal patterns that are formed by a single candlestick and how traders should perceive them.

These patterns are very important to learn as they indicate clear market reversals. So essentially, when we find these patterns on the charts, we should anticipate a reversal and take our trades accordingly.

The Hanging Man Candlestick Pattern

A Hanging Man is a single candlestick pattern that occurs during an uptrend. They give warning signals that markets are going to fall. This candlestick pattern is composed of a small body, a long lower shadow, and no upper shadow. Since it is a reversal pattern that reverses the current uptrend, The Hanging Man indicates the selling pressure that is starting to increase. Below is how the Hanging Man candlestick would look like.

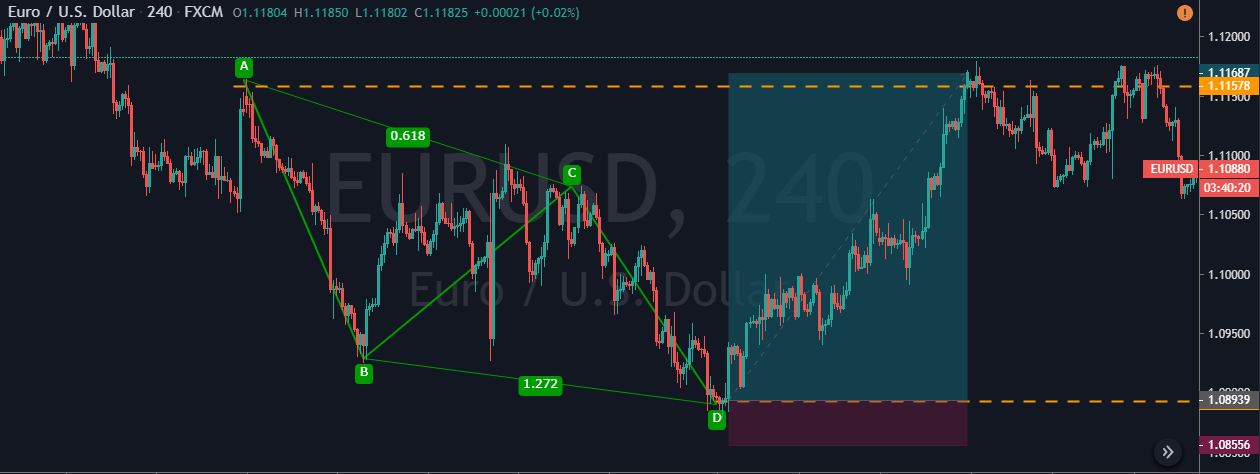
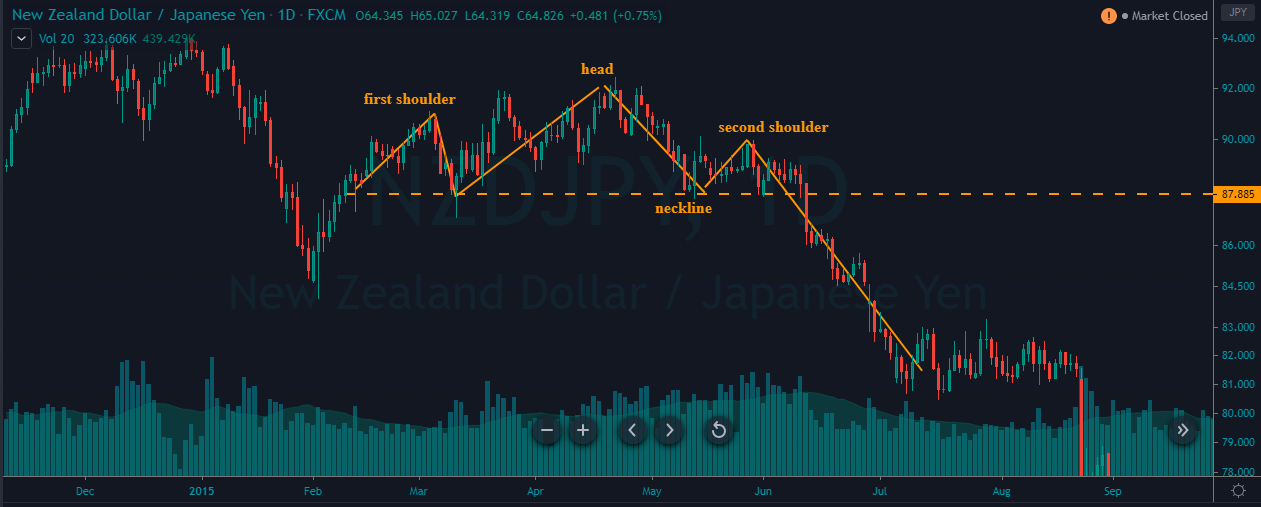
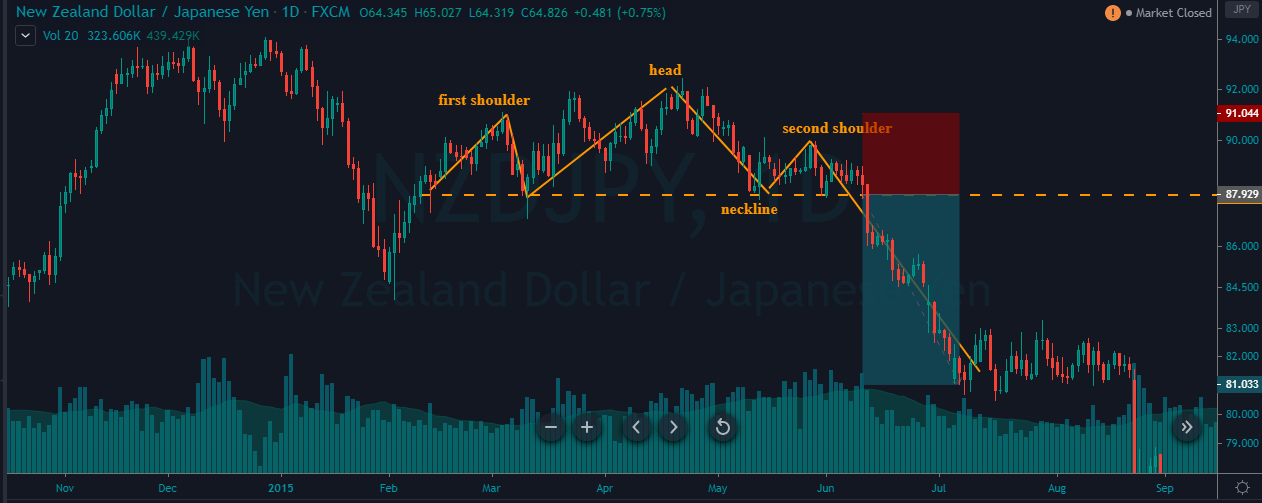
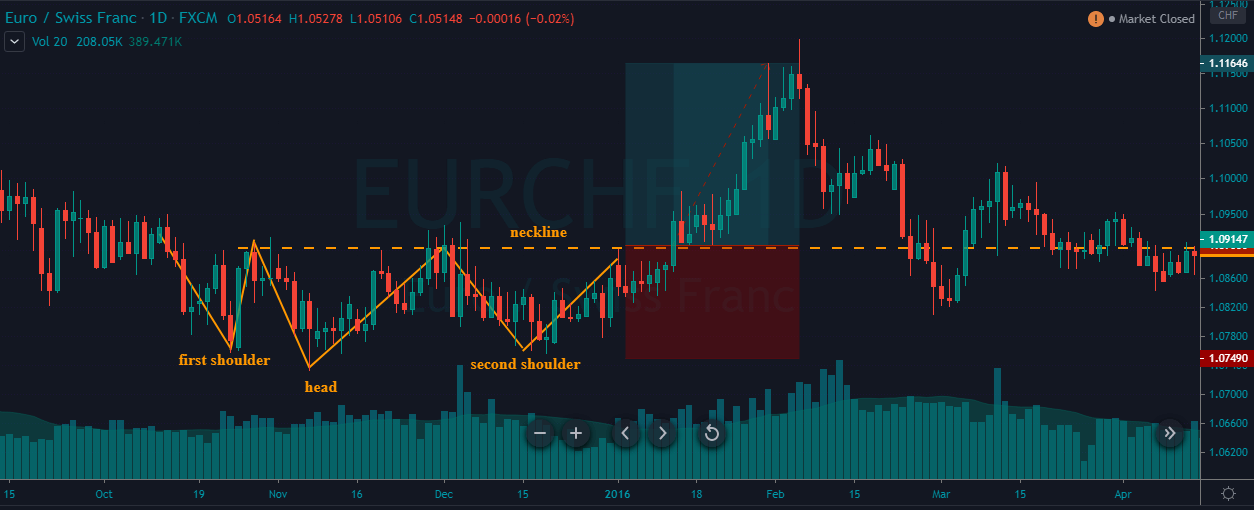
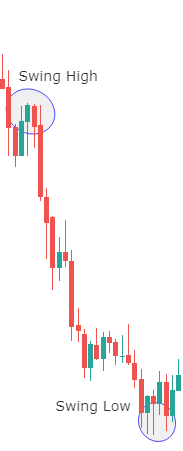
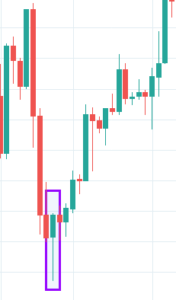
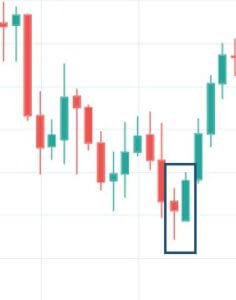
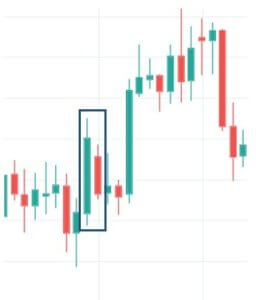
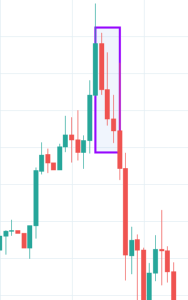
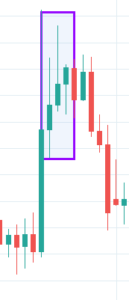
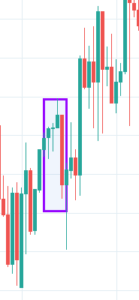
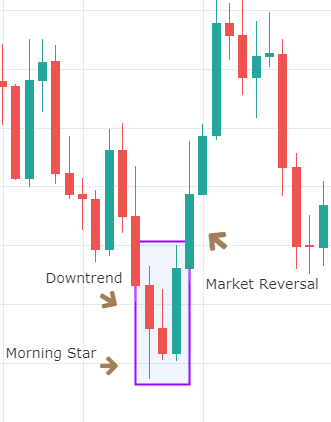
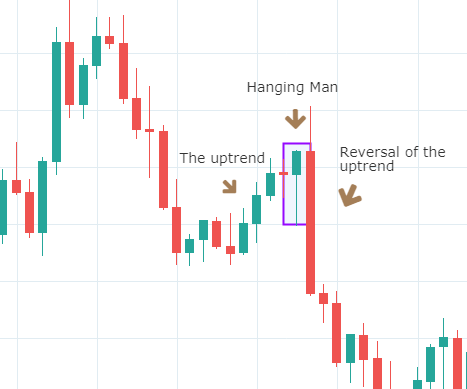
Below is a picture of how this pattern would like on the chart and how the trend reversal takes place.
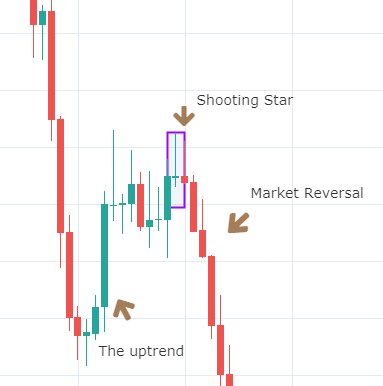
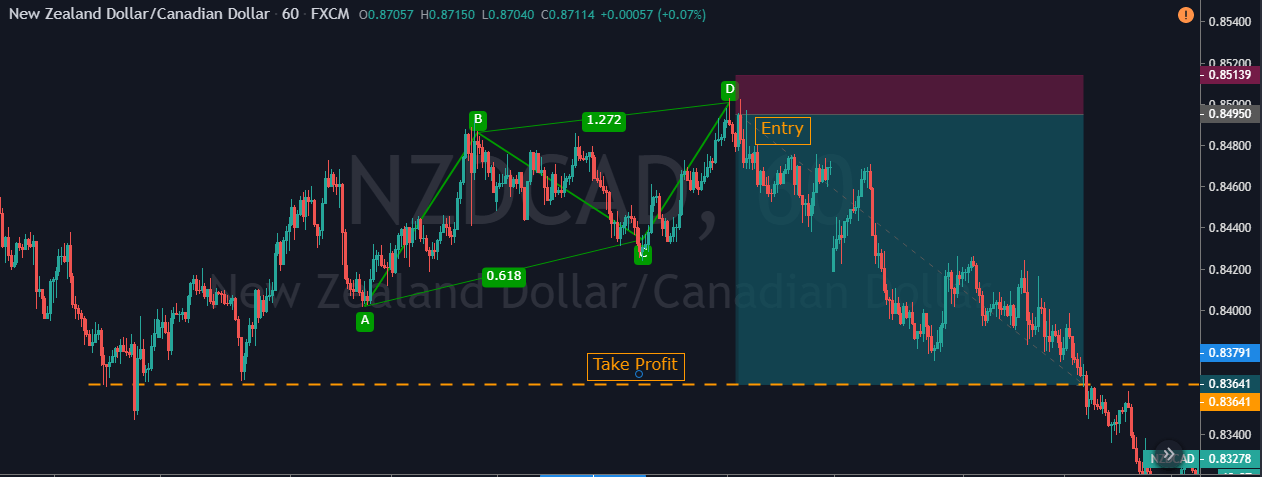
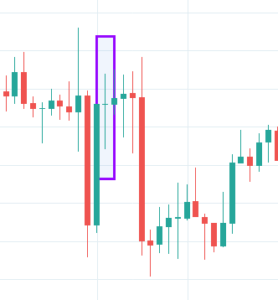
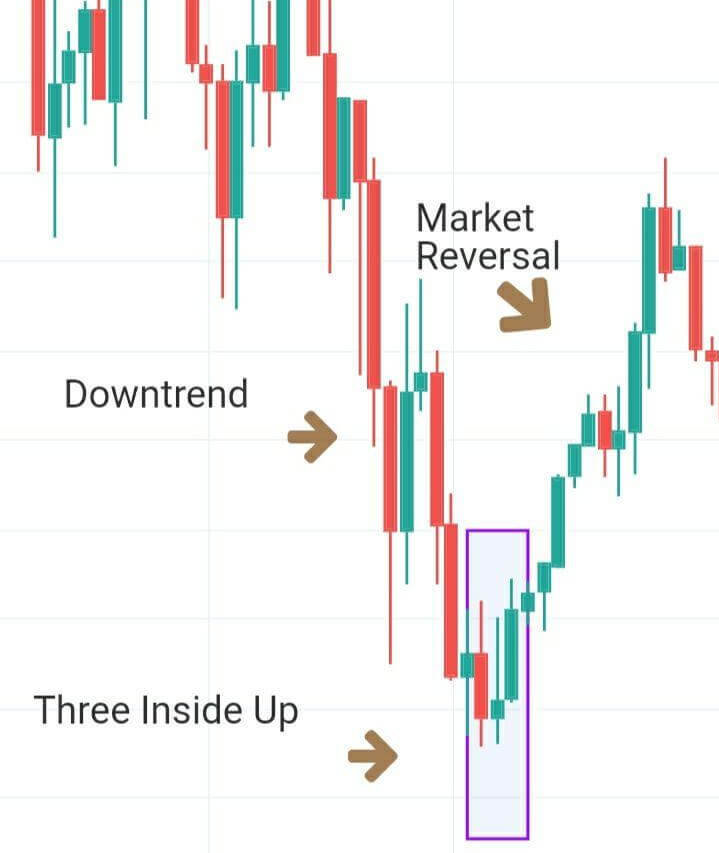
Pattern Confirmation Criteria

  • Hanging Man is a single candlestick pattern that forms after a small rally in the price. The price rally can also be big, but it should at least be composed of few candles moving higher overall.
  • The candle must have a small body and a lower shadow at least twice the size of the real body.
  • This pattern is only a warning and a bearish candle after the formation of this pattern is highly desired. This is necessary for the Hanging Man pattern to prove to be a valid reversal. This is called confirmation.

The Hanging Man pattern is used by traders to exit long positions or enter into new short positions. After entering for a short position, stop loss can be placed above the high of the Hanging Man candle.

The Shooting Star Candlestick Pattern 

A Shooting Star is a bearish single candlestick pattern which also indicates a market reversal. It has a long upper shadow with little or no lower shadow and a small body.

This pattern typically occurs after an uptrend and forms near the lowest price of the day. The Shooting Star pattern can be seen as the market creating potential resistance around the price range. It implies that the sellers stepped in, erasing all the gains, and pushed the price near the open. Basically, at the appearance of this pattern, buyers are losing control, and sellers are taking over.

Below is a picture of how the pattern would look like on a chart

Pattern Confirmation Criteria

  • The pattern must appear after an advance in price. The price must rally in at least alternate green and red candles if not in all green candles.
  • The distance between the highest price of the candle and the opening price must be twice the length of the body of the candle.
  • It is best if there is no shadow below the body of the candle.

Traders should not take immediate action after the formation of this pattern. They should wait to see what the next candle does following the Shooting Star. If they see a further price decline, they may sell or short that currency pair. However, if the price continues to rise, it means the uptrend is still intact. So traders must favor long positions over shorting.

The difference between the Hanging Man and the Shooting Star is in the length of upper and lower shadows along with the context. By now, we have understood how continuous and reversal single candlestick patterns work. In the upcoming lessons, we will be learning dual candlestick patterns and their implication. Cheers!

[wp_quiz id=”60770″]