Introduction
The basic premise of technical analysis is to identify the dominant trend in the financial market and make money trading in its direction. Likewise, when the trend changes, the market analyst should recognize that the previous trend has ended and that it is time to join the new trend.
In this context, the chart pattern analysis offers a wide range of technical formations that reveals the reversion or continuation of a trend. These formations repeat themselves again and again in financial markets.
This educational article will review a set of chart patterns of reversal and continuation of the trend.
Reversal Chart Patterns
Reversal patterns tend to appear after a prolonged uptrend or downtrend and is usually accompanied by higher volatility. Likewise, the size of the chart formation is indicative of the future movement, as the next move usually experiences advances or declines of similar proportions.
Double Top and Bottom
The double top and bottom is the most common reversal formation that appears in a chart. The following figure illustrates a double top and a double bottom formation.
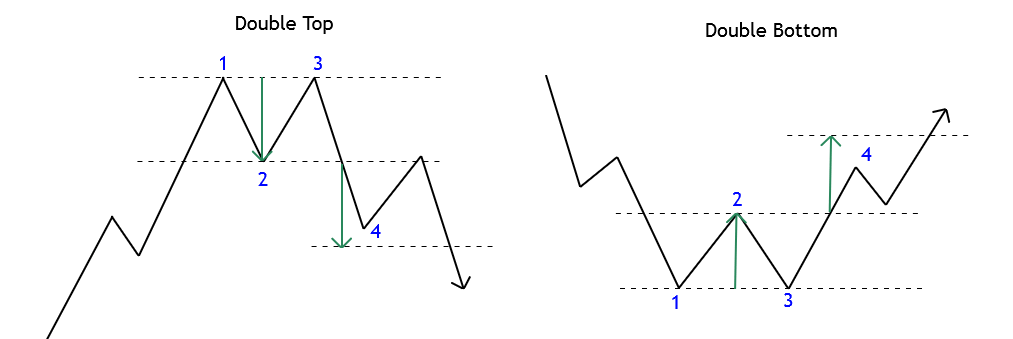
In a double top, the price reaches a determined top level twice, and it will be confirmed once the price breaks and closes below the valley between the two highs. In the double bottom case, the price moves up, then retraces but cannot break through the previous support level. The pattern is confirmed once the price rises and closes above the minor top between the two lows.
The profit target of this structure can be set to a distance similar to the range between the top and the valley that conforms to the double top/bottom pattern. The invalidation level is located above (or below) the top (or bottom) of the reversal formation.
Triple Top and Bottom
The triple top and bottom formation arise from the same market factors of a double pattern, the next figure shows the setup of this formation. The stop-loss and profit target calculations are similar to those of a double top/bottom pattern.

In technical terms, the triple top and bottom pattern will be completed when the price action advances a distance similar to the range between the top and the valley that conforms to the triple pattern.
Head and Shoulder Pattern
The head and shoulder pattern is by far the best-known formation warning of the end of a trend. This reversal pattern looks similar to the triple top and bottom structure. The second high (identified as 3 in the following figure) is higher than the tops preceding and following the central high.
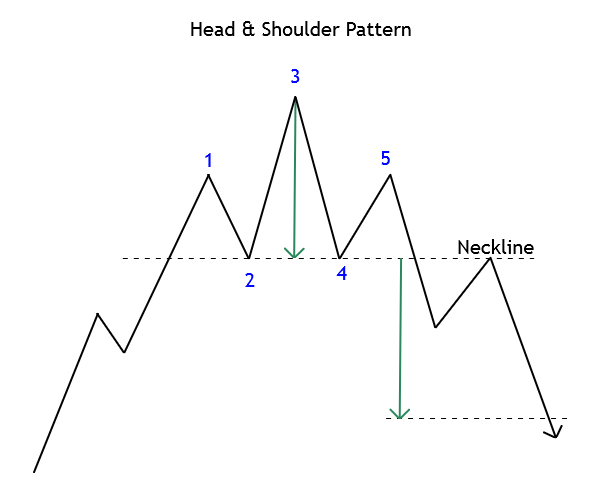
The formation is said to be completed once the price breaks and closes below the neckline. The target will correspond to the length between the head and the neckline when projected from the neckline. A possible choice for the stop-loss level is to place it above the second shoulder (5). An alternative to this placement is to put it above the top level of the head (3).
Three Falling Peaks or Three Rising Valleys
The three falling peaks or rising valleys are seldom spotted, although its technical structure is clear. The following figure illustrates both cases.
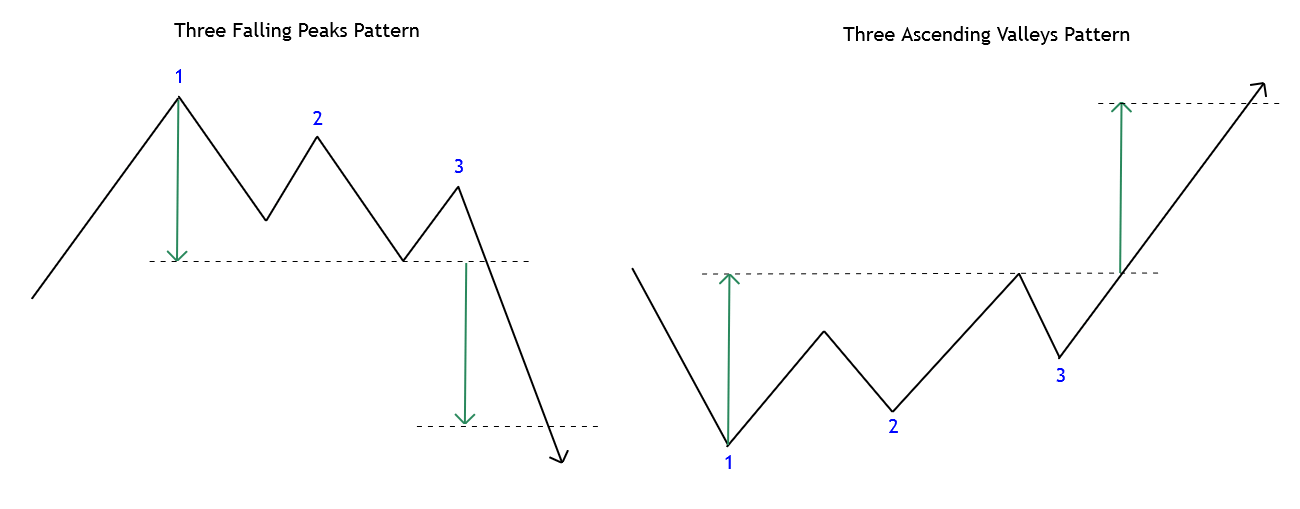
The three falling peaks will generate a sell-side position if the price breaks and closes below the second valley. In the three rising valleys case, a buy-side position will be activated if the price climbs and closes above the second peak.
A potential zone of profit target would correspond to the length from the top (or bottom) to the second valley (or peak) and projected from the breakout zone. The stop-loss level could be set above the second peak or valley.
Key-Reversal Day
The key-reversal formation requires that the price action moves in a volatile trading session triggered by high impact news, leading to an extreme euphoric or panicked sentiment on investors.
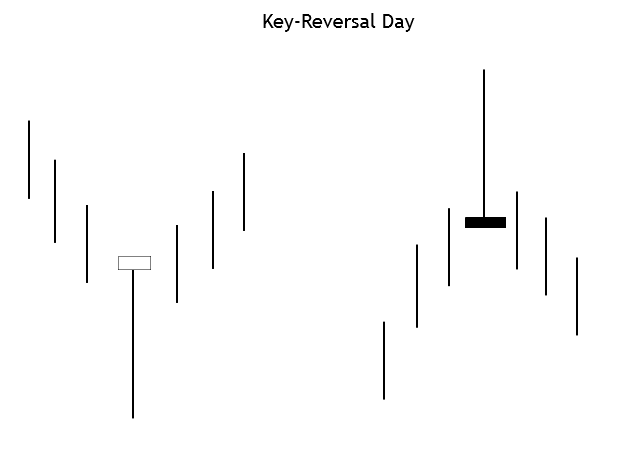
These movements could also cause the market to develop false moves, especially when the price moves in an extreme zone. This pattern could be combined with one of the previous formations reviewed previously.
Conclusions
Chart patterns are technical configurations, which, based on its internal structure, provides a clue of the likely market’s next movement. In this context, there are two main groups of chart patterns: reversal and continuation formations.
In this educational article, we reviewed five trend-reversal patterns that can be the basis of a trading strategy that, hopefully, triggers its entries in the early stages of a new trend. Moreover, the chart analyst should consider that each entry setup must have a stop-loss and a profit target identified before jumping into the market.
In the next article, we’ll present continuation chart patterns that can help enter the market when the price moves in a prolongued trend.
Suggested Readings
- Fischer, R., Fischer J.; Candlesticks, Fibonacci, and Chart Patterns Trading Tools; John Wiley & Sons; 1st Edition (2003).


