Description
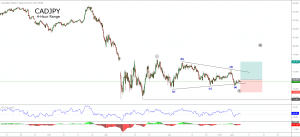
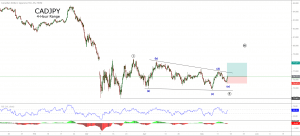
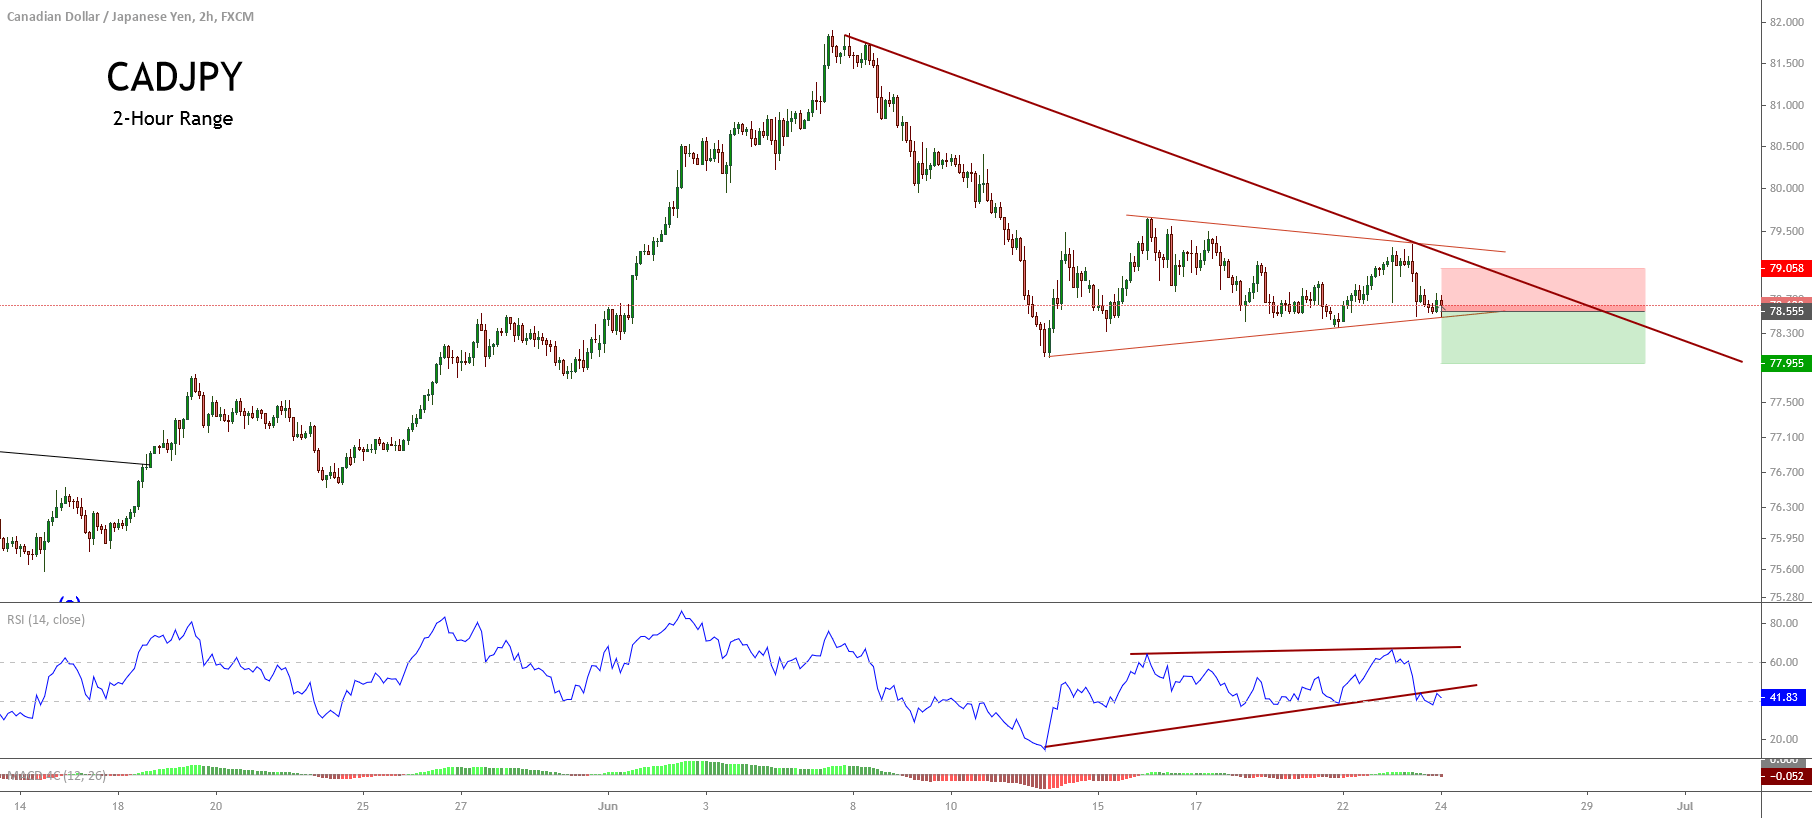
The CADJPY cross in its 2-hour chart moves in a mid-term sideways structure identified as a contracting triangle pattern. The technical formation suggests the bearish continuation of the bearish sequence started on June 05th, when the price topped at 81.905.

Both the bearish trendline as the RSI oscillator confirms that the bearish trend remains intact. In this context, the RSI reveals a breakdown that suggests the possibility of a bearish movement. At the same time, the re-test of the base-line of the contracting triangle leads us to expect a new decline in the CADJPY cross.
An intraday bearish movement could drag the price from the current zone until the consolidation zone developed on May 29th at 77.955. The invalidation level of our bearish scenario locates at 79.058.
Chart
Trading Plan Summary
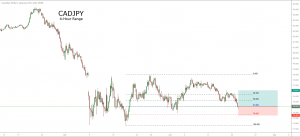
- Entry Level: 78.555
- Protective Stop: 79.055
- Profit Target: 77.955
- Risk/Reward Ratio: 1.19
- Position Size: 0.01 lot per $1,000 in trading account.