The Setup
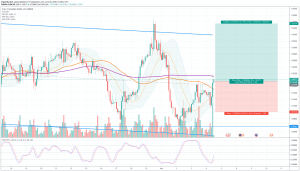
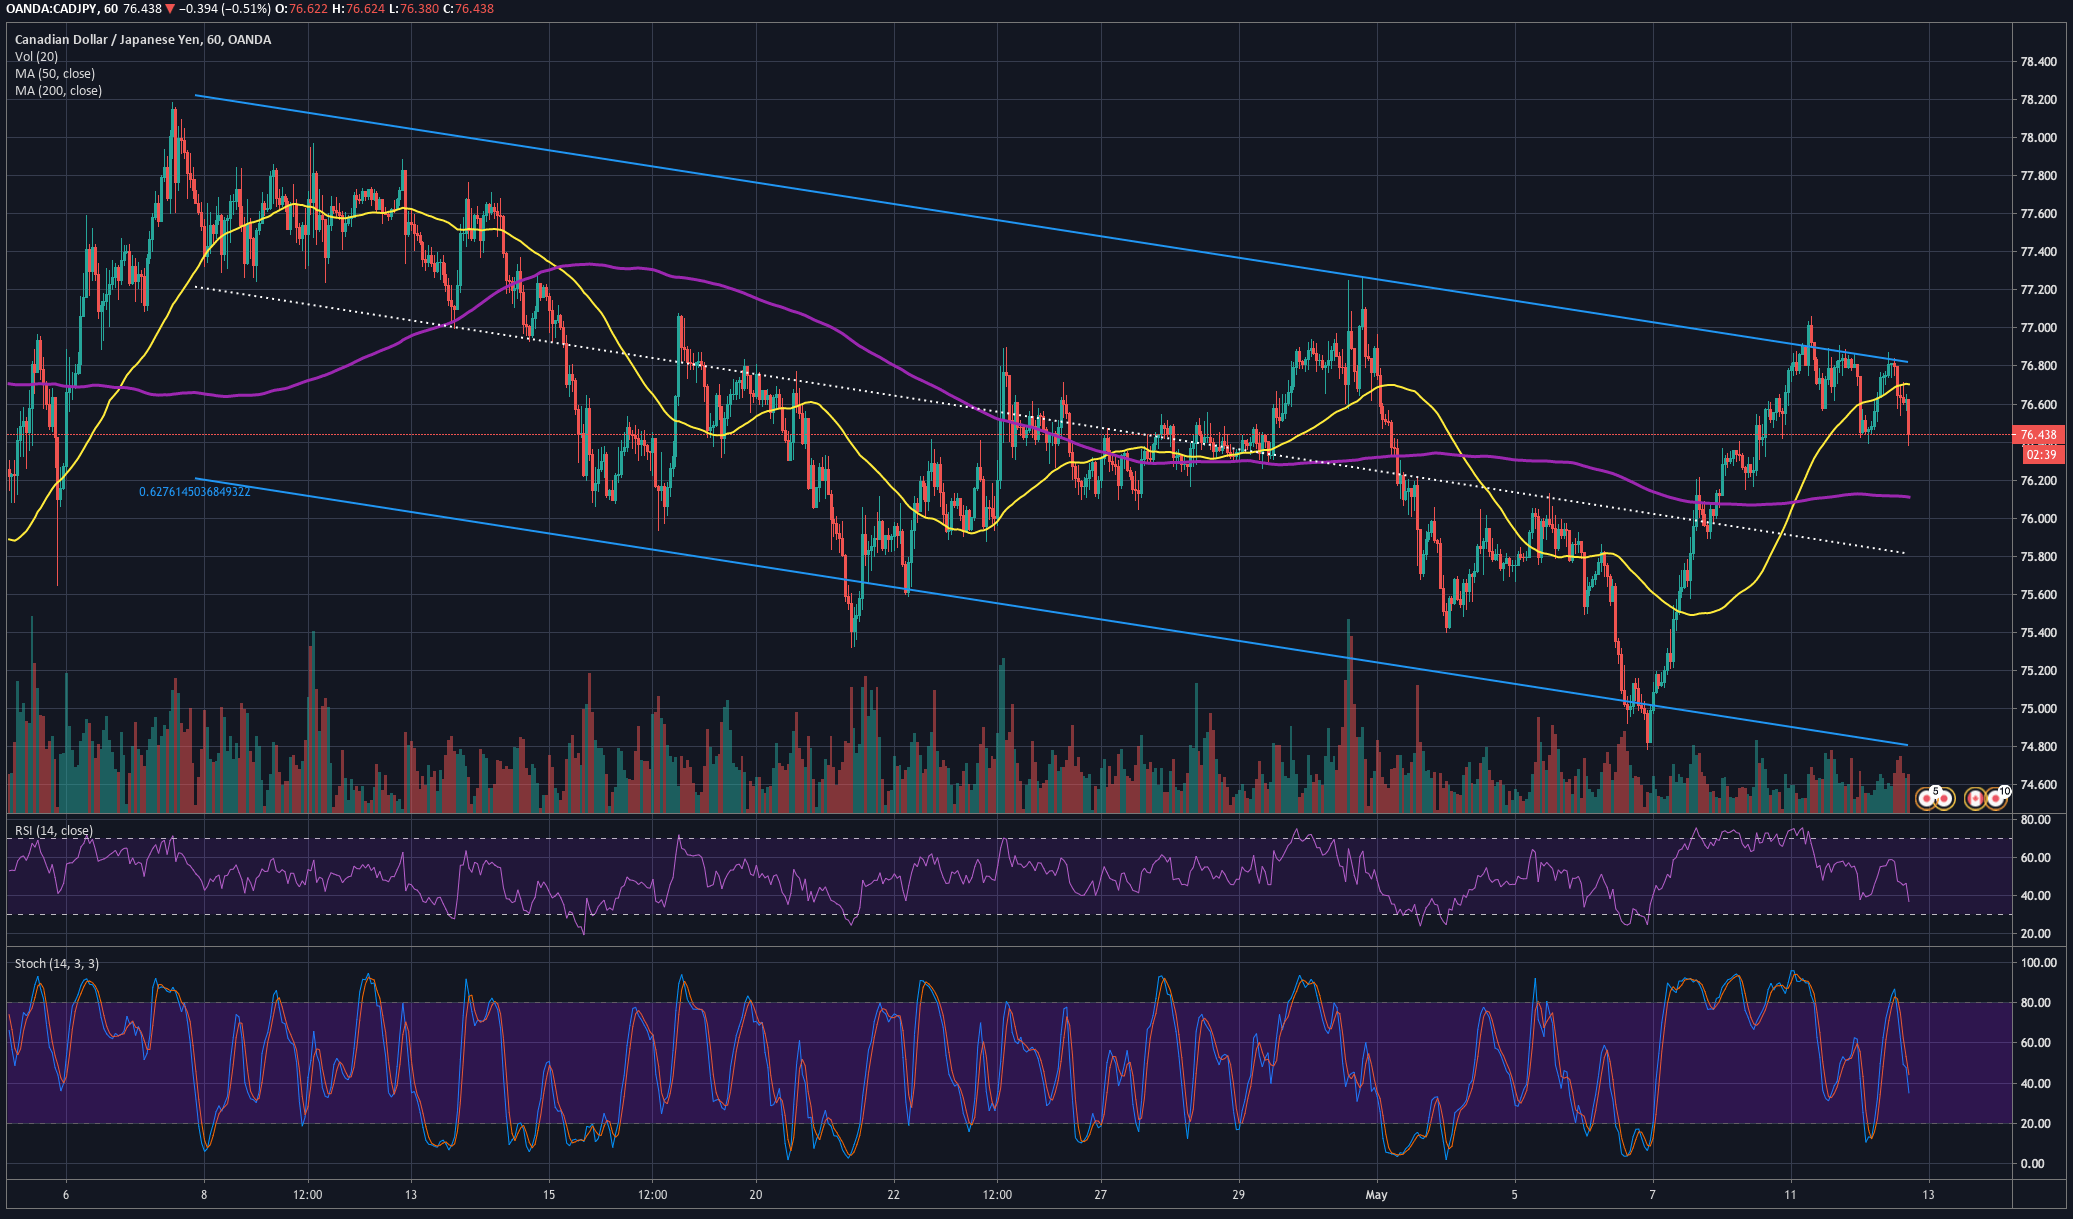
Fig 1 – CADJPY triple bounce off the upper linear regression channel boundary

CADJPY has been obeying a slightly descending linear regression channel. On the 60 min chart, the ± 2 sigma lines are shown in blue, whereas the regression line, is shown in dotted white. In that chart, we can observe that the price has bounced three consecutive times off that line, and now, in its third bounce, it also pierced its 50-hour SMA to the downside.
A trade can be created with an entry at the current price and a target neat the bottom of the channel, for an excellent reward to risk factor. The rationale for this type of trade is the following. On channels like that, the odds of a reversal from a 2 sigma line is high, at least 95% of the time. The issue here is the reversal is strong enough to reach our target? Usually, it is highly likely a movement to touch the mid of the channel, but, since here the channel is descending, the odds of it moving to the bottom is higher. We will follow this trade, though, and adapt our stop-loss level and take profit as we see how the bearish momentum evolves.
Key Levels
- Entry: 76.495
- Stop-Loss: 76.895
- Take-profit: 75.295
- Reward/Risk: 3
Dollar Risks and Rewards
Risk: 40 pips = $372 per lot, or $37.2 per mini lot.
Reward: 120 pips = $1,117 per lot, or 111,7 per mini lot