Categories
Forex Fundamental Analysis

GBP/CAD Global Macro Analysis – Part 3

GBP/CAD Exogenous Analysis

The UK and Canada Current Account Differential

The current account differential between the UK and Canada can determine if the GBP/CAD pair is bullish or bearish. If the differential is positive, it means that the UK has a higher current account balance than Canada. This would imply that the GBP is in higher demand in the forex market than the CAD; hence, it is a bullish trend for the pair. Conversely, if the current account differential is negative, it means that the UK has a lesser current balance than Canada. It would imply that the GBP has a lower demand than the CAD in the forex market; hence, a bearish trend for the pair.

In Q3 of 2020, the UK had a current account deficit of $20.97 billion while Canada had a $5.83 billion deficit. Thus, the current account differential is -$15.14 billion. We assign a score of -2.

The interest rate differential between the UK and Canada

The interest rate differential is the difference between the Bank of England’s interest rate and that by the Bank of Canada. In the forex market, carry traders use the interest rate differential to decide whether to buy or short a currency pair. When the interest rate differential is positive, traders will earn the differential by going long. If the differential is negative, traders can earn the differential by shorting the currency pair.

Therefore, if the GBP/CAD pair’s interest rate differential is positive, the pair is bound to adopt a bullish trend. Conversely, if negative, the pair is bound to be bearish.

In 2020, the interest rate in the UK dropped from 0.75% to 0.1%. In Canada, the BOC cut interest rates from 1.75% to 0.25%. Therefore, the interest rate differential is -0.15%. The interest rate differential between the UK and Canada has a score of -1.

The differential in GDP growth rate between the UK and Canada

This differential measures the changes in the growth rate between the two economies. It is a preferred method of comparison since economies are of different sizes. Naturally, the economy with a higher GDP growth rate will have its currency appreciate more. Therefore, if the GDP growth rate differential is positive, it means that the GBP/CAD pair is bullish. If negative, then the pair is bearish.

During the first three quarters of 2020, the UK economy has contracted by 5.8%, while the Canadian economy has contracted by 3.3%. This makes the GDP growth rate differential -2.5%. Hence, a score of -1.

Conclusion

Indicator Score Total State Comment
The UK and Canada Current Account Differential -2 10 A differential of – $15.14 The UK has a higher deficit than Canada
The interest rate differential between the UK and Canada -1 10 -0.15% Expected to remain at -0.15% until either economy have recovered
The differential in GDP growth rate between the UK and Canada -1 10 3.30% The Canadian economy contracted at a slower pace than the UK economy
TOTAL SCORE -4

The cumulative score for the exogenous factors is -4. This means that we can expect the GBP/CAD pair to trade in a downtrend in the short term.

However, technical analysis shows the pair adopting a bullish trend with the weekly chart trading above the 200-period MA. More so, the pair is seen bouncing off the lower Bollinger band. Keep an eye on the near-term changes in the exogenous factors.

Categories
Forex Fundamental Analysis

GBP/CAD Global Macro Analysis – Part 1 & 2

Introduction

This analysis will evaluate the endogenous factors that affect the domestic economy in both the UK and Canada. We’ll also cover exogenous factors that influence the price of the GBP/CAD pair.

Ranking Scale

After analysis, we will rank both the exogenous and the endogenous factors on a scale from -10 to +10.

Endogenous factors will be ranked after a correlation analysis with the GDP growth rate. If negative, it means that either the GBP or the CAD have depreciated. If positive, it means that the domestic currency has appreciated.

The exogenous factors are ranked based on their correlation with the GBP/CAD pair’s exchange rate. When negative, it means that the price will drop. The price will be expected to increase if the exogenous analysis is positive.

Summary – GBP Endogenous Analysis

-15 score on Pound’s Endogenous Analysis indicates that this currency has depreciated since the beginning of 2020.

Summary – CAD Endogenous Analysis

  • Canada Employment Rate

The Canadian employment rate measures the percentage of the labor force that is employed during a particular period. The developments in the labor market are a leading indicator of overall economic growth. When the economy is expanding, there are more job openings, hence a higher employment rate. Conversely, when the economy is going through a recession, businesses close down, leading to a dropping employment rate.

In November 2020, the employment rate in Canada rose to 59.5% from 59.4% in October. Although the employment rate has been steadily increasing from the lows of 52.1% in April, it is still lower than in January. Canada’s employment rate has a score of -6.

  • Canada Core Consumer Prices

This index measures the overall change in Canada’s inflation rate based on a survey of price changes for a basket of consumer goods. The rate of inflation gauges the increase in economic activity. Typically, when demand is depressed in an economy, prices drop, resulting in lower inflation. Conversely, when demand increases, prices tend to increase, resulting in a higher rate of inflation.

In November 2020, Canada’s core consumer prices rose to 136.6 points from 136.3 in October. Between January and November, the index has increased by 2 points. It has a score of 3.

  • Canada Manufacturing Production

This index measures the YoY change in the value of the output from the Canadian manufacturing sector. Canadian manufacturing is a significant contributor to the labor market and economic growth. In the age of the coronavirus disruption, changes in manufacturing production show how faster the economy is bouncing back.

In September 2020, the YoY manufacturing production in Canada dropped by 4.24%. This is an improvement compared to the 5.34% drop recorded in August. Canadian manufacturing production has a score of -2.

  • Canada Business Confidence

The Ivey Purchasing Managers Index (PMI) measures monthly business confidence in Canada. In the survey, private and public companies rate whether the current business activity is higher or lower than the previous month. The index survey aspects including inventories, purchases, deliveries from suppliers, output prices, and employment.

When the index is over 50, it means that purchases have increased from the preceding month. Reading of below 50 shows a decrease in purchases.

In November 2020, Canadian business confidence dropped to 52.7 from 54.5 in October. This was the lowest reading since May, when the economy began rebounding from the shocks of  COVID-19. Consequently, Canada’s business confidence has a score of 1.

  • Canada Consumer Spending

This measures the final market value of all household expenditures on goods and services. It also includes expenditure by non-profit organizations that serve households in Canada but excludes purchases of homes. Consumer spending plays a critical role in economic growth.

In Q3 of 2020, consumer spending in Canada rose to CAD 1.13 trillion from CAD 1 trillion in Q2. However, it is still lower than consumer spending recorded in Q1. Thus, Canada’s consumer spending has a score of -4.

  • Canada New Housing Price Index

The Canadian NHPI measures the changes in the selling price of newly built residential houses. The price measured is that paid by the home buyers to the contractors. Note that the price comparison is strictly between houses of the same specification. The NHPI shows the construction sector’s growth trends; hence, it corresponds to changes in the labor market and GDP growth.

In November 2020, the Canadian NHPI rose to 107.9 from 107.3 in October. Thus, we assign a score of 3.

  • Canada Government Budget Value

This indicator tracks the changes in the difference between the Canadian government revenues and expenditures. It shows whether the government is running a surplus or a deficit. It also breaks down the changes in the receipts by the government. This helps to show how the overall economy is fairing.

In October 2020, the Canadian government budget had a deficit of CAD 18.51 billion compared to CAD 27.59 billion in September. Throughout the year, the budget deficits have been due to the economic shocks brought on by the coronavirus pandemic. The Canadian government had to ramp up expenditure through its Economic Response Plan, while revenues dropped in the same period. We assign it a score of -5.

Conclusion

Indicator Score Total State Comment
Canada Employment Rate -6 10 59.5% in November 2020 The employment rate is steadily increasing. It is, however, still below January levels
Canada Core Consumer Prices 3 10 136.6 points in November 2020 Since January, it has increased by 2 points. That shows demand in the economy has kept prices higher
Canada Manufacturing Production -2 10 YoY dropped by 4.24% in September 2020 A slight increase from -5.34% recorded in August. This shows that the manufacturing production is returning to the pre-pandemic levels
Canada Business Confidence 1 10 52.7 in November November level was the lowest since the economy began to recover in May. It’s expected to improve as mass vaccinations against COVID-19 rolls out
Canada Consumer Spending -4 10 Was CAD 1.13 trillion Q3 2020 Recovered from CAD 1 trillion in Q2 but still lower than Q1. This shows that demand is increasing in the economy
Canada New Housing Price Index 3 10 November NHPI was 107.9 It has been increasing, which shows that output in the construction industry is improving
Canada Government Budget Value -5 10 a budget deficit of CAD 18.51 billion in October The deficit widened in 2020, driven by unprecedented fiscal policies to curb recessionary pressure from the pandemic
TOTAL SCORE -10

A score of -10 indicates that the CAD has depreciated since the beginning of the year 2020.

In the next article, you can find the exogenous analysis of GBP/CAD where we have forecasted this pair’s future price movements. Cheers.

GBP/CAD Exogenous Analysis

  • The UK and Canada Current Account Differential

The current account differential between the UK and Canada can determine if the GBP/CAD pair is bullish or bearish. If the differential is positive, it means that the UK has a higher current account balance than Canada. This would imply that the GBP is in higher demand in the forex market than the CAD; hence, it is a bullish trend for the pair. Conversely, if the current account differential is negative, it means that the UK has a lesser current balance than Canada. It would imply that the GBP has a lower demand than the CAD in the forex market; hence, a bearish trend for the pair.

In Q3 of 2020, the UK had a current account deficit of $20.97 billion while Canada had a $5.83 billion deficit. Thus, the current account differential is -$15.14 billion. We assign a score of -2.

The interest rate differential is the difference between the Bank of England’s interest rate and that by the Bank of Canada. In the forex market, carry traders use the interest rate differential to decide whether to buy or short a currency pair. When the interest rate differential is positive, traders will earn the differential by going long. If the differential is negative, traders can earn the differential by shorting the currency pair.

Therefore, if the GBP/CAD pair’s interest rate differential is positive, the pair is bound to adopt a bullish trend. Conversely, if negative, the pair is bound to be bearish.

In 2020, the interest rate in the UK dropped from 0.75% to 0.1%. In Canada, the BOC cut the interest rate from 1.75% to 0.25%. Therefore, the interest rate differential is -0.15%. The interest rate differential between the UK and Canada has a score of -1.

  • The differential in GDP growth rate between the UK and Canada

This differential measures the changes in the growth rate between the two economies. It is a preferred method of comparison since economies are of different sizes. Naturally, the economy with a higher GDP growth rate will have its currency appreciate more. Therefore, if the GDP growth rate differential is positive, it means that the GBP/CAD pair is bullish. If negative, then the pair is bearish.

During the first three quarters of 2020, the UK economy has contracted by 5.8%, while the Canadian economy has contracted by 3.3%. This makes the GDP growth rate differential -2.5%. Hence, a score of -1.

Conclusion

Indicator Score Total State Comment
The UK and Canada Current Account Differential -2 10 A differential of – $15.14 The UK has a higher deficit than Canada
The interest rate differential between the UK and Canada -1 10 -0.15% Expected to remain at -0.15% until either economy have recovered
The differential in GDP growth rate between the UK and Canada -1 10 3.30% The Canadian economy contracted at a slower pace than the UK economy
TOTAL SCORE -4


The cumulative score for the exogenous factors is -4. This means that we can expect the GBP/CAD pair to trade in a downtrend in the short term. However, technical analysis shows the pair adopting a bullish trend with the weekly chart trading above the 200-period MA. More so, the pair is seen bouncing off the lower Bollinger band.

Keep an eye on the near-term changes in the exogenous factors.


Categories
Forex Fundamental Analysis

EUR/CAD Global Macro Analysis Part 1 & 2

Introduction

The global macro analysis of the EUR/CAD pair will analyze endogenous factors that drive the domestic GDP in the EU and Canada. We’ll also analyze exogenous factors that affect the dynamics of the EU and Canada economies, hence affecting the EUR/CAD exchange rate.

Ranking Scale

We’ll rank both endogenous and exogenous factors on a sliding scale from -10 to +10. When the endogenous factors are negative, it means they caused the domestic currency to depreciate. A positive ranking means they resulted in an appreciation of the currency during the period under review. The endogenous scores are based on correlation with the domestic GDP growth.

Similarly, when the exogenous factors get a negative score, they resulted in a drop in the exchange rate. A positive exogenous score means it increased the exchange rate of the EUR/CAD pair. The exogenous scores are based on a correlation with the price of the EUR/CAD pair.

EUR Endogenous Analysis – Summary

The endogenous analysis of the EUR has presented a score of -3. Based on the indicators that we have analyzed, we can conclude that the Euro has depreciated marginally this year.

CAD Endogenous Analysis – Summary

This economic indicator shows the monthly change in the number of Canadians who are employed. It covers both full-time and part-time employment. Normally, employment changes correspond to an increased business activity, which corresponds to changes in the GDP.

In November 2020, employment in Canada increased by 62,000, down from the 83,600 increase registered in October. The November employment change was the lowest since May 2020, when economic recovery from the effects of the coronavirus began. Up to November 2020, the Canadian economy has shed about half a million jobs. We assign a score of -6.

  • Canada GDP Deflator

The GDP inflator is a comprehensive measure of the change in the inflation rate in Canada. It is comprehensive since it reflects the changes in the prices of all goods and services produced within the economy. This contrasts with other measures of inflation like the CPI, which only measures changes in the price of a select basket of goods and services.

In Q3 of 2020, the GD deflator in Canada rose to 111.6 from 108.8 in Q2. Q3 reading is the highest ever in the history of Canada. This shows that the Canadian economy is bouncing back from the economic downturn brought about by the pandemic. We assign a score of 2.

  • Canada Industrial Production

This indicator measures the total output from businesses operating in the industrial sector. Canadian industrial production comprises mining, manufacturing, and utilities. It is the backbone of the Canadian economy, with crude oil production alone accounting for almost 10% of the GDP.

In September 2020, the YoY Canadian industrial production dropped by 7.9%, while the MoM increased by 1.41%, up from the 0.13% drop in August. Up to September, the overall industrial production is down 5.54%. We assign a score of -5.

  • Canada Manufacturing PMI

This indicator measures the Canadian manufacturing sector’s performance from the perspective of firms’ purchasing managers in the sector. The PMI aggregates the following indexes; inventories, employment, new orders, output, and suppliers’ deliveries. The sector is expanding if the index is above 50, while a reading below 50 shows contraction.

In November 2020, the Canada Manufacturing PMI rose to 55.8 from 55.5 in October. This marked the fifth consecutive expansion in the manufacturing sector from July 2020. Thus, we assign a score of 4.

  • Canada Retail Sales

The Canada retail sales data measures the changes in the value of final goods and services purchased by households over a particular period. It is a critical leading indicator of the overall economic growth since households’ consumption is considered the primary driver of GDP growth.

In September 2020, the MoM retail sales in Canada increased by 1.1%  compared to a 0.5% increase in August. YoY retail sales rose by 4.6% compared to 3.7% in August 2020. Up to September 2020, the retail sales figure has risen by an average of 1.38%. We assign a score of 3.

  • Canada Consumer Confidence

Canada consumer confidence is calculated from an aggregate of 11 questions from the survey of households. This survey estimated the current situation to that expected by households in about six months. The questions touch on the areas of the economy, personal finances, job security, household purchases, and savings vs. expenditure goals. Their confidence is measured on a scale from 0 to 100.

In November 2020, consumer confidence in Canada rose to 44.5 from 42.08 in October. It is, however, still lower than during the pre-pandemic period. We assign a score of -5.

  • Canada Government Gross Debt to GDP

In 2019, Canada had a government debt to GDP ratio of 88.6%, down from 89.7% in 2018. The 2019 ratio was the fourth consecutive year since 2016, when the government debt to GDP ratio dropped.

In 2020, it is projected that the Canadian government debt to GDP ratio will increase to 97%. This increase is due to the increased expenditure to alleviate the economy during the coronavirus pandemic. Over the long term, Canada’s government debt to GDP ratio is expected to stabilize around 90%. We assign a score of -2.

In the next article, you can find the exogenous analysis of the EUR/CAD forex pair where we have qualitatively forecasted the future price movement of this pair. Cheers.

Categories
Forex Course

200. The Correlation Between USD/CAD Pair & Crude Oil

Introduction

Crude oil, also known as black gold, is the major energy source that runs the economy. Canada is among the top oil producers in the world. It is one of the major oil exporters to the USA. Canada exports more than 3 million barrels of petroleum and oil products, a figure that is sufficient to impact USD/CAD’s movement.

USD/CAD and Crude Oil – The Correlation

The volume of crude oil that Canada exports to the US generate massive demand for the CAD. Moreover, Canada’s economy depends a lot on its exports, and approximately 85% of the country’s exports go to the US.

Therefore, the value of USD/CAD is significantly impacted by how the consumers in the United States reach oil prices. If the US’s demand increases, manufacturers have to order more oil to cater to the rising demand. This can result in rising oil prices, thereby resulting in reducing the value of USD/CAD.

Conversely, if the US’s demand falls, the manufacturer will not need to order in more oil to make goods. Subsequently, the oil prices might fall, which would be bad from the CAD value. So essentially, USD/CAD has a negative correlation.

It’s all about Supply and Demand

Supply and demand are the prominent influencers of the correlation between USD/CAD and crude oil, impacting the demand and supply of US dollars and Canadian dollars.

Export of cruise oil covers a significant percentage of the US currency acquired by Canada. This means that a shift in the price and volume of crude oil will have a considerable impact on the flow of the Greenback into the Canadian dollar.

Furthermore, high crude oil prices also imply a higher flow of USD into Canada due to its exports. This implies that there will be a strong supply of the USD into the Canadian dollar, thereby increasing the value of the Canadian dollar.

Similarly, when the crude price falls, the US dollar supply will be lowered as opposed to the Canadian dollar, leading to a decreasing value of the Canadian dollar.

[wp_quiz id=”97486″]
Categories
Forex Fundamental Analysis

USD/CAD Global Macro Analysis – Part 3

Introduction

The exogenous analysis for the USD/CAD pair will involve analyzing factors that significantly contribute to these two currencies’ interaction. Remember, when trading forex, you are trading a currency pair, which means you buy one currency and sell the other. With exogenous analysis, you get the bigger picture regarding the currency pair as a whole. In a sense, the exogenous analysis compares how the endogenous factors between the US and Canadian economies net against each other.

For the exogenous analysis, we’ll focus on:

US and Canadian Interest rate differential

Interest rate differential is the difference between the interest rates in the US and Canadian. When the interest rate in one country s higher than the other, investors will pull their funds from the country with the lower interest rate to invest in high yielding securities in the country with the higher interest rate.

Canada’s interest rate has for most of the year been higher than that in the US. We, therefore, expect that from March 2020, the USD weakened against the CAD. However, since the current interest rate differential is 0%, going forward, we do not expect that it will play a significant role in determining the value of the USD/CAD pair. Hence, we assign it a neutral score of 0.

GDP Growth Differential

A country’s GDP growth is mainly propelled by growth in international trade. Therefore, when the GDP expands, we can expect that the country is becoming a net exporter. That means the demand for its currency increases in the international market, which also increases its value.

Over the years, the Canadian GDP growth rate has outpaced that of the US. However, in the third quarter of 2020, the US GDP growth rate outpaced Canada by 23.1%. Based on our correlation analysis between the GDP differential and the USD/CAD pair, we assign an inflationary score of 2. If this trend continues, we expect a future strengthening of the USD against CAD.

Differences in Trade Balance

The balance of trade helps to show the trade deficits that a country operates in the international market. The trade deficit widens as the country consistently becomes a net importer. Furthermore, the trade deficit can also widen if the value of the goods exported by a country drops while the value of imports increases.

From April 2020, the Canadian trade deficit has been widening as compared to that of the US. In October 2020 data release, the Canadian trade deficit widened by CAD 3.25 billion while the US trade deficit widened by $3.1 billion. Due to its high correlation with the USD/CAD pair, we assign the difference in trade deficit an inflationary score of 3. If this trend persists, we expect it to result in bullish USD/CAD.

Conclusion

Based on the exogenous analysis, the USD/CAD gets an inflationary score of 5. It implies that if the current trend of the exogenous factors persists, we can expect a bullish trend for the USD/CAD pair in the near term.  Now that we know the trend, we can use technical analysis to find accurate entries and exits in this currency pair while keeping the bullish trend in mind.

From the exogenous analysis of the USD/CAD pair, we have observed that the pair is expected to adopt a bullish trend in the near term. Let’s see if this is supported by technical analysis. In the below weekly chart, we can see the pair bouncing off a 2-year support line and from the oversold territory of the Bollinger Bands. This indicates a clear bullish trend in the near future. 

We hope you found this analysis informative. Please let us know if you have any questions in the comments below, and we would love to address them. Cheers.

Categories
Forex Fundamental Analysis

USD/CAD Global Macro Analysis – Part 2

CAD Endogenous Analysis – Summary

The Canadian endogenous factors recorded a score of -11.5, implying a deflationary effect in the CAD as well. This means that according to the Fundamental indicators, the CAD has also lost its value since the year began, but not as much as the USD.

Unemployment Rate

The unemployment rate measures the number of people who do not have jobs and are actively seeking gainful employment. The unemployment rate is used to show business cycles and economic growth because when businesses expand, the demand for labor is higher when the economy is undergoing a contraction, the demand for labor decreases, and the unemployment rate increases.

In October 2020, the Canadian unemployment rate was 8.9% down from the historic highs of 13.7% registered in May 2020. The rate is still higher than the 5.6% average before the onset of the coronavirus pandemic.

Based on our correlation analyses, the Canadian unemployment rate gets a score of -6. It means that in 2020 the unemployment rate has a deflationary impact on the CAD.

Canadian Rate of Inflation

The Canadian CPI is a weighted average of the following categories: Shelter 27.5%, Transportation 9.3%, Food 16.1%, household operations 11.8%, education and recreation 11.8%, clothing 5.7%, health and personal care 5%, and alcohol and tobacco 3%.

The CPI target in Canada is 2%. The Bank of Canada uses monetary policy to maintain inflation within the target range of 2%. An increasing rate of inflation is positive for the CAD.

In October 2020, the annual inflation rate in Canada rose to 0.7 from lows of -0.4 in May 2020, but still below the 2.4 recorded in January.

We assign the Canadian rate of inflation a score of -7, meaning it had a negative impact on the CAD.

Canada Industrial production

Industrial production is used to measure the output from manufacturing, mining, and the utility sectors in Canada.

In August 2020, the industrial production in Canada declined by 9.04%. Based on our correlation analysis of the Canadian industrial production and GDP, we assign it a deflationary score of -5.

Manufacturing sales

The Canadian manufacturing sales measure the value changes in the output from the manufacturing goods in the economy. It can be used to measure the short-term health of the manufacturing sector and, by extension, the health of the overall economy.

In September 2020, the manufacturing sales were worth CAD 53.8 billion, representing a 1.4% increase from August. However, manufacturing sales are still 3.6% below the pre-coronavirus period.

Based on the correlation analysis with the Canadian GDP, we assign an inflationary score of 3 to the manufacturing sales.

Retail sales

The Canadian retail sales data measures the total value that households spend on purchasing goods and services for direct consumption. This value is adjusted for inflation.

Consumption by households accounts for up to 78% of the Canadian GDP. Changes in the retail sales data can be used as a leading indicator of the welfare of households. Higher retail sales imply increased demand in the economy hence higher manufacturing and lower unemployment rates.

The retail sales in September 2020 steadily increased by 1.1% from lows of -26.4% in April. Based on the correlation analysis with the GDP, we assign retail sales a score of 6.

Government debt to GDP ratio

In 2019, Canada’s public debt to GDP was 88.6, representing a 1.26% decline from 89.7 registered in 2018.

In 2020 the government debt to GDP in Canada is expected to rise due to the various stimulus packages necessitated by the coronavirus pandemic. However, based on the past correlation analysis with GDP, we assign a marginal deflationary score of -2 on Canada’s government debt to GDP ratio.

Canada housing starts

The housing starts indicators track the number of new residential buildings that begin construction. It is used as a leading indicator of the demand in the real estate market and demand in the housing market.

In October 2020, the housing starts in Canada were 214,875 units. Based on the correlation analysis with the GDP, we assign Canadian housing starts an inflationary score of 2.5.

Canada Government Budget Value

This indicator measures the value of the Canadian budget in terms of surplus or deficit. It takes into account the difference between revenues collected and the expenditures by the government. The government budget value doesn’t include public debt.

As of August 2020, the Canadian budget deficit was CAD 21.94 billion. Revenue collected by the government during the month dropped by CAD 1.3 billion, while expenditures increased by CAD 42.92 billion due to COVID-19 response measures.

Based on its high correlation with the GDP, we assign a deflationary score of -6.

Business confidence

In Canada, business confidence is measured by the Ivey Purchasing Managers’ Index (PMI). It measures the business expectations and operating environment from the perspective of an operating panel of purchasing managers from both private and public sectors across Canada.

The Ivey PMI focuses on supplier deliveries, purchases, employment, inventories, and prices. Values over 50 imply expansion while below 50 implies contraction.

The Ivey PMI reading for October 2020 was 54.5, indicating expansion. From our correlation analysis, we assign Canadian business confidence an inflationary score of 3.

In our next article, we will analyze the Exogenous factors of both USD and CAD to come to an appropriate conclusion.

Categories
Forex Assets

The Fundamentals of the Canadian Dollar (CAD)

The Canadian dollar, which is also known as the CAD, may not date back long in time like some other currencies (e.g. the British pound), yet its history is equally fascinating. Although the CAD is relatively young, it is now believed to be the seventh most traded currency in the world. Back in 1941, an important decision was made in the Province of Canada, a then-new British colony in North America, to make their currency a one-tenth value of the United States’ Golden Eagle $10 coin. This change meant that the two currencies were connected more tightly and that the value of the CAD depended on the worth of the USD. As Canada did not have a central bank for some time, the printing of money was a duty performed by several private banks.

As Canada kept growing, new Canadian territories slowly started to adopt the CAD – Nova Scotia in 1871 and Newfoundland in 1949. The currency was pegged to the USD quite a few times throughout history: 1841—1933, 1940—1950, and 1962—1970. Despite the peg, Canada always demonstrated the air of independence, and this was particularly noticeable during the Great Depression when the Canadian government decided to move towards having their own monetary policy and central bank. Hoping to protect itself from the economic downfall that was particularly prominent in the US, Canada was pushed into making their own central banking institution and take over control of their currency. The CAD is nowadays also referred to as a loonie, which is the name of a bird that is printed on the C$1 coin, which incidentally inspired the derivation of the name toonie used for the C$2 coin. Aside from C$, some similar variations that include the dollar symbol are used as well so as to make a difference from other dollar-denominated currencies, notably CA$ and Can$.

Bank of Canada

For almost one entire century, Canada managed to go without a central bank with 10 private banks handling the issuance of the CAD. Nevertheless, the benefit of printing money was never intended for the government of Canada to reap, but the banks alone. One of the biggest banks at the time, the Bank of Montreal, grew to become a more dominant institution that acted as a central bank. This bank was, however, an independent player whose goals were not necessarily aligned with Canada’s needs, especially since there was an overall lack of autonomy and vision. After the Great Depression, Canada became aware of the need to become more separate from the USD, which brought forth the creation of their own central bank.

In 1935, the Canadian government did take necessary action and established the Bank of Canada, which then took on the responsibility of running the currency. The Bank of Canada (BOC) now holds meetings eight times a year to discuss matters pertaining to their goals of maintaining price stability. Unlike other central banks, such as the Federal Open Market Committee (FOMC) in the United States, the BOC has a single mandate, which has proved to be quite limiting for enacting monetary policy. Some other single-mandate central banks, e.g. the European Central Bank (ECB), do not deal with maximizing employment and GDP growth. As the ECB is only concerned with price stability, they are often unable to provide the assistance Europe requires. Canada, however, appears to be handling this issue much better, which could be potentially attributed to its laws.

The CAD Currency Basket

The BOC in fact seems to be acting as a dual-mandate central bank, which has been supported by their actions during some periods of crisis in the past. The new Governor of the Bank of Canada and the Chair of the Board of Directors, Mr. Tiff Macklem, was appointed in June this year, at a rather difficult time when many Canadian citizens and companies requested support in order to withstand the COVID-19 pandemic. Owing to his expertise in financial markets, the new Governor is believed to be able to assist the central bank to weather the current economic crisis. 

Canadian Economy

Canada is one of the largest economies, currently believed to be ranking in the top 10 economies in the world. Canada thrives on oil, mining, and logging, as these are the country’s biggest industries, which make the CAD heavily based on commodities. Canada still has strong ties with the United States, which is also its largest trading partner, and this relationship appears to impact the Canadian economy whenever there are changes in the US. Considering the fact that more than 50% of imports in Canada come from the US, any impediments in the US economy are likely to cause the same slowdown in Canada. In addition to the two economies being so closely intertwined, the CAD acts as the reserved currency for many Caribbean islands. What is more, one can even pay for all goods and services with this currency in some of the islands in this region.  

Major Correlations

Due to the strength of the Canadian economy largely stemming from oil, mining, and logging industries, the CAD has established some of its major correlations with the related commodities. The correlation between the CAD and oil, for example, has always been one of the more prominent ones although its nature and degree keep changing. In the past, traders have witnessed quite a high correlation between the two, which entails that once the oil goes down, so will the CAD during the same period of time. Information concerning such strong correlations can help traders assess the currency and come to an important conclusion that may help their trading. Nonetheless, as we can see from the chart below, these correlations are neither strong nor relevant 100% of the time, so the CAD and oil do not necessarily reveal any similar or dissimilar tendencies at all times. However, due to their historically prominent correlation, traders interested in the CAD should most definitely obtain information on what is currently happening with oil, what some of its previous tendencies were, and where it will likely move in the future.

CAD basket vs. Oil (blue line)

Economic Reports

As the Canadian economy greatly resembles that of the United States, the same reports are going to apply: quarterly GDP reports, monthly employment reports, monthly retail sales, monthly producer and consumer price index (PPI and CPI) as well as a trade deficit. Any trader keen on trading the CAD can potentially rely on its knowledge and understanding of the US economy, as the Canadian economy largely models that of the United States. 

Most Traded Pairs

The most-traded CAD-based crosses include USD/CAD, EUR/CAD, GBP/CAD, and CAD/CHF. In terms of volume and liquidity, the number one currency pair is USD/CAD, which is said to make more than 50% of all CAD transactions. The remaining four currencies fall behind on both volume and liquidity, which is an extremely important piece of information for traders. Understanding the nature of these pairs particularly comes to prominence during some news announcements, which often trigger lighter spreads and greater volatility. The EUR/CAD and GBP/CAD currency pairs both have decent volume, while most other crosses involving the CAD could be considered as more exotic. The AUD/CAD, for example, is an unusual pair primarily due to the vast geographic distance and the low quantity of trade between the two countries, which immediately leads to lower liquidity levels and greater width of the spreads. While trading the CAD, in general as well as in the face of any news events, the safest crosses are believed to be USD/CAD, EUR/CAD, and GBP/CAD.

Most Traded CAD crosses vs. AUD/CAD

Trading the CAD

Due to the fact that the Canadian economy is so heavily reliant on commodities, it is most likely to perform best during economic expansion. Any period of global growth involving a high demand for materials such as copper, steel, oil, etc. is assumed to be bullish for commodity-based currencies. Therefore, the CAD, too, is generally likely to be bullish during economic growth. Although this reaction of the CAD to the rising market may not always be true in 100% of cases, it is going to hold true for the majority of cases. Any time the price of commodities appears to be dropping, traders can ten assume that there is little demand for commodities such as copper, steel, or oil for example. Whenever the economy seems to be in recession, the CAD can be expected to underperform, experiencing difficulties.

In terms of interest rates, at 0.25%, Canada appears to have set neither the highest nor the lowest rates. While placed in the middle at the moment, Canadian interest rates are generally said to vary according to CPI and PPI inflation reports. As the Canadian economy greatly influences the state of commodities, traders can expect any rise in commodities to lead to a rise in inflation in Canada, causing the country’s central bank to increase interest rates. As we discussed before, the price of commodities will also affect the CAD and vice versa. In terms of trade deficits, Canada seems to be doing well in particular due to its large quantity of exports leading to a trade surplus. Currently, Canada plans to keep on offering quantitative easing programs in order to alleviate the impact of the COVID-19 pandemic. Nonetheless, the Canadian economy seems to be recovering, especially after the coronavirus restrictions started to ease although GDP is projected to shrink by 7.8% in 2020.

Central Bank Interest Rates

Recent Trends (until September 2020)

The CAD appears to have exhibited the greatest number of trend changes among all major currencies in the past few weeks. Going steady on the downwards trend line, the CAD broke the pattern through a reversal, followed by a bullish movement for three days straight, with the chart ending in a form of a pull-back. The nature of the continuation of this pullback may bring some lucrative opportunities, for example, should a reversal occur. Some market analysts state that they would prefer going on the upside than going bearish when it comes to the CAD at this time. It is interesting to know that professional traders believe that CAD has one of the best charts at the moment. Preceded by a clear change of trend and quite a few up-and-down movements, we may still not be able to see a true breakout, although the bullish reversal pattern is quite apparent at the end of the chart. This currency has been rather weak for a long period of time, but experts seem to believe that the CAD is finally going to start to go up in the near future. Just this past week, the CAD had a few important news events and economic reports come out, such as the Governor’s speech and the GDP report. Compared to other currencies, the CAD appears to be doing really well at the time, currently placed among the strongest currencies.

Categories
Forex Assets

What Should You Know Before Trading The CAD/EGP Forex Exotic Pair

Introduction

The CAD/EGP is an exotic currency pair with the CAD representing the Canadian Dollar, and EGP – the Egyptian Pound. Forex trading in such an exotic currency pair is accompanied by higher volatility. The CAD is the base currency, while the EGP is the quote currency in this pair. Therefore, the price attached to this pair shows the amount of EGP that 1 CAD can buy. Let’s say that the price of CAD/EGP is 11.7692. This price means that for every 1 CAD, you can buy 11.7692 EGP.

Spread

In the forex market, the difference between the buying and selling prices of a currency pair is called the spread. The spread for CAD/EGP is: ECN: 3.7 pips | STP: 8.7 pips

Fees

There are no broker fees associated with the STP accounts. For the ECN account, however, the trading fee is determined by your broker.

Slippage

Slippage in forex is the difference between the price that a trader requests the broker to complete a trade and the price that the broker executes the trade. This difference is determined by the brokers’ speed of execution and market volatility.

Trading Range in the CAD/EGP Pair

Forex traders endeavor to know the average number of pips that a particular currency pair moves within a given timeframe. The trading range represents the volatility of a currency pair within a particular timeframe. The knowledge of a pair’s trading range makes for a useful risk management tool.

If, for example, during the 1-hour timeframe, the CAD/EGP pair has a trading range of 10 pips, then someone trading this pair can expect to gain or lose $8.5 within this period. Below is a table showing the minimum, average, and maximum volatility of CAD/EGP across different timeframes.

The Procedure to assess Pip Ranges

  1. Add the ATR indicator to your chart
  2. Set the period to 1
  3. Add a 200-period SMA to this indicator
  4. Shrink the chart so you can determine a larger period
  5. Select your desired timeframe
  6. Measure the floor level and set this value as the min
  7. Measure the level of the 200-period SMA and set this as the average
  8. Measure the peak levels and set this as Max.

CAD/EGP Cost as a Percentage of the Trading Range

In the forex market, trading costs include brokers’ fees, slippage, and spread. i.e.

Total cost = Slippage + Spread + Trading Fee

Below are analyses of percentage costs (in pips) to be expected when trading the CAD/EGP pair using either the ECN or the STP account.

ECN Model Account

Spread = 3.7 | Slippage = 2 | Trading fee = 1

Total cost = 6.7

STP Model Account

Spread = 8.7 | Slippage = 2 | Trading fee = 0

Total cost = 10.7

The Ideal Timeframe to Trade CAD/EGP

As can be seen from the tables above, trading the 1-hour timeframe with either the ECN or the STP account carries the highest trading costs. We can deduce that during times of low volatility, the trading costs are higher. However, for short term traders, timing their trades when volatility is above average during the 1H, 2H, 4H, and the 1D timeframes ensure they incur lower trading costs with the CAD/EGP pair.

The higher timeframes provide the longer-term traders of the CAD/EGP pair lower trading costs. Forex traders can reduce the trading costs by using limit order types, which removes the risks of slippage. Here’s a demonstration of how this works in the ECN account.

Total cost = Slippage + Spread + Trading fee

= 0 + 3.7 + 1 =4.7

Notice that when the slippage cost is eliminated by using limit orders, the total costs are significantly reduced. The highest cost, for example, reduces from 113.56% to 79.66%.

Categories
Forex Assets

Analysing The CAD/HUF Forex Currency Pair & Determining The Costs Involved

Introduction

The CAD/HUF is an exotic currency pair where CAD represents the Canadian Dollar, and HUF – the Hungarian Forint. In this article, let’s understand some of the basic concepts you should familiarise with before trading the CAD/HUF pair.

For this currency pair, the CAD is the base currency and the HUF the quote currency. In this case, the price associated with the CAD/HUF pair shows the amount of HUF that 1 CAD can buy. For example, if the price of CAD/HUF is 232.97, it means that 1 CAD can buy 232.97 HUF.

Spread

Spread in the forex market is the difference between buying price, i.e. ‘bid’ and the selling price, i.e. ‘ask.’ The spread for the CAD/HUF is – ECN: 50 pips | STP: 55 pips

Fees

The trading fees you are charged depends on the type of forex account you have. STP accounts carry no trading fee, while for the ECN accounts, the trading fees are determined by your forex broker.

Slippage

In highly volatile trading sessions, sometimes the price at which you trade is different than the price at which that trade will be executed. This difference is called slippage and is usually determined by your broker’s speed of execution.

Trading Range in the CAD/HUF Pair

In the forex market, a currency pair will fluctuate differently across different timeframes. Trading range helps a forex trader analyze how a given pair moves (in terms of pips) over a given timeframe, which is an important risk management tool.

For example, let’s say that during a 1-hour timeframe, the CAD/HUF pair has a trading range of 10 pips. A forex trader trading this pair can expect to gain or lose $43 since the value of 1 pip is $4.3

The table below shows the minimum, average, and maximum volatility of CAD/HUF across different timeframes.

The Procedure to assess Pip Ranges

  1. Add the ATR indicator to your chart.
  2. Set the period to 1
  3. Add a 200-period SMA to this indicator.
  4. Shrink the chart so you can determine a larger period
  5. Select your desired timeframe
  6. Measure the floor level and set this value as the min
  7. Measure the level of the 200-period SMA and set this as the average
  8. Measure the peak levels and set this as Max.

CAD/HUF Cost as a Percentage of the Trading Range

Trading costs that can be expected in forex include slippage, spread, and brokers’ fees. Thus, Total cost = Slippage + Spread + Trading Fee.

Forex traders should learn how these costs change across different timeframes as the currency pair price fluctuates. The tables below show the percentage costs (in pips) that can be expected when trading the CAD/HUF pair.

ECN Model Account

Spread = 50 | Slippage = 2 | Trading fee = 1

Total cost = 53

STP Model Account

Spread = 55 | Slippage = 2 | Trading fee = 0

Total cost = 57

The Ideal Timeframe to Trade CAD/HUF

With both the ECN and the STP forex trading accounts, the 1-hour timeframes have the highest costs. Therefore, for short-term traders, using the timeframes with minimum volatilities increases the trading costs they will incur. For the 1H, 2H, 4H, and the 1D timeframes, you will incur lower trading costs by trading the CAD/HUF pair when the volatility is above average.

For both types of trading accounts, longer time frames, i.e., the weekly and the 1-month, offer lesser trading costs for the pair. It is worth noting that forex traders can minimize their costs by using limit order types, which eradicate the risks of slippage. Here’s an example with the ECN account.

Total cost = Slippage + Spread + Trading fee

= 0 + 50 + 1 =51

You can notice that when the cost associated with slippage is removed, the overall costs for trading the CAD/HUF pair significantly drops. The highest cost reduces from 898.31% to 864.41%.

Categories
Forex Assets

Understanding The Costs Involved While Trading The CAD/ILS Forex Exotic Pair

Introduction

CAD/ILS is an exotic currency cross. Here, CAD is the Canadian Dollar, and ILS is the Israeli Shekel. The CAD is the base currency, and the ILS is the quote currency. Therefore, the price of the CAD/ILS pair represents the quantity of the ILS that  CAD can buy. If the price of the pair is 2.6004, it means that 1 CAD can buy 2.6004 ILS.

CAD/ILS Specification

Spread

The buying price and the selling price of a currency pair tend to be different in forex. The difference between these two prices is the spread. The spread for the CAD/ILS pair is: ECN: 22 pips | STP: 27 pips

Fees

Forex brokers charge a commission on every trade made with the ECN account. The commission varies depending on the broker and the type of trade. Trades on STP accounts do not attract a trading fee.

Slippage

It is rare for a trader to get the exact price they request for a trade. Usually, there is a difference between the price requested and the execution price. This difference is the slippage, and it depends on market volatility and the speed of trade execution.

Trading Range in the CAD/ILS Pair

The trading range is the analysis of how currency fluctuates across different timeframes in terms of pips. The trading range is used to analyze a currency pair’s volatility and expected profit. For example, if on the 2-hour timeframe the trading range of the CAD/ILS pair is 10 pips, then a trader can expect to either gain or lose $38.5

Here’s the trading range for the CAD/ILS pair.

The Procedure to assess Pip Ranges

  1. Add the ATR indicator to your chart
  2. Set the period to 1
  3. Add a 200-period SMA to this indicator
  4. Shrink the chart so you can determine a larger period
  5. Select your desired timeframe
  6. Measure the floor level and set this value as the min
  7. Measure the level of the 200-period SMA and set this as the average
  8. Measure the peak levels and set this as Max.

CAD/ILS Cost as a Percentage of the Trading Range

The cost of trading any currency involves the slippage, fees, and the spread. These costs vary across different timeframes under different volatility conditions. For a forex trader, analyzing the cost as a percentage of the trading range helps implement informed risk management techniques.

The tables below show the analyses of the trading costs for the CAD/ILS pair across different timeframes.

ECN Model Account

Spread = 22 | Slippage = 2 | Trading fee = 1

Total cost = 25

STP Model Account

Spread = 27 | Slippage = 2 | Trading fee = 0

Total cost = 29

The Ideal Timeframe to Trade CAD/ILS

We can see that the trading cost for the CAD/ILS pair is higher during shorter timeframes and low volatility in both the ECN and STP accounts. Longer-term traders trading on weekly and monthly timeframes enjoy relatively lesser trading costs than shorter timeframe traders.

It is worth noting that for every type of trader, initiating trades when volatility is above average reduces the trading costs. Furthermore, opting to use forex limit orders instead of market orders which are susceptible to slippage, can significantly reduce trading costs. With limit orders, the risk of slippage is removed hence lowering trading costs. Here are the trading costs when limit orders are used.

ECN Account Using Limit Model Account

Total cost = Slippage + Spread + Trading fee

= 0 + 22 + 1 = 23

We can see that trading costs for the CAD/ILS have reduced across all timeframes, with the highest cost dropping from 491.53% to 372.88% of the trading range.

Categories
Forex Assets

Analysing The Costs Involved While Trading The CAD/INR Exotic Currency Pair

Introduction

The CAD/INR pair is considered an exotic currency pair where CAD is the Canadian Dollar, while the INR is the Indian Rupee. This article will cover the basic elements of the CAD/INR pair that you should know before you start trading the pair.

In this pair, the CAD is the base currency, while the INR is the quote currency. Therefore, the price attached to the CAD/INR pair is the amount of INR that can be bought by 1 CAD. For example, if the price of CAD/INR is 55.059, it means that for every 1 CAD, you can get 55.059 INR.

CAD/INR Specification

Spread

The price at which you can buy a currency pair is different from the price at which you can sell the same pair. This difference is the spread. The spread is considered a source of revenue for brokers and a trading cost for forex traders. The spread for the CAD/INR pair is as follows.

ECN: 39 pips | STP: 44 pips

Fees

The trading fee is the commission you pay your forex broker for every trade you make. STP accounts usually have no trading fees, while the fees charged on ECN accounts vary from broker to broker.

Slippage

Slippage represents the difference between the price at which you place a trade and the price at which your broker will execute the trade. Market volatility and the broker’s efficiency determine the amount of slippage.

Trading Range in the CAD/INR Pair

The trading range in forex helps a trader analyze the extent of a currency pair’s fluctuation during a specific timeframe. As measured in pips, this fluctuation can help determine the volatility of the pair and the expected gains or losses. For example, if in the 4-hour timeframe the CAD/INR pair has a volatility of 30 pips, a trader can expect to either gain or lose $54 since the value of 1 pip is $1.8

The table below shows the minimum, average, and maximum volatility of CAD/INR across different timeframes.

The Procedure to assess Pip Ranges

  1. Add the ATR indicator to your chart
  2. Set the period to 1
  3. Add a 200-period SMA to this indicator
  4. Shrink the chart so you can determine a larger period
  5. Select your desired timeframe
  6. Measure the floor level and set this value as the min
  7. Measure the level of the 200-period SMA and set this as the average
  8. Measure the peak levels and set this as Max.

CAD/INR Cost as a Percentage of the Trading Range

The knowledge of the potential costs when trading helps determine the trading strategies to be used. Cost as a percentage of the trading range will help us understand how trading costs vary with volatility under different timeframes.

Total cost = Slippage + Spread + Trading Fee

The tables below show the analyses of percentage costs in both ECN and STP accounts.

ECN Model Account

Spread = 39 | Slippage = 2 | Trading fee = 1

Total cost = 42

STP Model Account

Spread = 44 | Slippage = 2 | Trading fee = 0

Total cost = 46

The Ideal Timeframe to Trade CAD/INR

Depending on your forex trading style, you can use the above analysis to coincide with your trade of the CAD/INR pair with moments of lower trading costs. The 1-hour timeframe for the STP and the ECN accounts has the highest trading costs of 779.66% and 711.86% of the trading range, respectively. Also, notice that the highest costs coincide with the lowest volatility of 3.1 pips.

Trading longer timeframes like the 1-week and the 1-month timeframes are associated with lower costs. However, trading when the CAD/INR pair’s volatility is above average has a lower cost. Another way of reducing trading costs is by using the limit order types, which eliminates the slippage costs. Here’s how it works.

Total cost = Slippage + Spread + Trading fee

= 0 + 39 + 1 = 40

When limit orders are used, the slippage cost becomes zero. Consequently, the trading costs are significantly reduced, with the highest trading cost dropping from 711.86% to 677.97% of the trading range.

Categories
Forex Assets

Costs Involved While Trading The CAD/RON Forex Exotic Pair

Introduction

The CAD/RON is an exotic currency pair where CAD is the Canadian Dollar, and RON is the Romanian Leu. This article will explain some basic elements about the CAD/RON you ought to know before you start trading this pair. The CAD is the base currency, and RON is the quote currency in the CAD/RON exotic pair.

Thus, the CAD/RON pair’s price represents the amount of RON that you can buy using 1 CAD. If the pair’s current price is 3.1292, it means that you can use 1CAD to purchase 3.1292 RON.

CAD/RON Specification 

Spread

When trading forex, the spread represents the difference between the price at which a currency pair can be bought (bid price) and the price it can be sold at (ask price).

The spread for the CAD/RON pair is: ECN: 35 pips | STP: 39 pips

Fees

The STP accounts have no trading fees attached. Trading fees for the ECN accounts vary depending on your choice of forex broker.

Slippage

When trading in the forex market, sometimes the price you request on an order tends to be different from the price your broker executes the trade. This difference is known as slippage, and it depends on the broker’s speed of execution and market volatility.

Trading Range in the CAD/RON Pair

To ensure that proper risk management measures are taken, forex traders should know how much a currency pair fluctuates within a given timeframe. Trading range analysis can help forex traders to determine the volatility associated with trading a particular currency pair. This volatility is measured in terms of pips. If the CAD/RON pair has a volatility of 10 pips within the 1-hour timeframe, then a forex trader can be expected to gain or lose $32 since the value of 1 pip of CAD/RON is $3.2

Below is a table showing the minimum, average, and maximum volatility of CAD/RON across different timeframes.

The Procedure to assess Pip Ranges

  1. Add the ATR indicator to your chart
  2. Set the period to 1
  3. Add a 200-period SMA to this indicator
  4. Shrink the chart so you can determine a larger period
  5. Select your desired timeframe
  6. Measure the floor level and set this value as the min
  7. Measure the level of the 200-period SMA and set this as the average
  8. Measure the peak levels and set this as Max.

CAD/RON Cost as a Percentage of the Trading Range

When trading forex, the costs you can expect to incur include; brokers’ fees, slippage, and spread.

Total cost = Slippage + Spread + Trading Fee

The tables below show the analyses of percentage costs in both ECN and STP accounts.

ECN Model Account

Spread = 35 | Slippage = 2 | Trading fee = 1

Total cost = 38

STP Model Account

Spread = 39 | Slippage = 2 | Trading fee = 0

Total cost = 41

The Ideal Timeframe to Trade CAD/RON

From the above cost analysis, we can observe that the cost of trading the CAD/RON pair varies across different timeframes depending on the volatility. For both the STP and the ECN accounts, the 1-hour timeframe carries the highest costs at 694.92% and 644.07%, respectively. These higher costs are associated with the low volatility of 0.1 pips observed during the 1-hour timeframe.

We can also notice that the trading costs drop significantly when the volatility across all timeframes is above average. Therefore, for intraday forex traders, placing trades when the volatility is above average might be a better way of reducing the trading costs associated with the CAD/RON pair. On the other hand, longer-term traders of the pair enjoy lesser trading costs.

One way for traders to reduce their trading costs is to use limit order types. These forex order types eliminate the effects of slippage, thus make the associated slippage costs zero. Below are costs for a trader using limit orders.

ECN Model Account (Using Limit Orders)

Total cost = Slippage + Spread + Trading fee

= 0 + 35 + 1 = 36

As you can see, the trading costs are significantly reduced when limit orders are employed. The highest trading costs dropped from 644.07% to 610.17% of the trading range.

Categories
Forex Assets

Trading The CAD/ZAR Forex Cross Currency Pair & Analyzing The Costs Involved

Introduction

The CAD/ZAR is an Exotic forex currency cross. CAD represents the Canadian Dollar, and the ZAR corresponds to the South African Rand. CAD is the base currency in this pair, while the ZAR is the quote currency. This pair’s exchange rate shows the value of the ZAR, which is equivalent to 1 CAD. If the pair’s exchange rate is 12.7969, it means that 12.7969 ZAR is equivalent to 1 CAD.

CAD/ZAR Specification

Spread

The spread in forex is calculated by subtracting the bid price from the asking price. Brokers determine the spread since it’s their primary source of revenue. Below is the spread charges for ECN and STP brokers for CAD/ZAR pair.

ECN: 39 pips | STP: 44 pips

Fees

Forex traders with the ECN type accounts have to pay a commission to their brokers for every position they open. Brokers do not charge any trading fees on STP accounts.

Slippage

The difference between the trade price preferred by a trader and the broker’s execution price is the slippage. In forex, slippage depends on market volatility and the speed at which the broker executes the trade.

Trading Range in the CAD/ZAR Pair

The trading range is best described as the analysis of how the exchange rate of a currency fluctuates across different timeframes. This analysis will help to estimate the expected returns from trading a particular currency pair. If, for example, on the 1-hour timeframe, the volatility of the CAD/ZAR is ten pips, a trader can expect to gain or lose $78. The trading range for the CAD/ZAR pair is shown below.

The Procedure to assess Pip Ranges

  1. Add the ATR indicator to your chart
  2. Set the period to 1
  3. Add a 200-period SMA to this indicator
  4. Shrink the chart so you can determine a larger period
  5. Select your desired timeframe
  6. Measure the floor level and set this value as the min
  7. Measure the level of the 200-period SMA and set this as the average
  8. Measure the peak levels and set this as Max.

CAD/ZAR Cost as a Percentage of the Trading Range

To make an informed risk management decision when trading the CAD/ZAR pair, we can analyze how the trading costs vary across different timeframes with different volatilities. Here are the cost analyses for the CAD/ZAR pair for both ECN and STP accounts.

ECN Model Account

Spread = 39 | Slippage = 2 | Trading fee = 1

Total cost = 42

STP Model Account

Spread = 44 | Slippage = 2 | Trading fee = 0

Total cost = 46

The Ideal Timeframe to Trade CAD/ZAR

We can notice that shorter timeframes have higher trading costs than the longer timeframes for both the ECN and the STP accounts. Also, across all timeframes, the trading costs reduce as the trading range of the CADZAR pair increases from minimum to maximum.

Although longer-term traders enjoy lesser trading costs, intraday traders can reduce their trading costs by trading when the volatility ranges between medium to the maximum. We can also further reduce the trading costs by implementing forex limit orders, which ensures that slippage does not affect your prices. Here is how trading costs can be reduced using forex limit orders.

ECN Account Using Limit Model Account

Total cost = Slippage + Spread + Trading fee

= 0 + 39 + 1 = 40

Using limit orders has significantly reduced trading costs. For the CAD/ZAR pair, the highest cost has been reduced from 711.86% of the trading range to 677.97%.

Categories
Forex Assets

Trading The CAD/SEK Forex Exotic Currency Pair & Analyzing The Costs Involved

Introduction

CAD/SEK is a Forex exotic currency pair, where CAD is the primary currency of Canada, and SEK (Swedish Krona) is the currency of Sweden. In this exotic currency pair, CAD is considered the base currency, and SEK as the quote currency. This pair’s price determines the value of SEK, which is equivalent to one CAD. We can quote it as 1 CAD per X numbers of SEK. For example, if the CADSEK pair’s value is at 6.5877, we would need almost 6.5877 SEK to buy one CAD.

CAD/SEK Specification

Spread

In all the financial markets, the spread represents the difference between the Bid and Ask prices. It is typically a charge that is deducted by the Forex broker. These spread values vary on the type of execution model used for trade execution.

The spread of the CAD/SEK pair on ECN is 39 pips, and on the STP model account is 44 pips.

Fees

The trading fees that forex brokers are similar to the stock market. It is deducted from the traders’ accounts as soon as they open a new position. There is no fee charged on STP accounts, but a few pips are charged on ECN accounts.

Slippage

Slippage occurs when a trader opens a trade at a price, but it opens at another price by expanding the spread. The main reason for the slippage to occur is the market volatility and the broker’s execution speed.

Trading Range in CAD/SEK

Procedure to assess Pip Ranges

  1. Add the ATR indicator to your chart
  2. Set the period to 1
  3. Add a 200-period SMA to this indicator
  4. Shrink the chart so you can assess a large time period
  5. Select your desired timeframe
  6. Measure the floor level and set this value as the min
  7. Measure the level of the 200-period SMA and set this as the average
  8. Measure the peak levels and set this as Max.

CAD/SEK Cost as a Percent of the Trading Range

The below tables represent the percentage values of trading costs involved while trading this particular Forex asset in various time frames. Please note that these values must be used for directional purposes only. So, for instance, if the percentage of costs involved is high in the one-hour time frame, it implies that this pair is expensive to trade in that particular time frame.

ECN Model Account 

Spread = 39 | Slippage = 5 | Trading fee = 8

Total cost = Spread + Slippage + Trading Fee

= 39 + 5 + 8 = 52

STP Model Account

Spread = 44 | Slippage = 5 | Trading fee = 0

Total cost = Spread + Slippage + Trading Fee

= 39 + 5 + 0 = 49

The Ideal way to trade the CADSEK

The CAD/SEK is an exotic cross currency pair with sufficient liquidity. As a result, traders may find it easy to trade in this pair. If we look at the table, we would see that the percentage values did not move above 65%, representing a lower trading fee even in the lower timeframe. Therefore, trading in this currency pair is suitable for intraday, swing, and even scalping. However, the best decision is to trade when the cost of trading is at the average value.

There is another way to reduce the cost while trading this pair, and it is to place a pending order. We can either place a limit or stop order instead of the market order. In that case, the slippage won’t be considered while calculating the total costs. Therefore, in our example, the overall cost will be reduced by five pips, as shown below.

STP Model Account (Using Limit Orders)

Spread = 44 | Slippage = 0 | Trading fee = 0

Total cost = Spread + Slippage + Trading Fee

= 44 + 0 + 0 = 44

Categories
Forex Assets

Everything About Trading The CAD/SGD Forex Currency Pair

Introduction

CAD/SGD is a Forex exotic currency pair where CAD represents the Canadian Dollar and the SGD, – the Singapore Dollar. For this pair, the CAD is the base currency, and the SGD is the quote currency. Therefore, the price attached to the pair is the quantity of the SGD that can be bought by 1 CAD. If the price of the CAD/SGD pair is 1.0289, it means that 1 CAD dollar buys for 1.0289 SGD.

CAD/SGD Specification

Spread

In forex trading, the difference in pips between the buying price (bid) and selling price (ask) is the spread. Forex brokers primarily generate their revenues through the spread. The spread varies depending on the type of trading account. The spread for the CAD/SGD pair is:

ECN: 7 pips | STP: 12 pips

Fees

For every individual trade made on an ECN account, one has to pay a commission. This fee varies with the broker and depends on the type of trade executed and the currency being traded. STP accounts do not have fees.

Slippage

In forex trading, slippage is the difference in the price in which a trader initiates a trade and the price at which it is executed. Slippage is a direct result of the brokers’ speed of execution and market volatility.

Trading Range in the CAD/SGD Pair

In forex, the trading range shows the fluctuation of a currency pair within s specific timeframe. The trading range is useful to estimate potential profit or loss from trading different timeframes. For example, if the CAD/SGD pair fluctuates ten pips in the 2-hour timeframe, it means that a trader can expect to either gain or lose $97 by trading one standard lot.

Below is a table showing the minimum, average, and maximum volatility of CAD/SGD across different timeframes.

The Procedure to assess Pip Ranges

  1. Add the ATR indicator to your chart
  2. Set the period to 1
  3. Add a 200-period SMA to this indicator
  4. Shrink the chart so you can determine a larger period
  5. Select your desired timeframe
  6. Measure the floor level and set this value as the min
  7. Measure the level of the 200-period SMA and set this as the average
  8. Measure the peak levels and set this as Max.

CAD/SGD Cost as a Percentage of the Trading Range

Cost expressed as the Percentage of the trading range helps a forex trader establish the anticipated trading costs under different market volatility across different timeframes.

Total cost = Slippage + Spread + Trading Fee

The tables below show the percentage costs to be expected when trading the CAD/SGD pair. The costs are expressed as a percentage of pips.

ECN Model Account

Spread = 7 | Slippage = 2 | Trading fee = 1

Total cost = 10

STP Model Account

Spread = 12 | Slippage = 2 | Trading fee = 0

Total cost = 14

The Ideal Timeframe to Trade CAD/SGD

We can see that in both the ECN and the STP accounts, costs are higher when volatility is at a minimum across all timeframes. Furthermore, we can observe that these costs tend to reduce when the volatility increases to the maximum.

For the CAD/SGD pair, costs are highest when volatility is at the lowest at 0.02 pips during the 1-hour timeframe. Conversely, the trading costs are lowest at the 1-month timeframe when volatility is at a maximum of 8.7 pips. Since high volatility can be risky and low volatility less profitable, forex traders should consider trading during times of average volatility.

More so, traders can increase their profitability by eliminating the costs associated with slippage. By using limit instead of market orders, forex traders can avoid experiencing slippage when entering and exiting positions.

Let’s have a look at how zero slippage cost affects the total costs.

ECN Account Using Limit Model Account

Total cost = Slippage + Spread + Trading fee

= 0 + 7 + 1 = 8

Notice that using the limit order type reduces the overall costs. The highest cost, for example, has reduced from 169.49% to 135.59%.

Categories
Forex Assets

Costs Involved While Trading The ‘CAD/TWD’ Forex Exotic Currency Pair

Introduction

The CAD/TWD is an exotic currency pair where CAD is the Canadian Dollar, and the TWD is referred to as the Taiwan New Dollar. In this pair, CAD is the base currency, and the TWD is the quote currency, which means that the exchange rate for the pair shows the quantity of TWD that can be bought by 1 CAD. In this case, if the exchange rate for the pair is 21.864, then 1 CAD buys 21.864 TWD.

CAD/TWD Specification

Spread

In the forex market, the spread is considered a cost to the trader. It is the difference between the ‘bid’ and the ‘ask’ price. Here are the spread charges for ECN and STP brokers for CAD/TWD pair.

ECN: 29 pips | STP: 34 pips

Slippage

When trading forex, slippage occurs when the execution price is below or above the price at opening the trade. The primary causes of slippage are the brokers’ speed of execution and market volatility.

Trading Range in the CAD/TWD Pair

The trading range in forex is used to analyze the volatility of a currency pair across different timeframes. This analysis gives the trader a rough estimate of how much they stand to gain or lose by trading that pair over a given timeframe. For example, say the volatility of the CAD/TWD pair at the 1-hour timeframe is 20 pips. Then, a trader can anticipate to either profit or lose $91.4

The trading range for the CAD/TWD pair is shown below.

The Procedure to assess Pip Ranges

  1. Add the ATR indicator to your chart
  2. Set the period to 1
  3. Add a 200-period SMA to this indicator
  4. Shrink the chart so you can determine a larger period
  5. Select your desired timeframe
  6. Measure the floor level and set this value as the min
  7. Measure the level of the 200-period SMA and set this as the average
  8. Measure the peak levels and set this as Max.

CAD/TWD Cost as a Percentage of the Trading Range

For us to understand the trading costs associated with the volatility, we will determine the total cost for both ECN and STP accounts as a ratio of the above volatility.

ECN Model Account

Spread = 29 | Slippage = 2 | Trading fee = 1

Total cost = 32

STP Model Account

Spread = 34 | Slippage = 2 | Trading fee = 0

Total cost = 36

The Ideal Timeframe to Trade CAD/TWD

From the above analyses, we can conclude that it is costlier trading the CAD/TWD pair on shorter timeframes when volatility is low. Longer timeframes, i.e., the weekly and the monthly timeframes, have lesser trading costs. Therefore, it would be more profitable trading the CAD/TWD pair over longer timeframes.

However, for intraday traders, opening positions when the volatility is above the average will reduce the trading costs. More so, using forex limit orders instead of market orders will reduce the trading costs by eliminating the costs associated with slippage. Here’s an example.

ECN Account Using Limit Model Account

Total cost = Slippage + Spread + Trading fee

= 0 + 29 + 1 = 30

You can notice that using the limit orders significantly reduces the cost as a percentage of the trading range.

Categories
Forex Assets

Trading The ‘CAD/MYR’ Forex Exotic Currency Pair

Introduction

The CAD/MYR is an exotic Forex currency pair where CAD is the Canadian Dollar, and the MYR is the Malaysian Ringgit. In this pair, CAD is the base currency, while the MYR is the quote currency. The price associated with this pair represents the amount of MYR that can be traded for 1 CAD. For example, if the price of the CAD/MYR is 3.1163, it means that 1 CAD can purchase 3.1163 MYR.

CAD/MYR Specification

Spread

When trading a currency pair, the ‘bid’ price and the ‘ask’ price are different. This difference constitutes the revenues that brokers earn, and is called the spread. Below is the spread charges for ECN and STP brokers for CAD/MYR pair.

ECN: 4 pips | STP: 9 pips

Fees

Fees represent the charges that brokers impose on forex traders when opening a position. These charges vary on the ECN account, depending on your forex broker. STP accounts usually do not charge fees for trading.

Slippage

Sometimes we intend to complete a trade with a prevailing price, but instead, the trade is executed at a different price. The difference between the two prices is slippage, and it is a result of market volatility and your broker’s speed of execution.

Trading Range in the CAD/MYR Pair

The trading range shows the volatility of a currency pair across different timeframes from minimum to the maximum expected volatility. The knowledge of market volatility can help a trader estimate possible gains or losses for different timeframes. Let’s say that the maximum volatility for the CAD/MYR pair at the 1-hour timeframe is 20 pips. A forex trader trading one standard lot of this pair can expect to gain or lose $64.2

Below is the trading range for the CAD/MYR pair.

The Procedure to assess Pip Ranges

  1. Add the ATR indicator to your chart
  2. Set the period to 1
  3. Add a 200-period SMA to this indicator
  4. Shrink the chart so you can determine a larger period
  5. Select your desired timeframe
  6. Measure the floor level and set this value as the min
  7. Measure the level of the 200-period SMA and set this as the average
  8. Measure the peak levels and set this as Max.

CAD/MYR Cost as a Percentage of the Trading Range

When the cost of trading is expressed as a percentage of the trading range, it can help a forex trader implement proper risk management measures. Below are cost analyses of the CAD/MYR pair for both the ECN and the STP accounts.

ECN Model Account

Spread = 4 | Slippage = 2 | Trading fee = 1

Total cost = 7

STP Model Account

Spread = 9 | Slippage = 2 | Trading fee = 0

Total cost = 11

The Ideal Timeframe to Trade CAD/MYR

In both the ECN and STP accounts, the 1-hour timeframe during minimum volatility of 0.1 pips has the highest trading cost. Generally, the 1H, 2H, 4H, and daily timeframes have higher trading costs compared to the weekly and the monthly timeframes. Therefore, longer-term traders of the CAD/MYR pair enjoy lesser trading costs.

However, the intraday traders can reduce their trading costs by initiating trades when the volatility for the 1H, 2H, 4H, and daily timeframes is above average. They can further lower these costs by using the forex limit orders, which eliminates the slippage costs. Here’s an example with the ECN account.

ECN Account Using Limit Model Account

Total cost = Slippage + Spread + Trading fee

= 0 + 4 + 1 = 5

You can notice that the overall trading costs have reduced when the limit orders are used. For example, the highest trading cost has been lowered from 118.64% to 84.75% of the trading range. Cheers.

Categories
Forex Assets

Asset Analysis – Trading Costs Involved While Trading The CAD/AED Currency Pair

Introduction

CAD/AED is a Forex exotic currency pair, where CAD represents the currency of Canada, an AED is the currency of the UAE. In this exotic currency pair, CAD is the base first, and AED is the second currency.

Understanding CADAED

This pair’s price determines the value of AED, which is equivalent to one CAD. We can term it as 1 CAD per X numbers of AED. For example, if the CAD/AED pair’s value is at 2.8007; therefore, we need almost 2.8007 AED to buy one CAD.

CADAED Specification

Spread

In every financial market, Spread represents the difference between the Bid and Ask. It is usually a charge that is deducted by the forex broker. This value changes with the type of execution model.

Spread on ECN: 10 pips | Spread on STP: 15 pips

Fees

The trading fees in the forex market and stock market are the same. It is deducted from the traders’ accounts as soon as they open a new position. Note that STP accounts do not charge anything, but a few pips charges on ECN accounts.

Slippage

Slippage happens when price opens above or below the execution level. Slippage occurs because of two important reasons – market volatility and broker’s execution speed.

Trading Range in CADAED

Procedure to assess Pip Ranges

  1. Add the ATR indicator to your chart
  2. Set the period to 1
  3. Add a 200-period SMA to this indicator
  4. Shrink the chart so you can assess a large time period
  5. Select your desired timeframe
  6. Measure the floor level and set this value as the min
  7. Measure the level of the 200-period SMA and set this as the average
  8. Measure the peak levels and set this as Max.

CADAED Cost as a Percent of the Trading Range

The volatility values on the above table indicate how the cost varies with the change in market volatility. All we did is to get the ratio between the total cost and the volatility values and converted them into percentages.

ECN Model Account 

Spread = 10 | Slippage = 5 | Trading fee = 8

Total cost = Spread + Slippage + Trading Fee

= 10 + 5 + 8 = 23

STP Model Account

Spread = 10 | Slippage = 5 | Trading fee = 0

Total cost = Spread + Slippage + Trading Fee

= 10 + 5 + 0 = 15

The Ideal way to trade the CADAED

The CADAED is an exotic cross currency pair with higher volatility and liquidity. Because of this, traders may find it easy to trade in this pair. We can see that the percentage values above where the value did not move above 230% that represents a higher trading cost in the lower timeframe. However, when we move to the monthly timeframe, the average cost came to below 2%.

Therefore, trading intraday in this currency pair is risky due to the high trading cost. On the other hand, trading in a higher timeframe has less cost, but it requires a lot of patience and time. Overall, for every trader, it is recommended to stick on trading where the trading cost is at the average value.

Another way to reduce the cost is to place a pending order as ‘limit’ and ‘stop’ instead of ‘market.’ In that case, there will be no slippage in the calculation of the total costs. So, in our example, the overall cost will be reduced by five pips.

STP Model Account (Using limit orders) 

Spread = 10 | Slippage = 0 | Trading fee = 0

Total cost = Spread + Slippage + Trading Fee

= 10 + 0 + 0 = 10

Categories
Forex Assets

Analyzing The CAD/DKK Forex Exotic Currency Pair

Understanding CADDKK

CADDKK is an exotic currency pair where CAD is the major currency Canada and DKK is the currency of Denmark. In this currency pair, CAD is the first currency, and DKK is the quote currency.

The price of CADDKK determines the value of DKK that is equivalent to one CAD. We can term it as 1 CAD per X amount of DKK. For example, if the CADDKK pair’s value is at 4.7712, we need almost 4.7712 DKK to buy one CAD.

CADDKK Specification

Spread

When we subtract the Bid price and the Ask price, we will find the Spread. Spread is a trading cost that is controlled by the broker. Therefore, traders don’t have to do anything with this. This value changes with the change in execution.

Spread on ECN: 19 pips | Spread on STP: 24 pips

Fees

Trading fees in the forex market is the cost that the broker takes from traders. It is automatically deducted from traders’ trading account. Note that a few pips charges on ECN accounts but there is no fee on STP.

Slippage

Spread is the difference between the execution level and the open price level when it is an excessive level of volatility in the price. Market volatility and execution speed of your broker mainly contributes to the degree of slippage.

Trading Range in CADDKK

Procedure to assess Pip Ranges

  1. Add the ATR indicator to your chart
  2. Set the period to 1
  3. Add a 200-period SMA to this indicator
  4. Shrink the chart so you can assess a large time period
  5. Select your desired timeframe
  6. Measure the floor level and set this value as the min
  7. Measure the level of the 200-period SMA and set this as the average
  8. Measure the peak levels and set this as Max.

CADDKK Cost as a Percent of the Trading Range

With the volatility, values provide an indication of how the cost varies with the change of volatility. We got the ratio between the cost and volatility and converted into percentages.

ECN Model Account 

Spread = 19 | Slippage = 5 | Trading fee = 8

Total cost = Spread + Slippage + Trading Fee

= 19 + 5 + 8

Total cost = 32

STP Model Account

Spread = 19 | Slippage = 5 | Trading fee = 0

Total cost = Spread + Slippage + Trading Fee

= 19 + 5 + 0

Total cost = 24

The Ideal way to trade the CADDKK

The CADDK is an exotic currency pair with stable volatility in the price. Therefore, it may provide a decent movement even in intraday trading. The percentage of values did not move above 64%. Therefore, we can say that that CADDKK is nicely tradeable even if in the lower timeframe. However, the trading risk is an essential factor that most of the traders should consider while making a trading decision.

Overall all traders should trade when the cost is at an average value. The increase in volatility is risky for the possibility of unwanted stop loss hit, while the decrease in volatility might make trading worthless. To reduce the cost, furthermore, you can place either a ‘limit’ or ‘stop’ order. In this case, there will be no slippage, and in this example, our total cost will be reduced by five pips.

STP Model Account (Using Limit Orders)

Spread = 19 | Slippage = 0 | Trading fee = 0

Total cost = Spread + Slippage + Trading Fee

= 19 + 0 + 0

Total cost = 19

Categories
Forex Assets

Analyzing The Costs Involved While Trading The CAD/NOK Exotic Pair

Introduction

CADNOK is a Forex currency pair, where CAD is the official currency of Canada, and NOK is the native currency of Norway. In this exotic pair, CAD is the base currency, and NOK is the quote currency.

Understanding CADNOK

This pair’s price determines the value of NOK, which is equivalent to one CAD. We can quote it as 1 CAD per X numbers of NOK. For example, if the CADNOK pair’s value is at 6.7135, it means we need almost 6.7135 NOK to buy one CAD.

CADNOK Specification

Spread

In forex trading, Spread indicates the difference between the Bid price and the Ask prices. Traders don’t have to do anything with this as it is deducted by the broker. This value changes with the type of execution model used for executing the trades. Below are the ECN and STP spread values of this currency pair.

Spread on ECN: 39 pips | Spread on STP: 44 pips

Fees

The trading fees that forex brokers take are similar to other financial markets. It is deducted from the traders’ accounts when they take a trade. Note that STP accounts do not take any charge, but a few pips are charged in ECN accounts.

Slippage

Slippage happens when a trader opens a trade at a price, but it opens at another price by expanding the Spread. The main reason to occur slippage is the market volatility and the broker’s execution speed.

Trading Range in CADNOK

The trading range is the representation of the minimum, average, and the maximum volatility of this pair on the 1H, 4H, 1D, 1W, and 1M timeframe. Using these values, we can assess our profit/loss margin of trade. Hence, this proves to be a helpful risk management tool for all types of traders.

Procedure to assess Pip Ranges

  1. Add the ATR indicator to your chart
  2. Set the period to 1
  3. Add a 200-period SMA to this indicator
  4. Shrink the chart so you can assess a large time period
  5. Select your desired timeframe
  6. Measure the floor level and set this value as the min
  7. Measure the level of the 200-period SMA and set this as the average
  8. Measure the peak levels and set this as Max.

CADNOK Cost as a Percent of the Trading Range

If we look at the volatility values from the above table, we can see how the cost changes with the change in volatility. We have provided the ratio between the cost and the volatility values into percentages.

ECN Model Account 

Spread = 39 | Slippage = 5 | Trading fee = 8

Total cost = Spread + Slippage + Trading Fee

= 39 + 5 + 8

Total cost = 52

STP Model Account

Spread = 39 | Slippage = 5 | Trading fee = 0

Total cost = Spread + Slippage + Trading Fee

= 39 + 5 + 0

Total cost = 44

The Ideal way to trade the CADNOK

The CADNOK is an exotic currency pair that has enough liquidity. As a result, traders may find it easy to trade in this exotic currency pair. The percentage values from the above table did not move above 138%, which is an indication of less volatility. However, the Percentage of trading cost is lower in the higher timeframe.

Therefore, traders should be cautious to determine the price where trading is suitable. An increase in volatility is risky, while the decrease in volatility is less profitable. Therefore, the best time to trade in this pair is when the volatility remains at the average value.

Furthermore, another way to reduce the cost is to place a pending order as ‘limit’ and ‘stop’ instead of ‘market.’ In that case, the slippage will not be considered in the calculation of the total costs. So, the total cost will be reduced by five pips.

STP Account Using Limit Model Account

Spread = 39 | Slippage = 0 | Trading fee = 0

Total cost = Spread + Slippage + Trading Fee

= 39 + 0 + 0

Total cost = 39

Categories
Forex Signals

EURCAD Piercing Pattern and Breakout

EURCAD has been moving in a slightly descending channel, here shown as a linear regression channel.  The last iteration of the Price drove it from the top of it to near the bottom. There, it made a double bottom figure and headed up again. After being rejected by the central regression line (dotted line), the Price retraced slightly, then, four hours ago, The Price made a piercing candlestick followed by a large candlestick that went above the last high.

A trade can be made with the entry at 1.5191, a stop below the recent low (1.5110), and a profit target neat the last high of 1.5374. for a reward/risk ration of over 2.

The technical factors ate in favor of the trade. The price moves above the +1 sigma line of the Bollinger bands, and the bands are heading up. Also, the Stochastic oscillator has triggered a buy signal near the oversold level.

The Setup

Buy Entry: 1.5191

Stop-loss:1.5110 or lower

Take-profit: 1.5374

Reward/Risk: 2

Dollar risk: $575 on one lot. $57.5 on a mini lot, and $5.75 on a micro lot

Dollar reward: $1,150 on a lot.

It is recommended not to go above 1 percent of your balance in a single position. Thus, traders should not take more than two micro lots for every $1000 in their trading account.

Categories
Forex Signals

CADJPY triple bounce off the upper linear regression channel boundary

The Setup

Fig 1 – CADJPY triple bounce off the upper linear regression channel boundary

CADJPY has been obeying a slightly descending linear regression channel. On the 60 min chart, the ± 2 sigma lines are shown in blue, whereas the regression line, is shown in dotted white. In that chart, we can observe that the price has bounced three consecutive times off that line, and now, in its third bounce, it also pierced its 50-hour SMA to the downside.

A trade can be created with an entry at the current price and a target neat the bottom of the channel, for an excellent reward to risk factor. The rationale for this type of trade is the following. On channels like that, the odds of a reversal from a 2 sigma line is high, at least 95% of the time. The issue here is the reversal is strong enough to reach our target? Usually, it is highly likely a movement to touch the mid of the channel, but, since here the channel is descending, the odds of it moving to the bottom is higher. We will follow this trade, though, and adapt our stop-loss level and take profit as we see how the bearish momentum evolves.

Key Levels

  •         Entry: 76.495
  •  Stop-Loss: 76.895
  • Take-profit: 75.295
  • Reward/Risk: 3

Dollar Risks and Rewards

Risk: 40 pips = $372 per lot, or $37.2 per mini lot.

Reward: 120 pips = $1,117 per lot, or 111,7 per mini lot


Categories
Forex Assets

Understanding The AUD/CAD Forex Currency Pair

Introduction

AUDCAD is the abbreviation for the currency pair, the Australian dollar, and the Canadian dollar. It is a cross-currency pair. One can expect great volatility and liquidity in the market during the Australian session. AUD is the base currency, and CAD is the quote currency.

Understanding AUD/CAD

The value of AUDCAD is the number of Canadian dollars required to buy one Australian dollar. It is quoted as 1 AUD per X CAD. For example, if the value of this pair is 0.9013, then 0.9013 CAD is needed to purchase one AUD.

AUD/CAD Specification

Spread

Spread in trading is the difference between the bid price and the ask price set by the broker. This pip difference is how brokers generate revenue. The spread always varies from broker to broker and the type of account model.

ECN: 1 | STP: 1.9

Fees

Apart from spreads, brokers charge a few pips of fee or commission on each trade you take. This exists only ECN accounts, as a fee on STP accounts is nil.

Slippage

Due to the delay in the broker’s execution speed and volatility of the market, a trader doesn’t get the exact price he intended. This difference in prices is referred to as slippage. It typically varies from 0.5 pips to 5 pips.

Trading Range in AUD/CAD

The trading range is the representation of the minimum, average, and maximum volatility in the market in a given timeframe. This proves to be useful in determining the profit/loss that can be made in a specific amount of time. One can determine this simply by finding the product of the pip movement on the required timeframe and the pip value (mentioned in the specification table).

Procedure to assess Pip Ranges

  1. Add the ATR indicator to your chart
  2. Set the period to 1
  3. Add a 200-period SMA to this indicator
  4. Shrink the chart so you can assess a large time period
  5. Select your desired timeframe
  6. Measure the floor level and set this value as the min
  7. Measure the level of the 200-period SMA and set this as the average
  8. Measure the peak levels and set this as Max.

AUD/CAD Cost as a Percent of the Trading Range

The cost of trade is an essential point of consideration in trading. Cost is that factor that is not fixed and varies on different variables. For example, when the volatility changes, the costs change. The same is the case with timeframes as well. Below is a table that illustrates the variation in the costs on a trade for different timeframes and volatilities.

ECN Model Account

Spread = 1 | Slippage = 2 |Trading fee = 1

Total cost = Slippage + Spread + Trading Fee = 2 + 1 + 1 = 4

STP Model Account

Spread = 1.9 | Slippage = 2 | Trading fee = 0

Total cost = Slippage + Spread + Trading Fee = 2 + 1.9 + 0 = 3.9

The Ideal way to trade the AUD/CAD

Comprehending the above tables is simple. The higher the magnitude of the costs, the higher is the total cost that has to be paid on a trade and vice versa. In the table, the percentages are on the higher side in the min column and lower in the max column. Hence, it can be concluded that the costs are higher when the volatility is low and vice versa. However, it isn’t ideal to trade in these situations. It is rather preferred to enter the market when the volatility is around the average values because the costs are affordable, and the volatility is as needed.

Moreover, it is recommended to design strategies such that limit orders are put to use. This shall completely eliminate the slippage on the trade. And with the elimination of slippage, the total cost would significantly reduce as well.

Categories
Forex Assets

Exploring The Basics Of GBP/CAD Forex Pair

Introduction

GBPCAD pronounced as ‘pound cad” is minor/cross currency pair in forex. GBP refers to Great Britain Pound, and CAD refers to the Canadian Dollar. Since GBP is on the left, it becomes base currency, and CAD on the right becomes the quote currency.

Understanding GBP/CAD

The current market price has of GBPCAD is not similar to the prices in the stock market. The value of GBPCAD represents the value of CAD equivalent to one GBP. It is simply quoted as 1 GBP per X CAD. For example, if the value of GBPCAD is 1.7192, then 1.7192 Canadian dollars are required to purchase one pound.

GBP/CAD Specification

Spread

Spread is the difference between the bid price and the ask price in the market. These values are controlled by the brokers. So, it differs from broker to broker as well as the type of account.

ECN: 0.8 | STP: 1.9

Fees

There is a small levied by the broker on every trade a trader takes. There are a few pips of fee on ECN accounts, while the fee is nil on STP accounts. The fee is usually between 6 to 10 pips.

Slippage

Slippage is the difference between the trader’s demanded price and the real executed price. Slippage happens when orders are executed by the market price. It happens solely due to the volatility of the market and the broker’s execution speed.

Trading Range in GBP/CAD

A trading range is the representation of the pip movement of GBPCAD in different timeframes. These values are helpful in getting a rough idea of the profit/loss that can be made from the trade in a given timeframe. For example, if the min pip movement on the 1H timeframe is 3 pips, then a trader can expect to gain/lose at least $22.38 when one standard lot is traded.

Procedure to assess Pip Ranges

  1. Add the ATR indicator to your chart
  2. Set the period to 1
  3. Add a 200-period SMA to this indicator
  4. Shrink the chart so you can assess a large time period
  5. Select your desired timeframe
  6. Measure the floor level and set this value as the min
  7. Measure the level of the 200-period SMA and set this as the average
  8. Measure the peak levels and set this as Max.

GBP/CAD Cost as a Percent of the Trading Range

Now that we know how much profit/loss can be made within a given time frame let us also calculate the cost on each trade by considering the volatility and timeframe. For this, the ratio between the total cost and volatility calculated and expressed in percentages. The magnitude of these percentages will then be used to determine the timeframe with marginal costs.

ECN Model Account 

Spread = 0.8 | Slippage = 2 |Trading fee = 1

Total cost = Slippage + Spread + Trading Fee = 2 + 0.8 + 1 = 3.8

STP Model Account

Spread = 1.9 | Slippage = 2 | Trading fee = 0

Total cost = Slippage + Spread + Trading Fee = 2 + 1.9 + 0 = 3.9

The Ideal way to trade the GBP/CAD

From the above two tables, it can be ascertained that the percentages largest on the min column, moderate on the average column, and least on the max column. The higher the value of percentages, the higher is the cost of the trade. So with this, we can conclude that the costs are high during low volatility, and low during high volatility. Similarly, the costs are high on lower timeframes and considerably low on higher timeframes. Hence, to keep volatility and cost at a balance, it ideal to trade when the pip movement in the market is around the average values.

Market orders bring in an additional cost in the trade. To eliminate this, one can trade using limit orders. This will set the slippage value to 0, and eventually, reduce the total cost on the trade by a significant amount. An example supporting the statement is illustrated below.

Total cost = Spread + trading fee + slippage = 0.8 +1 + 0 = 1.8

Categories
Forex Market Analysis

Daily FX Brief, October 04 – Major Trade Setups – Buckle Up for NFP Event!

Daily FX Brief, October 04 – Major Trade Setups – Buckle Up for NFP Event! 

On Friday, the U.S. dollar index continues to weaken ahead of the U.S. NFP data, which is due in the New York session today. Lately, the Institute of Supply Management (ISM) released the Purchasing Manager Index (PMI) for Non-Manufacturing Goods as 51.6 against the expected 55.0 for September. 

The data showed that it fell to a 3-Year low this month. The release of weak indices of the Manufacturing and Non-manufacturing sector this week indicates the slow growth of the economy in the U.S. Consequently, we are seeing less growth in the U.S. dollar today.

Economic Events to Watch Today

Let’s took at these fundamentals.


EUR/USD – Daily Analysis

During the early Asian session, the EUR/USD currency pair hit the bullish track for the 4th consecutive day due to all-important United States Nonfarm Payroll data.

As of writing, the EUR/USD currency pair presently trading at 1.0978, hit the high level of 1.0984 and showing 0.13% gains on the day. The pair maintained its gains for the 4th consecutive session.

On the other hand, all traders are presently expecting more than 80% odds of the rate cut by the 25-basis-points at the Federal Reserve next meeting later this month. The expectations were 64% on Wednesday, and 40% were on Monday, and currently reached 80% so far.

The increasing probabilities of an October Federal reserve rate cut also support the bullish track put forward by the hourly chart golden crossover.

At the U.S. Payroll front, the data is scheduled to release at 12:30 GMT an expected to show the economy added 145,000 jobs during the September after the 130,000 additions during the August. Besides this, the Average Hourly Earnings are found while increasing by 3.2% year on year, and the jobless rate is estimated to stay flat at 3.7%.

Whereas, the sluggish data will prop the dovish Federal Reserve expectations and pushing the greenback lower across the board.

As in consequences, probably the EUR/USD pair will come under pressure and possibly hit the low level of 1.09 if the data beats forecasted figures by a considerable margin.   


Daily Support and Resistance


S3 1.0823

S2 1.0883

S1 1.0921

Pivot Point 1.0943

R1 1.0981

R2 1.1002

R3 1.1062

EUR/USD – Trading Tips

Before Non-farm payrolls, the EUR/USD is consolidating in a narrow range. Investors await for NFP and trying to stay out of the market until the actual figure is out. The 50-hour moving average (M.A.) had a hit above the 200-hour M.A., confirming a golden crossover – a buyer market sign. Therefore, the pair seems set to maintain the continuous recovery rally from recent lows near 1.0880. 

Consider staying bullish above 1.0970 to target 1.1040. The bearish target can be set at 1.0880. 


USD/JPY – Daily Analysis

The USD/JPY closed at 106.910 after placing a low of 106.480 on Thursday. With no economic release from japan side, the movement of USD/JPY solely depended on U.S. dollars on Thursday. The weak ISM Non-Manufacturing PMI at 19:00 GMT indicated a slowdown in the economic activity of the United States by coming as 52.6 against 55.1 expected. This raised the concerns of the U.S. falling under recession after the continuous disappointing economic releases from the U.S. for three consecutive days. 

On Wednesday U.S. Private sector showed that the hiring made by them in September was not satisfactorily affected by the trade disputes prevailing between U.S. & China.

Concerning trade disputes, on Wednesday, there was another announcement from Trump’s administration related to the Tariffs on European Goods. 

With the increased chances of U.S. economic slowdown and a third rate cut by Federal Reserve in upcoming policy meeting, the U.S. Dollar faced pressure for 3rd consecutive day and has made USD/JPY to move in Bearish Trend.

Other economic releases from the United States on Thursday were, the Unemployment Claims at 17:30 GMT, came as 219K against 215K expected, weighed the U.S. Dollar. At 18:45 GMT, the Final Services PMI came as expected 50.9. The Factory Orders came in favor of U.S. Dollar as -0.1% against -0.5% expected.


Daily Support and Resistance 

S3 105.7

S2 106.53

S1 106.86

Pivot Point 107.37

R1 107.69

R2 108.2

R3 109.04

USD/JPY – Trading Tips

The USD/JPY continues to trade bearish after violating the bullish channel on the 240 mins chart. The USD/JPY is now holding below 50 periods EMA, which is suggesting bearish bias among traders. 

On the lower side, the USD/JPY is likely to gain support at 106.400 area. The MACD and RSI are holding below 0 and 50, suggesting odds or more bearish bias in the USD/JPY. Let’s stay bearish below 107 to target 106.400 today. 


GBP/USD – Daily Analysis

The GBP/USD currency pair hit the high level of 1.2350 and maintains the recovery rally, as worries about the U.S. fundamentals weighing over the Brexit news.

The US ISM Non-Manufacturing Purchasing Managers Index PMI is entering the previous manufacturing level from the same surveyor. Besides, the increased level of uncertainty coming from the survey has extended pullback in the greenback from the 2-year highs.

On the other hand, the GBP/USD pair trades started the day with headlines concerning the European Union. The EU has given 7-days more to the United Kingdom Prime Minister Boris Johnson to announce a better offer. The Tory leader could increase the support of thirty-labour rebels that supports the Breit deal.

Later in the day, investors will keep their eyes on the September month employment data, namely Nonfarm Payrolls (NFP), Unemployment Rate, and Average Hourly Earnings. After the news report, the eyes will remain on the U.S. Federal Reserve Chairman Jerome Powell’s speech at the “Federal Reserve the meeting.


Daily Support and Resistance


S3 1.2088

S2 1.2186

S1 1.2242

Pivot Point 1.2283

R1 1.234

R2 1.2381

R3 1.2479

GBP/USD – Trading Tips

On the technical view, the 130-pip area between 50-day and 21-day simple moving averages (SMA), 1.2250, and 1.2380, respectively, may keep the pair’s trading moves limited. Today, consider staying bullish above 1.2330 to target 1.2400 and 1.2500. Whereas, the GBP/USD may remain bearish below 1.2330 to target 1.2275 and 1.2230. 

 All the best! 


Categories
Forex Market Analysis

Today’s Canadian Data Disappoints – But Only Slightly

Canada’s merchandise trade deficit narrowed to CAD 1.9 billion in April of 2018 from a downwardly revised CAD 3.9 billion in March and well below market expectations of a CAD 3.4 billion gap.

Exports increased 1.6 percent, boosted by higher sales of metal and non-metallic mineral products, consumer goods and energy products.

Meantime, imports declined 2.5 percent, after reaching a record high in March, mainly due to lower purchases of motor vehicles and parts and consumer goods.

FX market:-

USDCAD rose 27 pips on the release wiping out some modest loonie gains, whilst popping the pair to just above the 1.29 handle.


Categories
Forex Market Analysis

Daily Market Update: Easing on Italy’s Politics, CAD Rate Statement, and Possible US Tariffs on EU


News Commentary


The Euro gained on Thursday as Italian parties renewed attempts to form a government, to calm down the concerns about the wider impact of a political crisis in Europe’s third-largest economy.

The two anti-establishment parties have made many efforts to form a coalition government, rather than force Italy into holding elections for the second time this year in September.

The CPI flash estimate enhanced the regains of the Euro after a reading of 1.9% more than the forecast, which was 1.6%, along with the core reading of 1.1% more than the forecast which was 1.0%.

Bank of Canada Governor Stephen Poloz left rates on hold for a third straight decision on Wednesday at 1.25%, but gave a hawkish statement for the economy and removed some cautious language.

The central bank also clarified that recent economic data bolsters its April outlook for a 2% growth in the first half of 2018.

All eyes will be on GDP at 12:30 GMT with the expectation of 0.2% after the last reading of 0.4%. Any higher than expected would reinforce the optimism bias.


Australia reported worse than expected Capex data. Private capital expenditures rose only 0.4% in the first quarter against 1.0% estimated and 0.2% from the fourth quarter of last year.


Negative data came from the US yesterday as ADP Non-Farm Employment Change released lower than expected figures with 178K. Along with prelim GDP which came in at 2.2%, lower than the forecast and the previous reading at 2.3%.


There’s some news that Washington will announce plans to put tariffs on Eurozone steel and aluminium imports, sources said.

They said the announcement was planned for Thursday morning in Washington but that the timing could still change. Commerce Secretary Wilbur Ross told the French daily newspaper, Le Figaro it would be announced either before markets opened or after they closed.

While not confirming for sure that the U.S. would decide to force tariffs, he said: “It’s up to the European Union to decide if it wants to take retaliatory measures. The next question would be: how will the U.S. President Donald Trump react? You saw his reaction when China decided to retaliate.”


Chart Analysis


USD/CAD

On the daily chart, as we expected the price had made its way into the resistance zone of 1.289-1.298, almost reaching the key resistance at 1.309, with an approach from the descending trend line starting from the high of 2015, and the upper edge of the horn pattern.

The price has already bounced beneath the key resistance and the resistance zone, to take the price firstly to the support level at 1.274.


AUD/USD

On the daily chart, the price had a false break beneath the support zone 0.75-0.7535 with a pin bar.

That enhances the AB=CD harmonic pattern, with breaking a descending channel.

The pair rose with an engulfing candle from the support zone.

Along with divergence in RSI, the price is ready for the next move up to 0.774 which is a level with a combination of the lower trend line from the high of 2018 and the broken uptrend.


AUD/JPY

On the daily chart, as we expected, the price reached the resistance zone at 84-84.35.

The price couldn’t break through this area to bounce back.

It reached the support levels at 81.25-80.5 (as we expected also) to pull back up again boosted by the ascending trend from the low of March.

As the pair is currently moving sideways. The price is expected to retest the resistance zone again.


Categories
Forex Market Analysis

Canadian Dollar Interest Rate Decision

The Canadian central bank maintained its overnight policy rate at 1.25% today and there were no surprises on the data release as some overnight swap rates had suggested a 90% chance of no change. Although there is a broad-based view that markets are pricing in a 25bps rate hike by October.

The Loonie had lost some ground against the greenback over recent days, which was largely due to an easing in oil prices and a firmer USD. Spot USDCAD had lifted to 1.3040 overnight but dipped down to 1.2952 prior to the news release on firmer WTI and Brent crude oil prices today, before moving above the 1.30 handle prior to the data release.

With NAFTA nowhere closer to a resolution, the Loonie has struggled to find firmer ground recently. However, just after the news release USDCAD plummeted to 1.2880 at the time of writing. This was highly likey due to the BoC dropping its reference to being ‘cautious’ on rates.

Categories
Forex Market Analysis

Volatility moves towards Europe

Hot Topics:

  • S. Core PPI (YoY) reaches the highest level since 2012.
  • Volatility moves towards Europe.
  • The pound rally continues due to the weakness of the dollar.
  • Jinping reduces risks of a Trade War.
  • Oil Brent reaches the highest level since 2014.

U.S. Core PPI (YoY) reaches the highest level since 2012.

The signs of strength in the economic growth of the United States continue, the Underlying Producer Price Index (YoY) reached 2.7% in the March period, the highest level since June 2012. The Core PPI (MoM) index, for its part, it reached 0.3% on the expectations of analysts who projected 0.2%. According to the Bureau of Labor Statistics, 70% of the increase in final demand is attributed to a rise of 0.3% in the prices of final demand services, in the same way, transport and storage services for final demand increased by 0.6 %. The increases in the level of inflation for producers are expected to have an impact on the Consumer Price Index, which will be published this Thursday.

Despite these positive macroeconomic data, the greenback index continues its strong depreciation, which has lost 2.83% in the year. Today is closing with -0.25% of loses. We are paying attention to the zone between 89.15 and the 61.8% of Fibonacci retracement level, where the Index has found support.

Volatility moves towards Europe.

The risks of the Trade War between the United States and China are disappearing more and more with the bilateral attempts to resolve the conflict in a friendly way. However, in Europe, the scenario that seemed full of geopolitical stability is changing. This Sunday 08, Viktor Orban won the elections in Hungary for the fourth time in a row. With an utterly autocratic speech, the nationalist Prime Minister proposes an anti-immigrant policy and open attacks towards the European Union. Hungary refuses to comply with the agreed European migration policy, that is, accept quotas of Syrian refugees, in the same way as the United Kingdom raised in one of its arguments against Brexit. It should be added that Mr Orban is not alone in this political tendency; he has found allies in power in Poland, the Czech Republic, Slovakia and Italy. All of them are willing to reject the obligation to accept refugees and respect the right of free movement.

The euro has closed with gains for the third consecutive session with a 0.29% of advance. The pair shows a bullish move in the middle of a sideways formation. In the last trading session, the price has found resistance at 61.8% of Fibonacci retracement

The pound rally continues due to the weakness of the dollar.

The pound continues for the third consecutive session in a bullish rally advancing 0.64% in the week and has gained 0.35% in the last trading session. All this occurs in the context of the weakness of the dollar despite the excellent macroeconomic data of the United States. The level of support to be controlled is 1.4145; the key resistance level is 1.42 as a psychological level.

Jinping reduces risks of a Trade War.

Chinese President Xi Jinping has promised to reduce import tariffs by alleviating the fear generated by the escalation of bilateral tensions between the United States and China. In a speech held at the Boao Forum, President Jinping promised to open the Chinese economy further, protect the intellectual property of foreign companies. These words filled the market with optimism, leading the indexes to move positively, the Dow Jones Index advanced 1.48%, while the yen reduced its attractiveness as a refuge, leading the USD-JPY to close with 0.41% of earnings.

The USD-JPY pair is forming an ascending diagonal pattern, which still has space to follow a rally, the closest resistance levels are 107.49 and 108, and the support level to control is 106.64.

The Dow Jones index, which is within a descending channel, the price is for the control support level at 24,037.3 and is developing a possible upward diagonal formation whose closest resistance is at 24,630, a level that coincides with the Upper part of the bearish channel. Bullish positions are valued as long as they do not fall below the 23,749.3 level.

Oil Brent reaches the highest level since 2014.

The euphoria of the reduction of the economic tensions between the United States and China due to the sayings of Jinping, not only has motivated to the indices but also the oils. The Brent has reached its highest level since 2014, reaching the $ 71.03. Crude Oil, on the other hand, approached two-week highs reaching $ 65.76. The oil rally and the Dollar weakness also benefited to the pair USD-CAD (by inverse correlation) which closed at lowest levels since February testing the psychological level 1.26 approaching the level of Fibonacci retracement 61.8% at 1.2583.

Our central view for this highly correlated group has been bullish; but we currently prefer to maintain a neutral position considering that once the oils reach specific levels in the long term for their structures, they should make a significant corrective movement that will allow us to join to the trend. As long as Brent does not reach the area between $ 71.26 and $ 72.91, and Crude Oil does not come close to $ 69 and $ 70, we do not expect a start of a significative correction.

In the case of the USD-CAD pair, once it reaches the base of the channel, it is expected that a bullish move could begin.

©Forex.Academy


Categories
Forex Market Analysis

WEEKLY FORECAST 5th – 9th February 2018.

Weekly Forecast Hot Topics:

  • NZD – Waiting for the optimism of the market to be replicated with the decision of the RBNZ.
  • AUD – No big expectations in the next monetary policy decision.
  • CAD – Continuity in the strengthening of the labour market.

Weekly performance

This week, the best performer was the Euro <EUR> (0.22%), pushed by the positive data on inflation and industrial activity. The worst performer was Aussie <AUD>,  its losses reach¡ng 2.22% due to weak inflation Australian data and the stronger US employment data. Those led to boost the Dollar <DOLLAR> (0.17%) and reverse the losses that were dragging in the week.


NZD – Waiting for the optimism of the market to be replicated with the decision of the RBNZ.

Last week the New Zealand Trade Balance (MoM) reported a historic surplus of $640M, the highest value since March 2015. The main factor contributing to this increase has come from dairy products exported to their principal trading partner, China.

This week, the leading data for the Kiwi will come from the employment indicators (QoQ) and the RBNZ interest rate decision. The unemployment figure is expected to increase slightly from 4.6% in October 2017 to 4.7%. As for the interest rate decision, no big surprises are expected, analysts expect the RBNZ to keep the interest rate at 1.75%.

Technically, we expect more downside moves for the Kiwi. In EURNZD we observe a bullish continuation that could reach 1.7174 before it starts a bearish sequence.

EUR-NZD 4-hour chart ( click on the image to enlarge)

AUD – No big expectations in the next monetary policy decision.

During the last trading period, inflation data (YoY) was published, which was expected to be equal to or higher than 2%. However, it did just reach 1.9%, baffling the market and removing the possibility of a new increase in the interest rate by the RBA.

For this week, the most expected event for the Aussie will be the monetary policy decision, in which no changes are expected in the current rate that is set at 1.5%.

On the technical level, we still expect weakness in the Aussie group before starting a new strengthening of the oceanic currency. In the EURAUD, we expect the price to reach the 1.6026 level, where it could complete a higher grade connector and start a new bearish cycle.

EUR-AUD daily chart ( click on the image to enlarge)


CAD – Continuity in the strengthening of the labour market.

This week will end with the publication of the Canadian employment data. Continuity in the strengthening of the labour market is expected, in the unemployment rate the estimated consensus is a slight increase that reaches 5.8%; however, current levels of unemployment are the lowest of four decades.

Technically, we continue to expect new lows for the Loonie, which could even lose the psychological support of 1.20, a large bearish cycle which started in January 2016.

USD-CAD daily chart ( click on the image to enlarge)


Categories
Forex Market Analysis

Hot Topics – December 18 to 21, 2017

Hot Topics:

  • US DOLLAR – THE BEARISH BIAS DUE TO TAX REFORM CONTINUES.
  • GBP-USD – BREXIT NEGOTIATIONS AND ECONOMIC GROWTH DRIVES STERLING.

This past week presented significant advances for the New Zealand dollar with a 2.25% advance, due mainly to the weak inflation data (YoY) shown by the American economy (1.7% vs. 1.8% expected). The increase of the interest rate by the FOMC was not enough to reverse the advance of the Kiwi.

The worst performance of the week was exhibited by the British Pound with a -0.41% loss. The BoE decided to keep the interest rate at 0.5% in the context of an increase in unemployment for a second consecutive month, reaching 4.3%. On the other hand, inflation (YoY) scored a 3.1% advance, the highest level for almost six years; specialists believe that CPI is reaching a peak and that it could mainly impact the cost of the services sector.


 US DOLLAR – THE BEARISH BIAS DUE TO TAX REFORM CONTINUES

Dollar begins a bearish week in the context of uncertainty over the approval of tax revision legislation with the aim of making American companies more competitive.

The Republican Senator Bob Corker has expressed concern about the fiscal deficit that can result from the tax cuts. Despite having a position in favour of the tax review, doubts remain in the approval of the reform, in the same way that the Senate rejected the Trump Administration’s proposal to suppress Obamacare last July.

The Greenback has broken the bullish guidance that has reached S3; there is a possibility that it will develop a bullish reversal movement up to the weekly pivot level. You can find more information in our article Finding Trade Opportunities Using Pivot Points.


GBP-USD – BREXIT NEGOTIATIONS AND ECONOMIC GROWTH DRIVES STERLING.

Economic growth and negotiations for Brexit continue to be the primary drivers of the Sterling. On Wednesday, the governor of the BoE will address the Parliament in the context of the hearing of the Select Committee of the Treasury on the November Financial Stability Report.

The British Prime Minister, Theresa May, has assured the Parliament that she is looking for the Brexit transition to be completed within two years. The first phase of the Brexit negotiations has been on the rights of EU citizens in Britain. EU members have agreed to move to the second stage, which focuses on the transition and future commercial relations. The British Parliament has urged May to stand firm in the interests of the United Kingdom, such as a previous Prime Minister, Margaret Thatcher.

Technically, the Pound is developing a corrective structure, with a bias for bullish continuation. The RSI shows a bullish divergence; however, we expect a retracement towards the weekly pivot zone and then continue with the bullish movement in the medium-long term.

 EUR-USD – CORRECTIVE STRUCTURE IN DEVELOPMENT

The single currency is developing a corrective structure; the RSI has not yet shown evidence of rupture. We expect the price to make a bearish movement in five; that means, the euro could move up to R1 and then fall to S2, thus completing a five-wave sequence.


 USD-CAD – LOONIE CONTINUES IN A SIDEWAYS RANGE MOVEMENT.

The Loonie continues in a sideways range formation, waiting for data to act as a catalyst. Most probably, the previous movement will continue to R2 (1.30 level). The RSI is forming a triangular structure that is finding resistance at level 60. The bullish bias still prevails, with the average of 9 periods under the RSI.


 NZD-USD – A PENNANT THAT COULD BE A PAUSE OF A NEW RALLY.

Last week, the Kiwi was the best currency performer with a 2.25% increase against the USD. This week it is developing a pennant pattern, manifesting a pause with further continuity of the bullish movement. The RSI, on the other hand, is forming a corrective structure. We expect a false move towards the weekly pivot, and then, continuing the upward cycle to the zone of R2 (0.715).


Categories
Forex Market Analysis

Outlook for 10.24.2017

EUR/USD

The US Dollar is hesitant as President D. Trump told reporters he is very close to a decision about who should chair the Federal Reserve, which includes current Fed Chair, Janet Yellen. It also weighs on the US currency the rumors about Trump’s plan to reform taxes.

On the Euro front, European Central Bank is expected to announce on Thursday a possible timetable for a reduction of its asset purchases, as economic data suggest the Eurozone might witness a higher than expected economic expansion in 2017. Reducing asset purchases might, likely, be accompanied with a continuation of low interest rated, as Eurozone inflation data seems to be stable

Sideways channel movement on the EUR/USD pair

The Euro 1-hour price has been trending down since Oct, 19 when it draws an almost perfect triple top (1). Yesterday it touched Oct, 18th lows and bounced from there, and piercing up the downward trendline

Overall, the EUR/USD pair seems to trade in a sideways channel, but its current price may allow for a profitable trade, with a target touching the upper trend line (fig.1).


GBP/USD

JP Morgan analysts are convinced that shorting the GBP is still the way to go

The GBP is, still, affected by the Brexit process, but no major news about it is expected today. Slower consumer expending and softening of economic sentiment press policymakers to keep interest rates unchanged, which weighs on the British currency.

Daniel Hui, a foreign exchange strategist at J.P. Morgan said that their conviction to short the GBP is still high because they felt UK rate hikes were “overpriced”, given the “weak starting point for UK growth” and the reality of a Brexit shock that keeps dominating the medium-term outlook.

There is evidence that today’s lows might be the start of a new up-leg that may carry GBP/USD prices up to, at least, the highs of this lateral channel

GBP/USD daily price is experiencing a sideways movement, after retracing more 70% of its upward movement from its lows in August 2017

Possible scenarios:

  1. Today’s lows (1.31653) might be the start of a new up-leg that may carry GBP/USD prices up to, at least, the highs of this lateral channel (1.32272), provided that prices cross over the downward trend line.
  2. If the price does not continue up and reverse near the BB mean, then the downward leg is continuing to its next floor, at 1.31, and a good reward to risk trade is possible at about 1.3177.
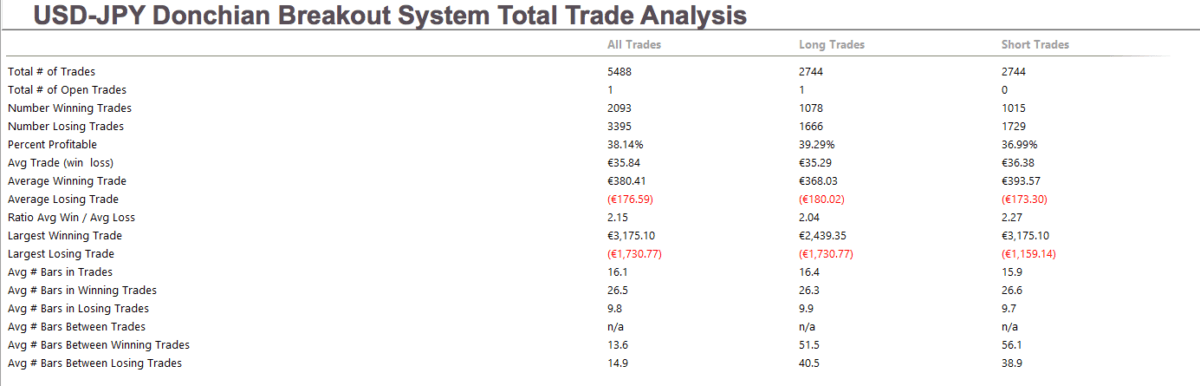

USD/JPY

Japan was in focus yesterday, as prime minister, Shinzo Abe is back in power

Japan was in focus yesterday, as prime minister, Shinzo Abe is back in power, after his victory this weekend, that drove the yen downward yesterday. Today, we see a bounce that set prices to test the highs of yesterday’s session. Tuesday, the Japanese currency, instead of focusing on Japan’s manufacturing PMI, slightly lower in October, it seems to pay more attention to interest rate differentials.

Mid-term, the USD/JPY is trading on a lateral price channel whose low is at about 107.7 and it’s high is at 114.34. Currently, the price, trading at 113.71, is moving closer to the top of that channel.

A short-term bottom at (1) in sync with the MACD signal crossover, marks the start of a new uptrend. The red 10-period BB is sloping strongly up, so prices are heading for a test of the recent highs at (3), and, potentially break them up.

The best possible action here is to scalp on a short timeframe, such as 15 min charts or shorter, being aware that we are at the highs of a mid-term channel. Long and short-swing trades must wait for a clear signal or news event


USD/CHF

The Swiss National Bank (SNB) is keeping an expansive monetary policy that drives Swiss CHF down

The Swiss National Bank (SNB) considers the CHF to be over-valued, so it is keeping an expansive monetary policy that is driving the Swiss currency down. The SNB policy of negative interest rates contributes to the downward currency trend.

To sum up, the Swiss economy is slowing down, its growth rate (+0.3%) is losing track compared to the one registered in the Eurozone (+2.3%) in the second 2017 quarter.

USD/CHF is at overbought but still strongly moving up

The USD/CHF weekly is on a sideways channel with a lower limit at 0.942, and an upper limit at 1.0365. Its current price – 0.9896- is at about the middle of this channel. On a daily and weekly basis, the price is in overbought territory.

Today the USD/CHF is trading strongly up, and its hourly chart is currently at overbought territory as well, with its price touching the 3rth Bollinger band (+3STD) (1). On such a strong trend, the best thing to do is wait for a price pullback to create a short-term support near the mean of the Bollinger bands (2) and set a long trade there.
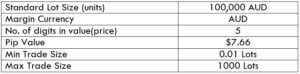

AUD/USD

Tomorrow, Australia’s quarterly inflation data will be released.

The Aussie is under pressure as the soft Chinese housing data was weaker than expected. China is a major partner for Australia, and China’s economic health shakes Australian currency for the good and the bad. The Housing Price Index grew in China by 6.3%, after an 8.3% increase in August. Next Wednesday, Australia will release its quarterly inflation figures.

AUD/USD is currently in a downtrend

The AUD/CAD pair, on a weekly chart, is moving on a downward leg, in a sideways channel that started in Jan 2015. The channel has a slight upward bias.

On the daily chart, the AUD/USD pair is down-trending after drawing a double top (July and September 2017). Actually, the price is below the -1 Bollinger Band showing that the downtrend is still in place

The most probable scenario for the AUD/USD pair is to go down to at least 0.766, or, even deeper, to touch the lower weekly trend line (0.7518). The MACD crossover to the downside confirms the bearish bias of this currency pair
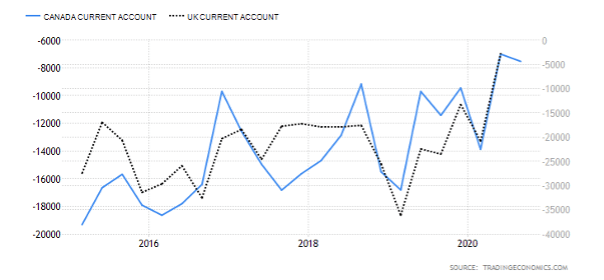
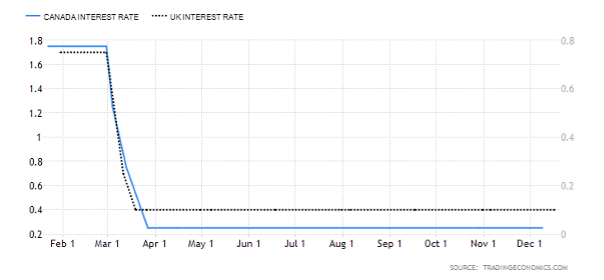
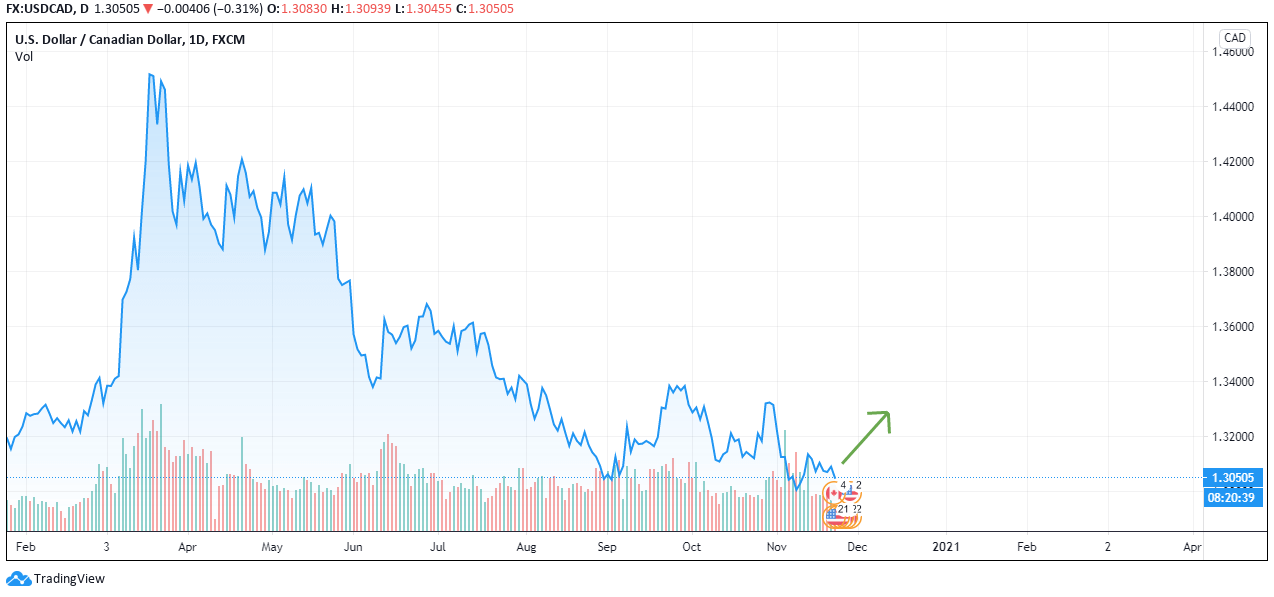
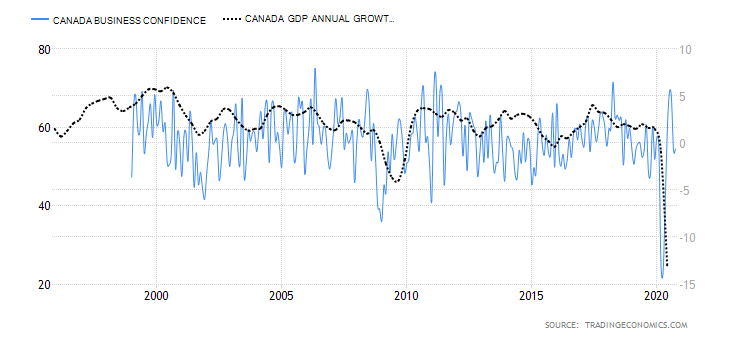

USD/CAD

USD continues to show strength against the Canadian currency. Tomorrow’s interest rate decision by the Bank of Canada will bring a confirmation (or denial) to the strong uptrend od this currency pair. The odds of a new rate hike are getting lower, after weak economic data ahead of the BoC meeting.

Canada Wholesale sales rose by just 0.5% in line with forecasts, although, it seems the market expected a bit more increment.

USD/CAD moving up with strength
The USD/CAD pair, on a weekly chart, is in the middle of a retracing trend, starting at the beginning of September, which has retraced 35% of the length of the downward move. Its daily chart shows the currency pair approaching the ceiling of a potential wide and sideways price channel. The other notable fact being, a price breakout through 1.25953, starting a new impulsive leg up.


NZD/USD

NZ Government to reform RBNZ process to set rates.

The Kiwi dollar is under pressure since the government announced its plans to reform the Reserve Bank of New Zealand. NZ Labor-led coalition said it will modernize the bank’s process for rate-setting and adapt it into a format that was more “growth-friendly”. Giving hints about expansionist monetary policy. Analysts say the RBNZ reform is already well priced by the market, and have downplayed its impact on interest rate expectations.

NZD/USD is currently at the bottom of a down-trending channel

On a daily chart, the NZD/USD pair is trending down on a channel that started on July, 27. Actually, the price is oversold, well below the -2 Bollinger Band. The price is near a mid-term support, so it’s in the process of bottoming out, as is clearly seen in its hourly chart.

A possible scenario for the next few hours is a retracement from here to test resistance points at about 0.695. If it stalls without breaking 0.6908, and MACD turns bearish the retracement is failing, and the downtrend might resume testing the lows made in May 2017.
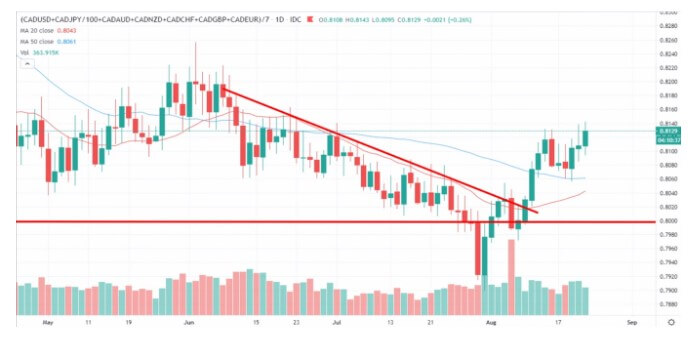
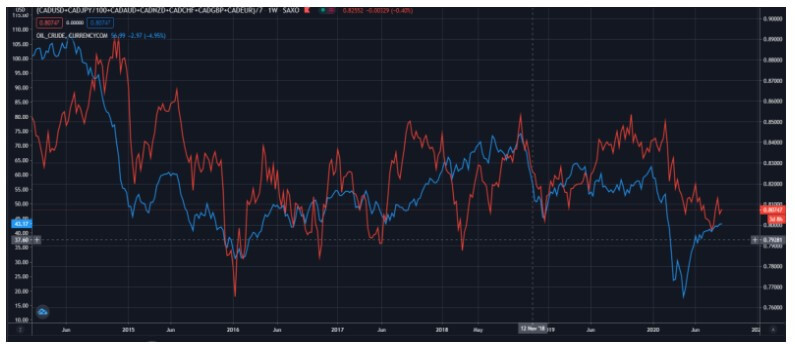
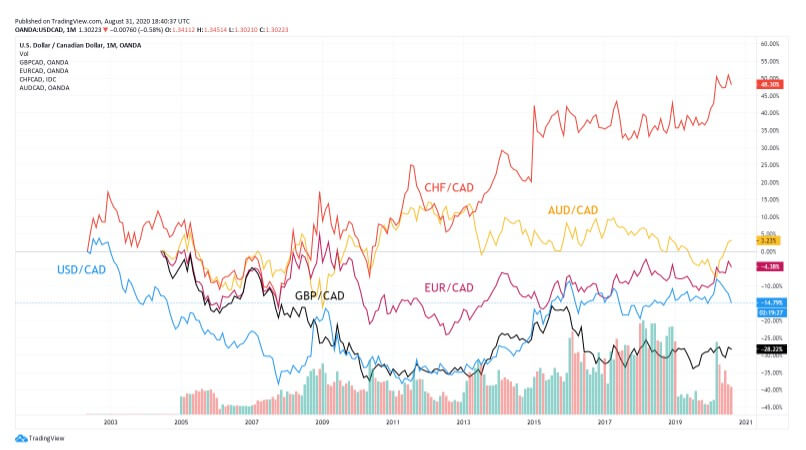
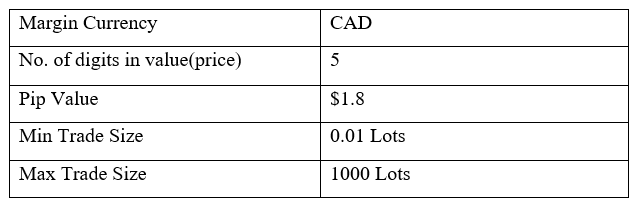
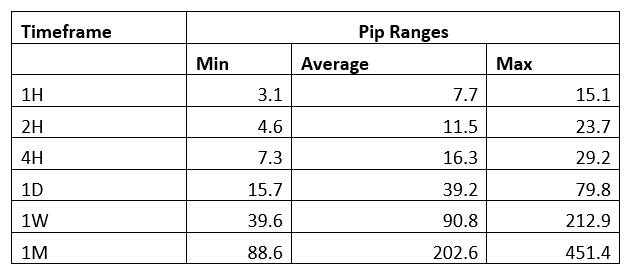
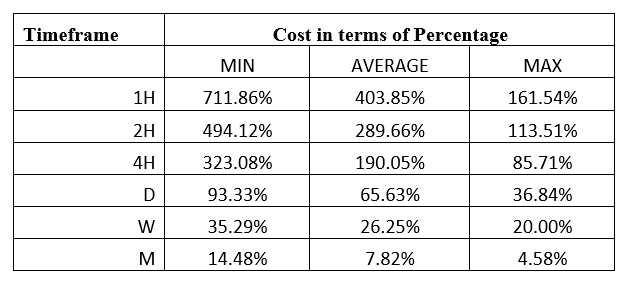
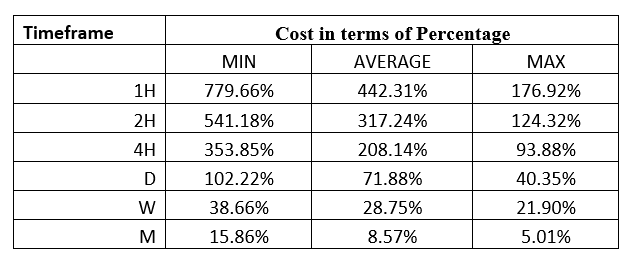
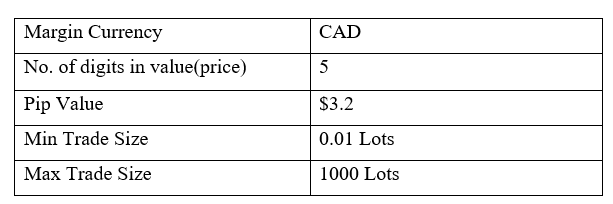
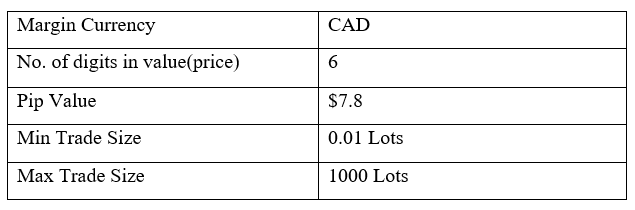
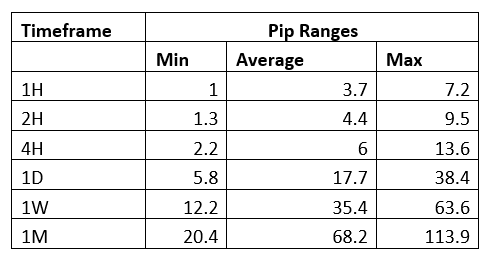
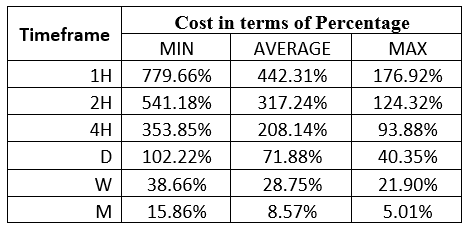
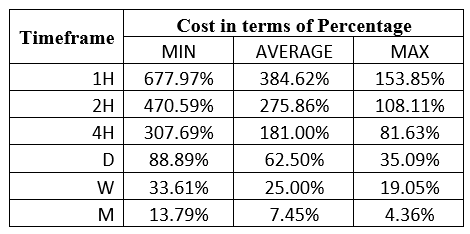
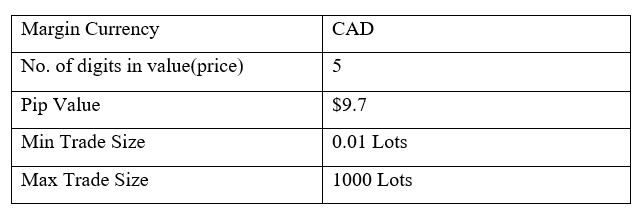
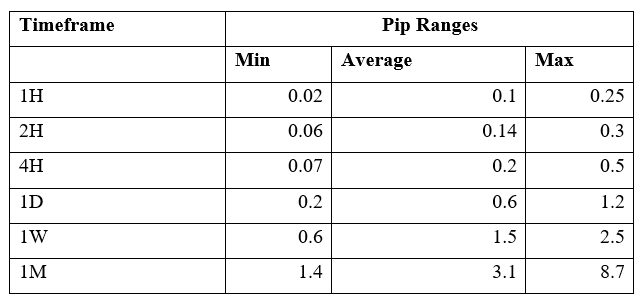
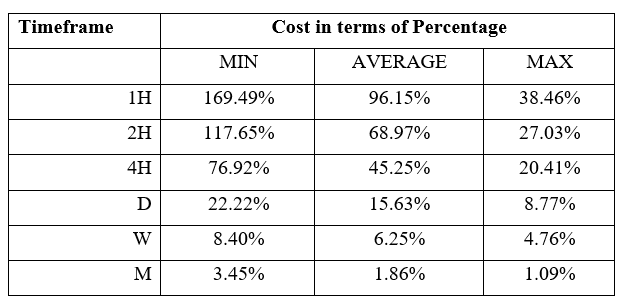
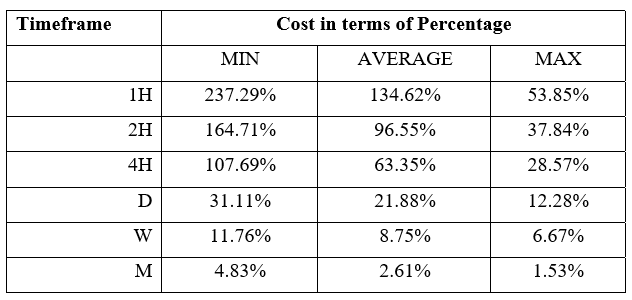
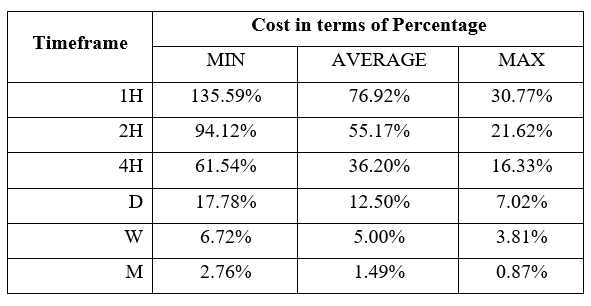
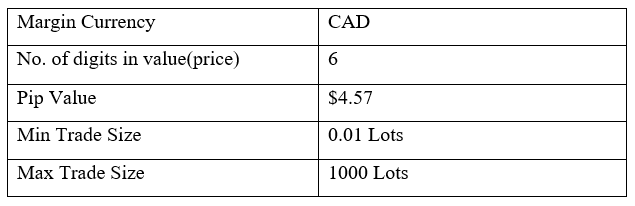
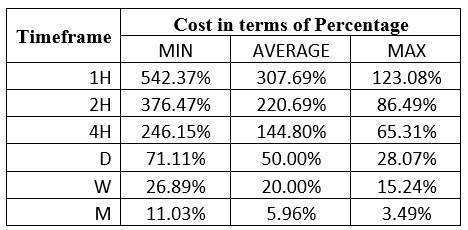
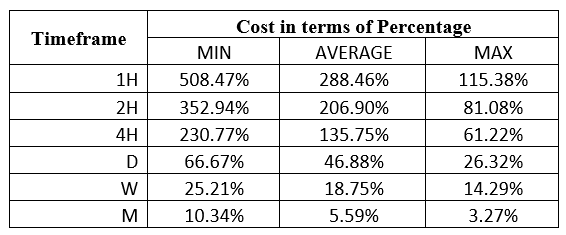
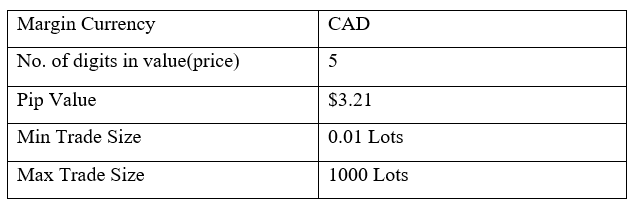
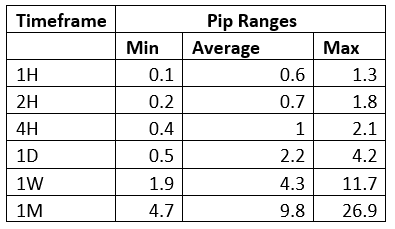
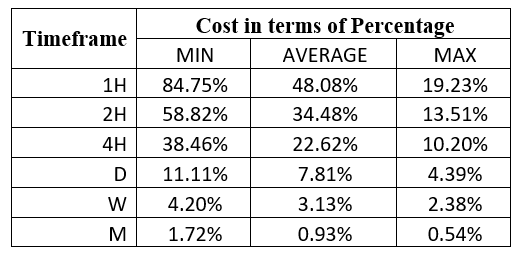
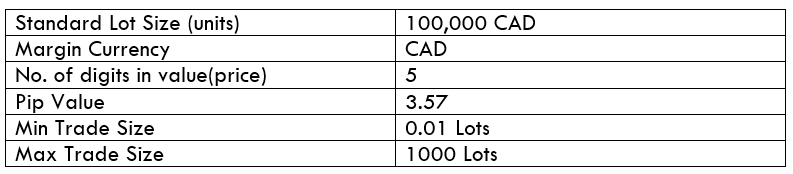
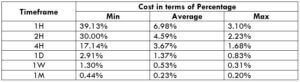