Categories
Forex Signals

Crude Oil Breaks Above Descending Triangle Pattern – Checkout My Sell Limit! 

The WTI crude oil has violated the descending triangle pattern, which was providing resistance at 37.20 area. Above this level, we may see the WTI prices heading north towards the next resistance area of 39.37. It seems like the demand for crude oil is gaining in the wake of positive sentiment over the COVID19 vaccine. 

The U.K.’s human is going to start the testing of the second vaccine to control the coronavirus outbreak, which exerted some positive impact on the market risk-tone and crude oil as well. The human tests are backed by 41 million pounds ($52 million) in U.K. funding along with another 5 million pounds of donations, including contributions from the public. 

On the negative side, the coronavirus cases rose above 8 million globally by Monday, with infections rising in Latin America. Whereas, the United States and China are dealing with fresh outbreaks, which gradually undermining the trader’s confidence about the V-shape recovery and turned out to be one of the key factors that kept a lid on any additional gains in the crude oil.

Bullish sentiment around the crude oil was mainly supported by the optimism over the adherence to the OPEC and its allies (OPEC+) output cut deal by its members. Even, the OPEC+ pact optimism overshadowed the worries over the second-wave of coronavirus and its impact on the global economic recovery.


The investors will keep their eyes on Thursday’s OPEC-led monitoring panel to be led by OPEC as it analyzes producer countries’ success in complying with the cuts. The crude oil supply forecasts from the American Petroleum Institute (API) and the U.S. Energy Information Administration (EIA), due later in the week, will be key to watch.

 Daily Support and Resistance

S1 30.52

S2 33.59

S3 35.65

Pivot Point 36.67

R1 38.72

R2 39.75

R3 42.83

Since we are late to join the party and crude oil has already come so far after breaking 37.20 level, we should look for selling trade somewhere around 39.40 or 40.65 level. Both of these levels are going to be work as double top levels and may help investors capture a quick retracement during the U.S. session. Goold luck!  

Categories
Forex Market Analysis

WTI Crude Oil Slipped to $25.75 – Sideways Channel Intact! 

The WTI crude oil prices dropped to $25.90, mainly due to the price-positive API data, which revealed a rise in U.S. crude inventories. The tensions about a potential second wave of coronavirus cases after countries starting to ease lockdowns also keep the oil prices under pressure. 

Moreover, China’s war with the U.S. and Australia also weighed down on the oil market. At this moment, the WTI crude oil is currently trading at 25.36 and consolidates in the range between the 25.07 – 25.79. The weekly announcement of a private stockpile report from the American Petroleum Institute (API) indicates a build of 7.64 million barrels versus the prior extension of 8.44 million barrels into the stockpiles.

The idea for recent support in the oil prices could be connected to the further request by Saudi Arabia for more extensive output cuts to balance the market induced by virus-induced demand disruption. The recent reopening of major economies’ confidence also supporting the oil prices.

On the other hand, the United States started once again to announce the new claims of coronavirus following easing coronavirus restraints and revived nonessential businesses in U.S. states as per the previous FDA Commissioner Dr. Scott Gottlieb. Whereas, China and South Korea are also fighting to control second wave outbreaks that spread during the weekend, While, Korea showed 26 new cases on May 12. As in result, the oil demand could face further crisis ahead.

Recently, the Energy Information Administration announced Wednesday that U.S. crude stockpile report which slipped by 700K barrels for the week ended May 8.

Daily Support and Resistance

  • S1 22.23
  • S2 23.74
  • S3 24.66

Pivot Point 25.25

  • R1 26.16
  • R2 26.75
  • R3 28.26

The U.S. oil is consolidating at 26.04 within a symmetric triangle pattern, which is rendering tripe top resistance at 26.70 along with support at 25.10 and 24.10. While bullish crossover of 26.70 may lead to WTI prices towards 27.30. Good luck! 

Categories
Forex Signals

U.S. Session Trade Setup – Crude Oil on Bullish Run Amid Upward Channel

The U.S. WTI crude oil futures continue to advance at $24.39 a barrel in the wake of optimization around the market sentiment and weaker U.S. dollar. Besides this, the latest report about the slowdown in inventories at Cushing since mid-March also continues to support crude oil prices.

The reason for the uptick in crude oil prices could also be attributed to the U.S. dollar weakness. The U.S. dollar is losing its bullish traction and struggling to gain any follow-through traction. Whereas, the U.S. dollar index stalled its moderate bounce just above 99.50 to now trade moderately lower at 99.40.

The start of the OPEC+ production cut by 9.7 million barrels a day also boosted the oil prices. Looking forward, the oil traders will keep their eyes on the weekly release of private inventory data from the American Petroleum Institute (API), which is scheduled to release at 20:30 GMT. The industry stockpile for the week ended on May 1 will likely follow the tracks of the previous reduction to 9.978 million barrels into the inventories.


Crude oil has made a strong bullish recovery, as it has violated the resistance level of 21.82 level. Above 21.82, we may see oil prices soaring further higher until 25.02 level. For now, support holds around 21.85, but the bullish bias remains strong as the RSI is also heading north and may also lead oil prices on the upper side.

WTI Crude Oil – Trade Setup

Categories
Forex Market Analysis

WTI Crude Oil Reaches Double Top – Is It Good Time to Short?

The WTI crude oil prices soar to trade at 17.79 level despite an increased number of inventories. The quantity of crude oil owned by private companies that are incapable of selling the product due to the novel coronavirus (COVID-19) pressure seems to set an all-time high in the weeks ahead. 

Global producers may develop creative measures to find crude storage, which caused by the lack of physical demand due to coronavirus lockdowns, while US President Donald Trump made a commitment to deliver a system to help the country’s oil companies, which also helped the sentiment around the commodity. The Treasury Secretary Steven Mnuchin said the plan could add millions of barrels of oil to already-teeming national reserves.

At the US-China front, US President Donald Trump’s stoked fresh trade war between China and the United States, which weighed on the risk sentiment but not so much. On the other hand, the Fed’s dovish pause and positive updates on the virus medicine have recently improved market sentiment, which is growing crude oil prices.


Daily Support and Resistance

  • S1 9.99
  • S2 13.21
  • S3 14.95

Pivot Point 16.44

  • R1 18.18
  • R2 19.66
  • R3 22.89

On the technical front, the U.S. Oil is holding below the strong double top resistance level of 18.35. On the 4 hour timeframe, WTI seems to close a Doji candle below this level, and if it actually happens, we may see oil prices falling further until 23.6% and 28.2% Fibonacci support areas of 16.33 and 15.17 respectively. The MACD is suggesting an overbought scenario, while the 50 EMA is also far from the CMP (current market price), so we may see a selling opportunity. Good luck! 

Categories
Forex Market Analysis

WTI Crude Oil Recovers – Breace to Trade Sideways Channel

Oil prices staged large-percentage rebounds again. U.S. WTI crude oil futures jumped 20.0% to $16.50 a barrel, and Brent crude oil futures rose 4.7% to $21.33 a barrel. Recently recognized OPEC+ agreement to cut production by 9.7 million barrels per day is ready to come into power on May 1, OPEC’s fourth-largest producer, as Kuwait has already started to cut the supply to the market. As per Kuwait’s Oil Minister Khaled Al-Fadhel, Our country has ducked production while recognizing our responsibility through a hard time.

However, most of the experts saying that these OPEC+ output cuts will not be sufficient to tackle market conditions produced by coronavirus-led demand destruction and the rise in inventory levels. But there is the expectation that the output cuts may stop its sharp declines and put a floor under the prices. 

The best way to boost the oil prices is the recovery in demand, and it is only possible when lockdowns are scrapped and industrial activity start or a generous and unprecedented production cut, in addition to what OPEC+ decided.

At the U.S. front, U.S. senators passed a nearly $500 billion bill for relief from the pandemic, providing support to small businesses and hospitals. The package raises U.S. spending on the crisis to nearly $3 trillion.

Moving on, the demand disruption caused by the coronavirus is set to become the most precipitous fall in global GDP since the Second World War, as per the forecasting a 5.5% reduction in global economies this year, dwarfing the 0.5% fall seen during the global financial crisis in 2008.


Daily Support and Resistance

  • S1 2.33
  • S2 8.26
  • S3 11.59

Pivot Point 14.2

  • R1 17.53
  • R2 20.14
  • R3 26.08

The crude oil recovered after dropping to $7.50 previously. For now, the prices are holding around 16.85 level, right below the next resistance level of 17.55, which marks the 61.8% Fibonacci retracement. Bullish crossover of 17.55 level can extend bullish trend until 20.75 level. On the lower side, immediate support holds around 14.70 level today. Bullish bias will be stronger above 17.55 and bearish below the same.

Good luck!

Categories
Forex Market Analysis

WTI Crude Oil’s Bearish Mode Dominates – COVID19 In-Play

The oil market saw a historical event during the session. The May contract for West Texas Intermediate (WTI) futures collapsed to zero before ending the day at minus-$37.63 a barrel, meaning producers have to pay buyers to take oil away or store it. 

This is the first time in recorded history that crude has dropped into negative territory, far surpassing the 1986 low of $10.20 a barrel. Meanwhile, the June WTI contract slumped 18.0% to $20.43 a barrel, and Brent crude oil fell 8.9% to $25.57 a barrel.

The oil traders will keep their eyes on any news about the supply restrictions from the majors for fresh impetus. Weekly oil stock data, for the period ended on April 17, from the American Petroleum Institute (API), prior 13.143M, could also offer second-tier clues for the energy benchmark.

WTI Crude Oil – Daily Technical Levels

Support Resistance 

14.82      16.06

14.25      16.74

13.01      17.98

Pivot Point 15.5

May contract for the Crude Oil faced a massive decline as its prices plunged into negative zone recently for the first time in history. Nevertheless, the spot rates are holding around 14.70, supported above the level of 11. Breakout of this level is expected to encourage sharp selling in the market, and technically, this presents room for selling unto 11 and 8 while resistance exists nearby 17.36 today. Good luck! 

Categories
Forex Market Analysis

Crude Oil Boosts Amid Massive Output Cut Sentiment – OPEC Meeting In Focus! 

A day before, the WTI crude oil prices were boosted by reports that massive output cuts would be agreed upon when OPEC and its allies, including Russia, meet later today. U.S. Nymex crude oil futures jumped to trade $27.09 a barrel. 

Meanwhile, the U.S. Energy Information Administration reported that crude oil production in the country sank to a six-month low of 12.4 million barrels per day last week. The agency also said crude oil stockpiles increased 15.2 million barrels, much higher than a build of 8.4 million barrels expected.

Declining demand due to coronavirus fears and lockdowns, Russia’s announcement comes at a suitable time. Whereas, the Energy Information Administration (EIA) said overnight that the U.S. crude oil inventory has grown by 15.2 million barrels for the week ending April 3, against analyst expectations of a 9.37-million-barrel build. The American Petroleum Institute (API) also estimated a build of 11.9 million barrels yesterday. 

OPEC meeting will likely be more successful than their meeting in March, where they failed to agree to continue supply cuts and fueled a price war between Saudi Arabia and Russia.

Apart from the OPEC+ meeting, energy ministers from the Group of 20 major economies are expected to meet in order to find new ways to help ease the impact of the COVID-19 pandemic on global energy markets.

Daily Support and Resistance

  • S1 24.14
  • S2 26.37
  • S3 27.77

Pivot Point 28.59

  • R1 30
  • R2 30.82
  • R3 33.05

Crude oil is on a bullish run, trading around 27.15 level. The U.S. oil is likely to face immediate resistance around the triple top level of 28.86. Today, crude oil may find immediate support around 25.45 level, and above this, the WTI crude oil prices can show a bullish bias until 28.85 resistance. A bullish breakout of 28.85 level can lead WTI prices further higher until the next resistance area 30.22. The bullish bias remains dominant, and we should look for buying trading over 26.15 today. Good luck!

Categories
Forex Market Analysis

WTI Crude Oil Retest 28.30 – Is It a Good Idea to Sell Here? 

The U.S. crude oil futures soared 25.0% to $27.32 a barrel, and Brent was up 21.0% to $30.94 a barrel. One of the major reasons behind such a bullish trend was a tweet from U.S. President Trump.

He said in his tweet: “Just spoke to my friend MBS (Crown Prince) of Saudi Arabia, who spoke with President Putin of Russia, & I expect & hope that they will be cutting back approximately 10 Million Barrels, and maybe substantially more which, if it happens, will be GREAT for the oil & gas industry!”

The markets were supported by the sentiment of an oil production cut on Thursday in United States markets after news that President Donald Trump said the world oil industry has been ruined this year and has plans to attend meetings with industry executives later this week. Whereas the idea of tariffs on Gulf imports was floated Afterward, WTI rose to the $27 handle overnight. 

Looking forward, the oil traders will now keep their eyes on the U.S. President’s meeting with the key oil company leaders to determine if there are chances of production cut or not. 

WTI Crude Oil – Daily Technical Level

Support Resistance 

22.84     28.87

19.71     31.76

13.68     37.79

Pivot Point 25.74

Technically, U.S. oil has passed over the resistance mark of 24.85, which has exposed additional opportunity for buying unto 28.29 level. Formation of candles beneath this level may support us to capture a bearish trade; however, at the same time, bullish trades can be taken instantly above a 24.85 resistance level. The MACD is making significant histograms, which is proposing the chances of further buying in crude oil. Good luck!

Categories
Forex Market Analysis

Descending Trendline Resisting Crude Oil’s Bullish Bias – Get Set for Selling! 

The WTI crude oil prices slid further, as the Trump administration extended social-distancing guidelines through April 30, leading traders to expect lower fuel consumption ahead. U.S. Nymex crude oil futures shed a further 6.6% to $20.09 a barrel, the lowest level since February 2002. Brent tumbled 8.7% to $22.76.

Crude oil prices are still facing selling pressure, even after the fresh, positive news in the market. The continued concerns about the global economic slowdown from the coronavirus pandemic kept giving some support to the U.S. dollars as a safe-haven demand. 

The negative correlation between the U.S dollar and commodities are keeping the WTI prices in a selling mode. During the beginning of this week, physical demand for WTI and its prices fell globally. 


WTI Crude Oil – Daily Technical Levels

Support Resistance 

20.95       22.42

20.13       23.06

18.66       24.53

Pivot Point 21.59

The WTI crude oil prices are facing resistance at 21.90, which is extended by the downward trendline. On the lower side, support stays at 19.45 level, which is also extended by horizontal support level. The MACD is suggesting bearish bias along with all the fundamentals in the market. Today we can look for adding selling trades below 20.75 with a target of 19.40. Good luck! 

Categories
Forex Market Analysis

Crude Oil’s Bearish Bias Stays Strong – Quick Technical Outlook 

The WTI crude oil has dropped to the weekly support level of 20, before bouncing off to trade at 23.94. Despite the small recovery in oil prices, analysts continue to give a warning about the coronavirus negative impact on the global market because the cases continue to rise and death losses as well. 

Moreover, the continuing price war between producers Saudi Arabia and Russia is also not showing any ending probability, despite Russian hints at a preference for higher prices on Wednesday, as per the latest report. Whereas, the recently positive inventory numbers from the US failed to give any good signals to the buyers.

At the USD front, the greenback continues to flashing green and remains as the market favorite, mainly due to its safe-haven currency status. On the other hand, the moves offer unstable trading sessions due to the downbeat performances of the Asian stocks. A stronger dollar is also placing a bearish bias on the WTI prices due to it’s negative correlation. 

Investors will keep their eyes on the coronavirus headlines since the global struggles to control the pandemic. It should also be noted that the fears of the deadly virus continue to weigh on the markets’ risk-tone, but the US equity futures have recovered off-late after the ECB’s announcement. Eventually, the demand for crude oil is suffering. 


Support Resistance
19.75 26.79
16.61 30.7
9.57 37.74
Pivot Point 23.66

On the technical front, the WTI prices are likely to find support around 20. and 13, while the resistance stays around 26. The MACD and RSI are suggesting a sharp selling trend in the oil, especially after it has closed three black crows pattern on the weekly timeframe, which is making it a big deal. Let’s consider staying bearish below 26 and bullish above 20 today. Good luck! 

Categories
Forex Market Analysis

WTI Crude Oil Slips Below $29- Coronavirus Outbreak Weights! 

The WTI crude oil prices flashing red falling from $30 to $28.70 in the wake of the coronavirus outbreak and uncertainties encompassing the price war between Saudi Arabia and Russia.

Improvements in the oil prices were limited today as new nations have announced COVID-19 lockdowns. Airlines are decreasing the number of regular flights because of increased numbers of cases and countries declaring quarantines to combat the new coronavirus. Canada and Malaysia are the two most recent countries to ban arrivals and close their borders.

The U.S. President Donald Trump said overnight that economic interruptions from the spread of the coronavirus and stimulus measures taken against it could start to a recession.

On the other hand, the ongoing price war between Saudi Arabia and Russia, two of the world’s biggest oil producers, also limits the oil price gains. Saudi Arabia’s Saudi Aramco threw down the gauntlet, with Chief Executive Officer Amin Nassar informing investors that the company is “very comfortable with oil prices below $30 a barrel”.  

Meanwhile, the group has decided to produce at maximum capacity of 12 million barrels a day next month, and there are no changes forecast for May. Consequently, crude oil prices are trading with a selling bias today.

Daily Support and Resistance

  • S1 23.34
  • S2 26.59
  • S3 27.96

Pivot Point 29.84

  • R1 31.21
  • R2 33.08
  • R3 36.33

On the technical side, crude oil seems to have formed a descending triangle pattern, which is likely to support crude oil around 27.70. Above this, the oil prices may trade bullish until 30 and 32.50. However, the bearish breakout of 27.70 can lead the WTI prices towards 25.65 and 23.85. Let’s consider staying bearish below $28.95. Good luck!  

Categories
Forex Market Analysis

WTI Crude Oil Slips Beneath $29 as Coronavirus Outbreaks Further! 

Crude oil prices fell sharply to trade below $29 after showing a slight bullish recovery during the previous week. Crude oil prices benefited from President Trump’s saying that his government is to buy large quantities of crude oil for the Strategic Petroleum Reserve to take advantage of lower oil prices. Nymex crude oil futures rose 2.8% to $31.87 a barrel, and Brent rebounded 4.3% to $34.07.

Over the weekend, the global coronavirus pandemic worsened, particularly in Europe. Italy saw the number of coronavirus cases surge past 24,700 (1809 deaths), while Spain reported over 7,800 cases in total, Germany over 5,800 cases and France over 5,400 cases. In the U.S., the number of cases jumped to nearly 3,600 (68 deaths).

The RBA indicated that it would purchase bonds while holding a special meeting on Thursday. Whereas, RBNZ finally also joined the role of major central bankers that offered major rate cuts in order to control the coronavirus (COVID-19). 

China’s National Bureau of Statistics (NBS) said that China’s economy continues to stabilize despite the impact of coronavirus. The comments came after January-February month Retail Sales and Industrial Production disappointed markets. As in result, the risk-tone remains under pressure with the U.S. ten-year treasury yields decreased around 0.673% while stocks in Asia register mild losses due to pandemic fears.

Moving forward, traders will keep their eyes on central banker’s moves and announcements/surprises for near-term trade direction. On the other hand, coronavirus headlines will also be essential to watch.

Daily Support and Resistance

  • S1 26.84
  • S2 29.16
  • S3 30.25

Pivot Point 31.49

  • R1 32.57
  • R2 33.81
  • R3 36.13

On the technical front, crude oil has formed a bearish engulfing candle, which is strengthening the bearish bias among traders. On the lower side, the WTI prices may head further lower towards the support level of 27.33 level. Below this, the next support can be found around 23.95 level. Fundamentals are in favor of a selling trend, and but oil should break below 27.50 level before exhibiting further selling today. Let’s consider staying bearish below $31. Good luck!  

Categories
Forex Market Analysis

WTI Crude Oil Prices Rose To $32.35 – Emergency Cash Injection U.S. Fed Hikes! 

The WTI crude oil prices flashing green and recovered to $32.35, mainly after the emergency liquidity injected from the United States Fedra Reserve. The fresh geopolitical tension from Iraq supporting the energy prices. Moreover, the reason behind the oil price recovery could also be the surprise infusion of liquidity from the Bank Of Japan. The U.S. Crude Oil WTI Futures traded 2.7% higher to $32.35. 

The WTI Crude Oil prices recovered today after the Federal Reserve moved to provide $1.5 trillion in short-term liquidity and changed durations of Treasuries it buys.

Despite today’s recoveries, crude oil markets fell almost 30% this week after Saudi Arabia and Russia prices war and decided not to cut production further and instead sell at lower prices, raising fears of a price war. 

Meanwhile, the U.S. decision to ban travel from some European countries as President Donald Trump’s main tactic to control COVID-19 also disappointed the investor’s sentiment.

Traders are expecting that the talks between U.S. President Donald Trump and Saudi Prince may help to stop the fall in crude prices while, on the other hand, Russia’s willingness to attend the OPEC+ meeting on March 18 adds smiles on the face of the oil trades.

Looking forward, qualitative catalysts could keep the driver’s seat, whereas the weekly release of the Baker Hughes US Oil Rig Counts, prior 682, will entertain the traders.

Daily Support and Resistance

  • S1 26.84
  • S2 29.16
  • S3 30.25

Pivot Point 31.49

  • R1 32.57
  • R2 33.81
  • R3 36.13

Technically, crude oil is trading at $32.36 per barrel, mostly maintaining sideways trading range of 34.40 – 27.33. At the moment, 34.35 resistance is very, very crucial for crude oil as the MACD is in the buying zone, and traders need a reason to go long on crude oil. Breakout of 34.35/40 can be that reason which may attract some buying in crude oil and may lead its prices towards 38. Let’s look to stay bearish below 34 as below this; crude can head to target the next support level of 31.50. Good luck! 

Categories
Forex Market Analysis

WTI Crude Oil Prices Came Under Pressure Despite OPEC Agreed To Cut Production! 

The WTI crude oil prices dropped despite the report that OPEC minister agreed to cut the oil output by 1.5 million barrels per day. It’s worth to mention that the cut is finalized after approval from Russia. A meeting of both OPEC and OPEC+ members later in the day is in focus. 

Russia’s willingness for deeper production cuts is still doubtful because recent reports suggested that Moscow was supporting an increase to the current level of cuts rather than a further reduction. The news failed to boost oil prices today because falling U.S. equities places a further burden on oil markets. 

Despite some improvement in prices this week, the WTI is still below 24% on the year, and the coronavirus is playing a major role. The coronavirus cases continue to rise in the world’s largest economy. Some time ago, the U.S. Vice President Mike Pence accepted that they have a shortage of virus testing kits for now. Moreover, New York officials also recently crossed wires while saying that the coronavirus infects nearly 2,733 people in the city, which is also putting bearish pressure on the crude oil prices.

Daily Support and Resistance

  • S1 42.01
  • S2 41.76
  • S3 41.42

Pivot Point 43.51

  • R1 43.72
  • R2 44.26
  • R3 45.01

On the technical front, the crude oil price has broken below the double bottom support level of 43.95, which opens up further room for selling until 40.95. Recently, the MACD of crude oil has also forming bigger histograms on the 4-hour chart, which are supporting the selling trend in the WTI prices. Closing of candles below 43.96 may confirm the chances of more bearish bias in the WTI prices today. Let’s consider staying bearish below 43 to target 42.25 and 41.75. Good luck! 

Categories
Forex Market Analysis

WTI Crude Oil Prices Rose – Eyes On OPEC Meeting

The WTI crude oil prices rose because the traders evaluated the latest headlines regarding OPEC’s meeting this week. At the moment, the U.S. Crude Oil WTI Futures gained 1.4% to $47.45.

According to earlier reports, the OPEC+ alliance will agree to a total production cut of at least 1 million barrels per day from this quarter onward to fight the impact caused by the deadly coronavirus outbreak.

On the other hand, the prices were also supported by a lower-than-expected rise in crude oil inventories in the United States, easing some concerns of oversupply in the world’s biggest oil consumer.

It is deserving to consider that Saudi Arabia wants extra cuts of 1 million to 1.5 million BPD for the next quarter and to retain current reductions of 2.1 million BPD in place until the end of 2020.

The geopolitical tensions in the Middle East also increased prices. The Saudi-led alliance fighting in Yemen said it had stopped an attack on an oil tanker off Yemen’s coast on the Arabian Sea.

The WTI crude oil inventories rose by 785,000 barrels for the week ended Feb. 28, the EIA said. That contrasted with forecasts for a build of 2.64 million barrels.

Daily Support and Resistance

  • S1 44.01
  • S2 45.76
  • S3 46.52

Pivot Point 47.51

  • R1 48.27
  • R2 49.26
  • R3 51.01

On the technical front, the WTI crude oil prices have completed the 38.2% Fibonacci retracement at 48.50 level. Closing of candles below 38.2% Fibo level is driving further bearish bias for the crude oil, and it may lead its prices towards the next support area of 45. Continuation of a selling trend can cause a further drop to 43.85. Alternatively, the bullish breakout of 48.50 can lead oil towards 50 and 50.54 levels. The MACD is crossing into the selling zone, supporting the bearish bias. Consider looking for sell trades below 47 today to target 46.10 and 45.86. Good luck! 

Categories
Forex Market Analysis

WTI Crude Oil Drops Amid Coronavirus Fears – 61.8% Fibonacci Level In Focus! 

The WTI crude oil prices flashing red and dropped to $53.42 because the fears of coronavirus burdened on the crude inventories. The U.S. Crude Oil WTI Futures dropped 0.9% to $53.42.

The WTI oil inventories increased by 414,000 barrels for the week ended Feb. 14, the EIA said. That compared with expectations for a build of 2.5 million barrels, according to forecasts. The data supported crude oil prices yesterday, which raised more than 1% before decreasing today due to intensifying fears of the new coronavirus.

The global risk-off sentiment increased further on Friday after the World Health Organization (WHO) officials gave warning that the new coronavirus may break out globally at any time. 

According to the latest report, there are now 74,675 cases of the coronavirus in China, including 2,121 deaths in the country. Outside of China, there are 1,076 confirmed cases in 26 countries. The Chinese Commerce Ministry stays ready to take further steps to control the economic impact of coronavirus.

On the other hand, the U.S. State Department recently reiterated its travel warnings while Japanese officials and German Finance Ministry reports also showed attention about the coronavirus negative impact. Looking forward, coronavirus headlines will be the key to watch for fresh direction.

Daily Support and Resistance

  • S1 51.55
  • S2 52.75
  • S3 53.24

Pivot Point 53.95

  • R1 54.44
  • R2 55.15
  • R3 56.35

On the technical front, the WTI crude oil is trading at 52.94, heading towards 61.8% Fibonacci retracement at 52.25. On the 4 hour timeframe, the WTI prices are also expected to gain support around 52.25, which is the most extended by bullish trendline. Above this level, we may see bullish recovery in the WTI crude oil prices until 53.50 and 54. Good luck! 

Categories
Forex Market Analysis

Crude Oil’s Ascending Triangle Pattern Breakout – What’s Next?

The WTI crude oil prices dropped mainly due to falling demand in the wake of intensifying coronavirus fears. The U.S. Crude Oil fell 0.6% to trade at $51.99during the European session.

The crude oil prices recently dropped despite China’s report that the pace of virus infection in the region continued to decrease. It is worth to mention that the Chinese health authorities confirmed 1,886 new cases of coronavirus and 98 further deaths as per yesterday’s report.

China recently imposed tighter restrictions on travel and movement within the country to control the spread of the virus. The International Energy Agency announced this month that the virus could reduce oil demand by 435,000 barrels per day in the first 3-months of the year. In contrast, global experts stated it is yet too immature to announce the outbreak is being controlled.

The equity market risk-tone is getting worse, and U.S. stock futures slipped from record levels after tech giant Apple said on Monday that it would not reach its revenue target of the March quarter, due mainly to slower iPhone production and weaker demand in China, as a side effect of the coronavirus outbreak. 

Looking forward, the traders are also awaiting news from the Organization of the Petroleum Exporting Countries and its allies about deepening production cuts to support oil prices.


Daily Support and Resistance

  • S1 51.57
  • S2 52
  • S3 52.28

Pivot Point 52.44

  • R1 52.72
  • R2 52.88
  • R3 53.31

On the technical front, the WTI crude oil prices have violated the ascending triangle pattern on the lower side to trade at 51.45 level. The breakout patterns open further room for selling until 50.50 and 49.45. While the MACD has recently started forming histograms below zero level, which are suggesting odds of more selling in the WTI crude oil prices. In case the WTI crude oil violates 52.30 resistance mark, we may see crude oil prices heading towards 53.50. Good luck! 

Categories
Forex Market Analysis

Crude Oil Testing Double Top – U.S. Session Trade Setup!

The WTI crude oil prices rose slightly, mainly due to the hopes of deeper supply cuts from the major producers. The U.S. Crude Oil WTI Futures inched up 0.1% to $51.48 by 12:30 AM ET (04:30 GMT).

The Organization of the Petroleum Exporting Countries (OPEC) dropped its 2020 demand forecast for its crude by 200,000 barrels per day, indicating worries regarding the coronavirus outbreak in China, the world’s biggest oil importer.

While the International Energy Agency expected a drop of 435,000 barrels a day during the first 3-months of the year, it had previously expected world fuel consumption to rise by 800,000 barrels a day as compared to a year earlier.

The WTI oil prices have fallen nearly 20% from their tops in early January, mainly due to oil demand from China fell in the wake of travel restrictions. The China Health Commission, the epicenter Hubei province, reports 4,823 new cases on the second day of using the new diagnosing method. The number of people in severe and critical conditions rose to 9,638 from the prior figures of 7,084.

Daily Support and Resistance

  • S1 49.01
  • S2 50.24
  • S3 51.05

Pivot Point 51.47

  • R1 52.28
  • R2 52.7
  • R3 53.92

On the technical side, the WTI crude oil is holding below 52.07 resistance level, which is keeping the oil prices under pressure. The market is lacking volatility, as traders are staying out of the market ahead of the weekend. In any case, the bullish breakout of 52.07 level can extend buying until 53 and 53.25 while the selling can be seen below the 52.07 mark. The RSI and MACD are holding in the buying zone, suggesting chances of buying trends in the WTI. Today, we can place a buy stop around 52.15 to target 52.65. Good luck! 

Categories
Forex Market Analysis

WTI Crude Oil Trade Plan – Prices Rose Amid Possible Outputs Cuts by OPEC+

The WTI crude oil prices rose by 0.4% while registering $51.40, mainly due to the possible output cuts by the OPEC+. The U.S. West Texas Intermediate (WTI) crude (CLc1) futures were up 15 cents, or 0.3%, at $51.10 a barrel, also heading for a fifth consecutive week of losses.

It is worth to mention that the oil prices managed to recover despite registering an increase in the inventory numbers. By the way, oil prices got support after the latest activity figures from the global powerhouses like the U.S., E.U., and the U.K.

Crude oil prices sharply rose earlier in the session after China’s central bank governor said the world’s second-biggest economy could experience disruptions in the first quarter, while Japan announced a significant increase in confirmed coronavirus cases among thousands of passengers.

Traders now will keep their focus on the U.S. employment data and Baker Hughes Rig Counts for taking fresh directions. While January month employment figures from the U.S. are more expected to keep the U.S. dollar on the front foot, a continued drop in rig counts could help energy optimists.


Daily Support and Resistance

  • S1 46.76
  • S2 48.89
  • S3 50.08

Pivot Point 51.02

  • R1 52.22
  • R2 53.15
  • R3 55.29

The technical side of the crude oil remains bearish as the U.S. Oil is still trading bearish at 50.30, maintaining a bearish channel. Crude oil may find resistance at the double top level at 52.09, which is the same level where downward trend line tests the previous high, making it a more stronger level. On the lower side, the support is likely to be found around 49.75 and 49. Consider taking sell trades below 51.02 level today. Good luck! 

Categories
Forex Market Analysis

WTI Crude Oil Prices Rose Despite Rising Stockpiles! 

Today in the early Asian session, the WTI crude oil prices rose, although the report of the American Petroleum Institute (API) said U.S. oil inventories increased last week.

The U.S. Crude Oil WTI Futures gained 1.0% to $51.12. The WTI Crude Oil prices started tp recover yesterday after reports said the OPEC+ representatives meeting in Vienna discussed additional cuts of up to 1.0 million barrels per day to cope with lost demand from China’s coronavirus crisis.

Despite the gains this week, WTI crude oil is still down more than 20% since early January because of the coronavirus depressed global demand. It is worth to mention that the issue for the market will likely be increased if the restriction continues for an extended period because due to this demand loss will become increasingly difficult for the market to swallow.

The API said in its weekly report that crude stockpiles rose by 4.2 million barrels for the week ended Jan. 31, compared with a draw of about 4.3 million barrels reported for the week before.

At the coronavirus front, over 490 people have died in China from the coronavirus infection, said officials on Wednesday. Also, the confirmed number of infected citizens grew to 24,324 from 20,438 confirmed cases the day before.

There are still plenty to be concerned for, and the price of oil is valid, sliding further overnight to a low of $49.41bbls. Chinese oil demand has already dropped by 20% because of dwindling air travel, road transportation, and manufacturing.


Daily Support and Resistance

  • S3 45.79
  • S2 48
  • S1 48.77

Pivot Point 50.2

  • R1 50.98
  • R2 52.41
  • R3 54.62

Technically, the WTI crude oil seems to violate the downward channel at 51.50, which may drive the WTI prices higher until 51.70. A bullish breakout of this level can lead oil prices further higher towards 52.25 today. The EMA and MACD are pointing into the bullish zone, suggesting the chances of a bullish trend continuation. Let’s consider taking buying trade above 51.25 today to aim for 52.25. All the best! 

Categories
Forex Market Analysis

WTI Crude Oil Prices Continue To drop Due To Coronavirus Fears! 

The WTI crude oil prices continue its losing streak mainly due to the worries of the lower demand in China in the wake of coronavirus outbreak fears. As we know, China is the biggest importer in the world.

WTI U.S. West Texas Intermediate (WTI) crude fell for a 4th-week in a row last week after airlines canceled flights to China. Supply chains across the world’s 2nd-largest economy have also been disturbed.

U.S. West Texas Intermediate (WTI) crude fell 24 cents to $51.32 a barrel, after earlier hitting a session low of $50.42. The front-month WTI price fell 15.6% in January, the most significant monthly drop since May.

At the China front, the Fears of coronavirus outbreak have increased stronger during the weekend because the number of affected peoples crossed 14,300, whereas the death losses rose above 300. Apart from the coronavirus, there is another virus that occurred in Hunan that name is H5N1 bird flu virus.

Whereas, the People’s Bank of China (PBoC) has announced to provide 1.2 trillion yuan liquidity to support money markets and ease the sell-off, whereas securities’ regulator said to stop short-selling stocks. Moreover, the authorities have also informed banks to continue to provide loans to those companies affected by the outbreak.

On the other hand, the Organization of the Petroleum Exporting Countries (OPEC) and its allies will likely do the meeting in February instead of in March, to discuss the impact on oil demand from the virus flare-up. Already, OPEC and non-OPEC’s Joint Technical Committee (JTC) have scheduled to meet in early February to assess the impact of the virus.


Daily Support and Resistance

  • S3 47.46
  • S2 49.74
  • S1 50.71

Pivot Point 52.01

  • R1 52.99
  • R2 54.29
  • R3 56.57

The WTI crude oil prices are holding above the double bottom level of 51.04, which is very much likely to get violated considering the ongoing fundamentals in the market. If this happens, the next target for WTI will be 49.05. Let’s wait for a breakout to enter a sell trade today. Good luck! 

Categories
Forex Market Analysis

Crude Oil Completes 23.6% Retracement – Who’s Up for Selling?

The WTI crude oil is trading with a bearish bias at 53.85 level, which marks the 23.6% Fibonacci retracement level. Most of the bullish recovering in oil prices came in response to the inventory report released by the API. 

The inventories of U.S. crude sank dramatically during the previous week. The API posted a dip of 4.3 million for the week concluded Jan. 24 versus the build of 1.6 million announced last week.

The WTI crude oil prices grew 1.6% in response to the report in post-settlement trading. For now, the eyes will remain on the Energy Information Administration report, which is due at 10:30 AM ET Wednesday. The economists are expecting a build in crude stocks of 482,000.


Daily Support and Resistance

S3 50.85
S2 52.21
S1 53.1
Pivot Point 53.58
R1 54.47
R2 54.95
R3 56.32

The WTI finally dispensed some bullish momentum. However, it still lingers beneath 55.30. The leading technical indicators such as the RSI and Stochastics are in the oversold area, though it’s attempting to come out of the oversold territory. 

Currently, U.S. Oil may find support nearby 51.30. So we can watch for bearish trades beneath 55.30 and bullish over 53.50.

Good luck!

Categories
Forex Market Analysis

WTI Crude Oil Prices Rose Amid Fresh Fear of China Coronavirus! 

The WTI crude oil prices flashed green and rose to $55.84 after dropping to 9-week lows, mainly due to the fears regarding China coronavirus. The U.S. West Texas Intermediate futures (CLc1) were 24 cents up, or 0.4%, higher at $55.83 a barrel. The contract fell 2% on Thursday and is 5% lower for the week.

On the front of the main headlines, the market’s risk tone has already badly shaken by the headlines from China regarding the increased number of affected people and deaths because of coronavirus. China has reportedly blocked millions of people in two cities to prevent the virus spread.

Whereas the World Health Organization (WHO) still needs some time to understand the cause behind the coronavirus as an international threat. The SARS fighting team of China returned to find the reason and battle the coronavirus.

On the flip side, oil inventories dropped by 405,000, the EIA reported in its weekly report. Traders were looking for a drop of about 1 million barrels for oil inventories.

After the massive build in fuels during the previous two weeks, you can say that this is slightly positive news for the crude oil future buyers, as well as it did not prove to be much help because the market’s worries are all on China’s demand now, under the coronavirus problem.

While we had a near 1-million barrel decline in Cushing stockpiles, U.S. crude exports fell about 70,000 bpd on the week, and production remained at an unreasonable high of 13 million bpd.


Daily Support and Resistance       

S3 52.98

S2 54.25

S1 54.97

Pivot Point 55.51

R1 56.24

R2 56.78

R3 58.04

Technically, crude oil has violated the horizontal intraday support level of 55.90, which is now working as resistance for oil. It’s trading at 54.50, having formed strong bearish candles, which are known as “Three Black Crows.” These patterns are likely to drive more sales until 53.95, the next support level for crude oil. The MACD also supporting the strong bearish trend in the crude oil, although there’s a need for a bullish correction. Let’s consider to take sell tradings below 55 today to target 53.95. Good luck! 

Categories
Forex Market Analysis

Crude oil gains support – Is It a good time to go long?

The WTI crude oil prices unchanged and maintain its biggest gain in the wake of sluggish economic growth in China, the world’s largest crude importer, as it increased concerns regarding the fuel demand.

In the 4th-quarter of 2019, the world’s 2nd-largest economy grew by an expected 6% from a year earlier, whereas the full-year expansion was 6.1%, the slowest in 29 years. The U.S. West Texas Intermediate dropped 7 cents at $58.45 a barrel, having risen more than 1% in the previous session. The contract was down about 1% for the week and also set for a second weekly decline.

WTI crude oil prices rose yesterday after the United States and China signed the phase-one trade agreement. The sentiment in the market was further recovered after the United States Senate approved changes to the U.S.-Mexico-Canada Free Trade Agreement.

On the flip side, decreasing chances of the US-Iran war and the U.S. dollar strength, which generally weighs on the commodity basket. The International Energy Agency gave a dark picture of the oil market outlook for 2020 on Thursday. The agency expected that oil supply would exceed demand for crude from the Organization of the Petroleum Exporting Countries (OPEC), even if members are fully compliant in their agreement with Russia and other producers to curb output, a grouping known as OPEC+.

On the other hand, the United Arab Emirates energy minister said this week that he is expecting a positive meeting with OPEC and its allies to meet next in March.

Daily Support and Resistance

S3 55.83
S2 57.1
S1 57.86
Pivot Point 58.37
R1 59.13
R2 59.64
R3 60.91

The U.S. Oil is holding around 58.80 with a bullish bias to target a 23.6% Fibonacci retracement mark of 59.46. On the higher side, further bullish bias can lead to crude oil prices towards 60.60, which marks 38.2% Fibonacci retracement. Today consider staying bullish above 58.40 to target 9.45. Good luck!

Categories
Forex Market Analysis

WTI Crude Oil Prices Jumped On US-Iran War Sentiment! 

Earlier today, the WTI crude oil prices hit the bullish track and climbed to 1.3% to $63.53, mainly after Iran attacked two United States airbases in the wake of U.S. airstrike that killed the Iranian general last week, flashing worries regarding the escalating conflict between the United States and Iran.

The U.S. crude oil later fell from $63.53 to trade around $62 during the European session. Crude oil prices soared as much as 5% earlier in the day following the news, but gave up all of their increases following in the day as Iran’s foreign minister announced it had “settled proportionate steps in protection” and is not attempting war.

Supply worries extended due to an intensifying conflict between the United States and Iran after the U.S. airstrike killed general Qassem Soleimani last week. In total13 missies have been reported launched at the Ain Assad Air Base. White House answers they are aware of the attack, and U.S. President Trump has been briefed and is monitoring the situation.

It is worth to mention that the United States President Donal Trump will make a statement tonight. With this, the U.S. Defense Secretary Esper and U.S. Secretary of State Pompeo have arrived at the White House. On the other hand, Iran’s guards warn the U.S. any aggression against Tehran will get a worse response.

Meanwhile, the American Petroleum Institute reported that crude stockpiles dropped by 5.9 million barrels for the week ended Jan. 3, compared with a plunge of about 11.5 million barrels reported for the week before.

Whereas, the Energy Information Administration is expected to report a decline of around 3.6 million barrels when it publishes official figures tomorrow.

At the Sino-US front, the improvements on the Sino-U.S. trade front also remained as the focus. The two nations were reportedly going to sign a phase one trade deal on Jan. 15.

Daily Support and Resistance

S3 57.4

S2 60.7

S1 62.71

Pivot Point 64.01

R1 66.01

R2 67.31

R3 70.62

Looking at the 4-hour timeframe, the WTI prices are holding around 62 after violating the support level of 62.30. Crude oil is now facing support around 61.30, which is extended by an upward trendline. The WTI prices are likely bouncing off above this level to target 62.30.  

On the chart above, we can see the WTI seems to form a Doji candle, which is followed by a strong bearish bias. Typically such candles drive bullish trends in the market. I will consider taking buying positions above 61.20 to target 62.27. Above 62.30, the U.S. Oil can soar up to 63. Good luck! 

Categories
Forex Market Analysis

Crude Oil Completes 23.6% Retracement – EIA Report Ahead! 

The WTI crude oil prices continue to increase, mainly due to intensifying tension in the Middle East. The U.S. Crude Oil WTI Futures jumped 2.9% to $62.98 yesterday.

Reports came from the Middle East that the airstrike killed key Iranian and Iraqi military, and consequently, the tension increased as well as the concerns of crude oil supplies diruption increased too, so that’s why oil markets are hugely supported today.

On the other hand, the WTI crude oil prices gained support from the announcement of the People’s Bank of China that it was cutting the amount of cash that banks must hold in reserve, releasing around 800 billion yuan ($115 billion) in funds to support the slowing Chinese economy.

Meanwhile, the Positive data that showed China’s production activities business confidence rose. President Trump is expected to take a break on being ‘tariff man’ until we get beyond the presidential election in November. Besides this, Trump said a phase one trade deal would be signed on Jan. 15 at the White House.

Meanwhile, the sentiment around the oil markets remains underpinned by the US-China trade deal optimism and declining US crude inventories, as reported by the American Petroleum Institute (API) earlier this week. The API data showed a draw of 7.8M barrels of oil for the week ending Dec. 27.

For now, the WTI barrel now awaits for the weekly US Crude Stocks data due to be published by the Energy Information Administration.


Daily Support and Resistance

Support Resistance
63.09       63.47
62.85       63.6
62.47       63.98
Pivot Point 63.23

The WTI crude oil is holding in the overbought zone at 63.50, having an immediate resistance around 64 and support at 62.75. The U.S. Oil has already completed 23.6% Fibonacci retracement at 63.15. 

In case, the EIA reports another draw in U.S. Oil stocks; we may see further buying in crude oil prices until 65. Alternatively, the oil may extend the bearish trend until 62.75, which marks a 38.2% Fibonacci retracement level. All the best! 

Categories
Forex Market Analysis

Dramatic Dip in Crude Oil – Bullish Channel Breakout 

During the European session, the WTI crude oil prices were unchanged near the 3-months highs due to optimism surrounding the United States and China trade deal that has left an impact on the oil demand as well as the global economic growth outlook.

The WTI crude oil has dropped dramatically from 61.01 to 60.35 level upon the bearish breakout of the bullish channel and bearish fundamentals. 

It should be noted that the improvement in an 18-months trade war between the United States and China, the world’s two biggest oil consumers, had raised expectations for higher energy demand next year.

China on Thursday declared a list of import tariff exemptions for six oil and chemical products from the United States, days after the world’s two largest economies announced an incomplete trade deal. 

As a result, U.S. Oil is facing intense bearish pressure. What’s next? The technical side of the market is likely to extend support around 60.30, and below this, the black crack can drop until 59.65 support zone. 


Daily Support and Resistance

  • S3 59.65
  • S2 60.35
  • S1 60.71

Pivot Point 61.04

  • R1 61.4
  • R2 61.74
  • R3 62.44

The RSI and MACD have entered the selling zone, and demonstrate strong bearish bias among traders. As we can also see, the upward channel which supported the oil around 61 has already been violated, and now 61 is likely to work as resistance for crude oil. Consider trading bearish below 60.74 today and buying above 59.65. All the best!

Categories
Forex Market Analysis

WTI Crude Oil Slipped Amid Rising Crude Inventories – Quick Trade Plan! 

The WTI crude oil prices are flashing red and traded lower after the American Petroleum Institute reported a large build of weekly crude inventories. The WTI crude oil inventories increased by 4.7 million barrels in its snapshot of stockpiles for the week ended December 13, the API said.

The U.S. government data is anticipated to point a drop of 1.3 million barrels while the Energy Information Administration(EIA) publishes its weekly figures.

In the previous week, the EIA announced the advance of a crude stock of 822K barrels versus a market forecast for a dip of 2.76 million barrels.

The WTI crude oil prices got some benefit earlier in the day after data showed U.S. November manufacturing output and housing figures both outperformed expectations.

It should be noted that the declines in crude oil prices have been limited due to Sino-US trade optimism. A phase-one trade deal was agreed between the United States and China last week, decreasing some fears over the economic impact of a continued dispute between the two biggest crude oil importers. 

Technically, the WTI is trading in a bullish channel, which is supporting it around 60.20, while the same bullish channel is likely to resistance around 62.22. 

On the way to upside, the WTI crude oil may find a horizontal resistance level around 61 while the RSI and MACD are suggesting bearish bias. Lately, the crude oil has formed a series of neutral candles which exhibits indecision among traders.

Daily Support and Resistance

  • S3 58.49
  • S2 59.48
  • S1 59.97

Pivot Point 60.47

  • R1 60.96
  • R2 61.46
  • R3 62.45

Consider taking buying trade above 60.20 to target 60.50, and above this, the WTI may soar to test 61.10. Good luck! 

Categories
Forex Market Analysis

Crude Oil Bearish Retracement In Play – Brace for a Bullish Trade!

The WTI crude oil prices slightly dropped even after positive headlines regarding the United States and China trade news. Chinese state media Xinhua reported that Chinese Vice Premier Liu He discussed an incomplete deal with U.S. Treasury Secretary Steven Mnuchin and U.S. Trade Representative Robert Lighthizer in a phone call during the weekend.

Both sides had helpful discussions about “each other’s core concerns,” the article said. The USTR confirmed the call took place. Besides, the Asian stocks got the support due to the headlines, but unfortunate WTI crude oil prices were little impacted.

A monthly report from the International Energy Agency (IEA) was cited as a potential catalyst for selling today. The IEA estimated that non-OPEC supply growth would grow to 2.3 million barrels per day (BPD) next year compared with 1.8 million BPD in 2019.

Daily Support and Resistance

S3 54.44
S2 55.98
S1 56.99
Pivot Point 57.53
R1 58.54
R2 59.08
R3 60.63

The oil prices remained under pressure over the data that showed weekly U.S. crude stockpiles surge by 2.2 million barrels, crossing the forecast of a 1.649 million-barrel rise.

WTI Crude Oil – Trade Idea 

Consider taking buying positions above $57.20 with a take profit at $57.75 and stop loss of $56.90.

Categories
Forex Market Analysis

WTI Crude Oil Completes 38.2% Retracement – What’s Next?

The WTI Crude oil prices dropped As the Energy Information Administration, EIA reported that the U.S. oil inventories increased unexpectedly last week.

The EIA said oil stockpiles rose by 7.9 million barrels, compared with expectations from analysts for an increase of about 1.5 million barrels.

From now, we expect many negative factors to increase. The risk we feel, especially with the recent crude oil inventories builds and reduction in demand anticipates, could be the bearish trend in the prices in the energy markets.

WTI crude oil prices got some support during the starting of this week due to expectations that China and the United States were close in the signing of the trade deal.

As per the recent updates, the report came that the signing of the deal may not be signed during this month and will likely happen later this month. By the way, it all depends on the discussion between the Sino-US.

Daily Support and Resistance

S3 53.37
S2 55.09
S1 55.75
Pivot Point 56.8
R1 57.46
R2 58.52
R3 60.23

Technically, the WTI crude oil has completed a 38.2% Fibonacci retracement on the 4-hour chart. Closing of Doji candles above this level is suggesting bullish bias among traders. Most importantly, crude oil has recently closed a bullish engulfing pattern, which may drive sharp buying in the black crack.

On the upper side, crude oil may face resistance at 57.50, along with support at 56.20. I will be looking to trade a choppy session today until this range breakout.

All the best!

Categories
Forex Market Analysis

WTI Crude Oil Exhibits a Weekly Gain – Supply Concern Weights!

On Friday, the WTI crude oil prices continue to hold bullish bias maintaining substantial weekly gains as support from a surprise draws in U.S. inventories and possible action from OPEC and its allies to increase production cuts burdened broader economic interests.

The strong buying in crude oil was mostly underpinned by the surprise plunge in U.S. stockpile data. The U.S. crude oil inventories fell by about 10 million barrels during the previous week.

Whereas, the officials at the Organization of the Petroleum Exporting Countries (OPEC) remarked to extended supply cut is an option to balance the softer demand outlook in 2020, hence extending another reliable support to the WTI crude oil prices.

Technically, the WTI has violated an asymmetric triangle pattern, which keeps the crude oil prices on hold between 54.75 to 53.50. The violation of this range has pushed crude oil higher towards 56.50 area.

WTI Crude Oil – Daily Technical Levels

Support Resistance
55.5 56.59
54.91 57.1
53.82 58.19
Pivot Point 56.01

At the moment, crude oil is facing stiff resistance at 56.50 area. However, the WTI is looking to complete bearish retracement on the 240 mins chart. Crude oil has already completed 23.6% Fibonacci retracement at 55.85 area, and below this, further sell-off is expected until 55.50.

Despite the bearish correction, I would suggest looking for a bullish trades above 55.30 level today. All the best!

Categories
Forex Market Analysis

Daily FX Brief, October 03 – Major Trade Setups – Services PMI’s In Highlights

The U.S. dollar retreated for a second straight session, with the ICE Dollar Index slipping 0.1% to 99.02 on Wednesday. The euro climbed 0.3% to $1.0961. The top five economic think-tanks in Germany lowered their 2020 German GDP forecast to 1.1% from 1.8% previously, citing shrinking manufacturing production. And they said the economy could fall into a technical recession in the third quarter this year.

Economic Events to Watch Today

Let’s took at these fundamentals


EUR/USD – Daily Analysis

The EUR/USD currency pair flashing red at the level of1.0955, also the pair got a rejection near the 1.0967 (38.2% Fib Retracement of 1.1110/1.0943).

The EUR/USD currency pair took a buying at lows below 1.09 on Monday after the negative United States Manufacturing data propped the U.S. economic slowdown fears. As we know, the EUR/USD pair reached the recovery range above 1.0950 on Tuesday, ahead of unexpectedly lowest US ADP Employment data.

The United States’ ten-year treasury yield dropped by 3-basis-points and 4-basis-points on Tuesday and Wednesday, individually, and hit a bearish level of 1.578% in the Asian session. By the way, it’s one of the lowest levels since September 09.

However, the currency pair failed to hit the level of 1.0967, due to the decision by the United States President Donald Trump that to impose tariffs on $7.5 billion in European imports starting October 18. 

At the data front, the U.S. non-manufacturing data scheduled to release at 14:00 GMT is anticipated to compensate for worse than expected manufacturing PMI activity during September. The PMI is expected to issue figures at 55.1 against 56.4 during August.

Massive slip in the U.S. economic data will prop the United States slowdown concerns, eventually supporting the EUR/USD pair to hit higher to 1.10. Moreover, the chances of a 25-basis-points rate cut by the Federal Reserve during this month have already increased from 40% to 84% this week. Whereas, if the data beats the expectations, then the EUR/USD pair could decline back below the 1.09 level.

Daily Support and Resistance    

S3 1.0823

S2 1.0883

S1 1.0921

Pivot Point 1.0943

R1 1.0981

R2 1.1002

R3 1.1062

EUR/USD – Trading Tips

A day before Non-farm payrolls, the EUR/USD is trading a bit muted, as traders are staying out of the market due to a National holiday in China and Germany. Despite that, the EUR/USD may trade bearish below 1.0964 to target 1.0915 area. On the other side, the bullish breakout of 1.0960 can lead EUR/USD 1.1020. 


USD/JPY – Daily Analysis

The USD/JPY currency pair consolidates in the narrow range of 107 handle, due to the greenback falls out of favor with investors. Moreover, the USD/JPY currency pair struggles to hit the high-level of107 handles while the Asian equities and Treasury yields trade lowest.

As we know, the greenback continues to drop since the start of the week. The dollar has the weakest start of a 4th-quarter since 2008 after following a slump in the 3rd-quarter range.

The United States stocks continued their decline due to more dismal data. The downward risk sentiment is increasing, and the global economy is slowing down, which was again evident in the U.S. data that pushed the U.S. benchmarks lower. The Dow Jones Industrial Average, DJIA, dropped around 344 points, or 1.3% during the previous session.

Moreover, the S&P 500 index fell by 52.64 points, and the Nasdaq dropped by 123.44 points. The ADP data showed just 135,000 new jobs against forecasted figures of 140,000. With this, the traders are pricing in weaker Nonfarm Payrolls which is due on Friday.

The greenback and Treasury yields need support at this position. The United States’ two-year treasury yields dropped from 1.55% to 1.48%, and the ten-year dropped from 1.66% to 1.59%. 

Daily Support and Resistance


S3 105.7

S2 106.53

S1 106.86

Pivot Point 107.37

R1 107.69

R2 108.2

R3 109.04

USD/JPY – Trading Tips

The USD/JPY has formed tweezers bottom on the 4-hour timeframe which is suggesting odds of a bullish reversal. The USD/JPY pair may find support at 106.90, and below this, it can go after 106.400. On the upper side, resistance stays at 107.450. 


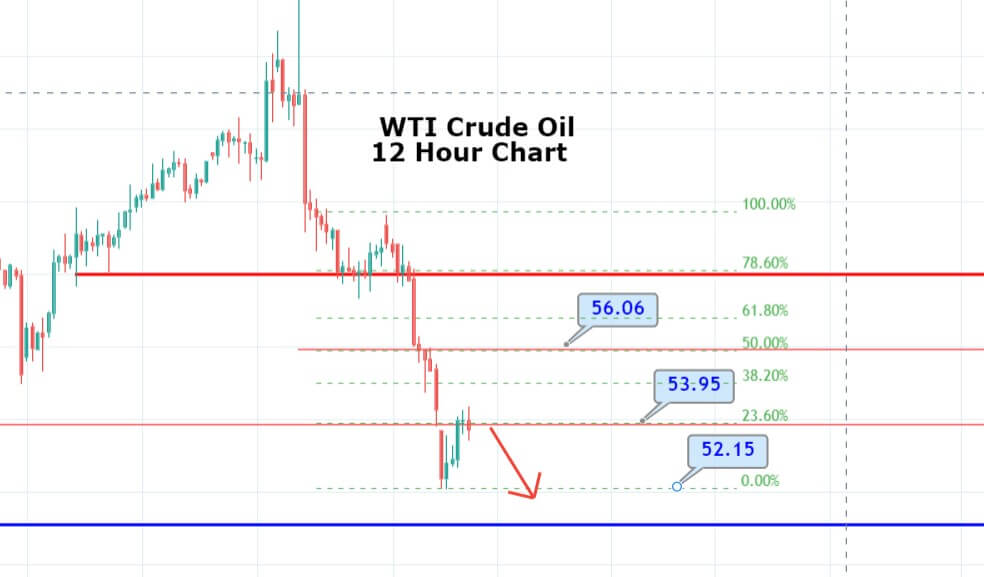
WTI Crude Oil – Daily Analysis

The WTI crude oil prices found on the recovery track, due to concerns of the worsening global economic outlook. The economic outlook hit crude oil prices very hard during the previous trading session as traders are pricing in the probability for development in solving the on-going trade war between the United States and China. The U.S. West Texas Intermediate (WTI) crude oil futures were up 23 cents, or 0.4%, to $52.87 a barrel, after sinking by 1.8% on Wednesday.

On the other hand, the global equity benchmarks found on the lowest level in a month on Wednesday. That came due to a sign of a recession in the United States economic growth. Secondly, the weaker economic data in Europe also distributed fears the global economy could fall into the slowdown.

There was a hurting sentiment in the previous trading session from the Energy Information Administration, which reported a surge of 3.1 million barrels in crude oil inventories in the last week. 

It should also be noted that top oil exporter Saudi Arabia is planning to lift the cost for crude oil it sells to Asia during November. The sentiments came following the drone attack on Sauida Kingdoms, and its oil production has also started to spike in the Middle East.  

Daily Support and Resistance

S3 48.53

S2 50.77

S1 51.65

Pivot Point 53

R1 53.89

R2 55.24

R3 57.48

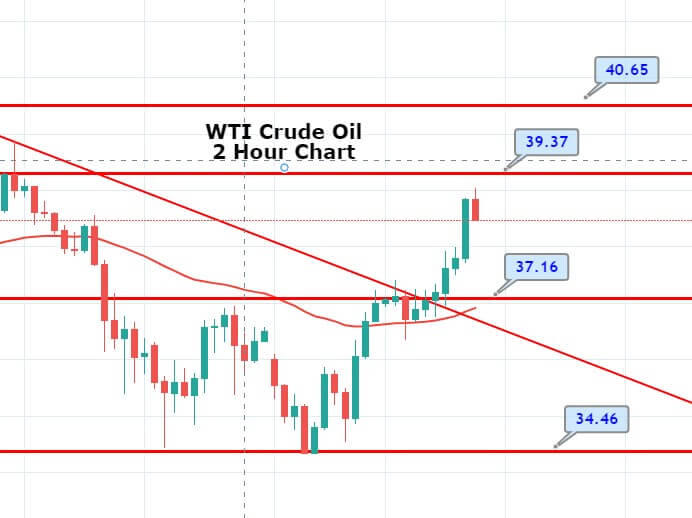
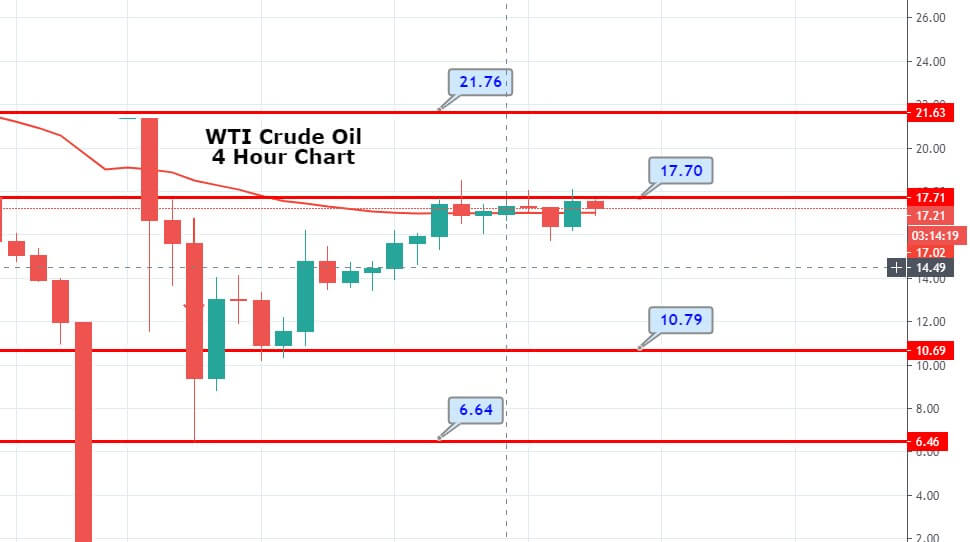
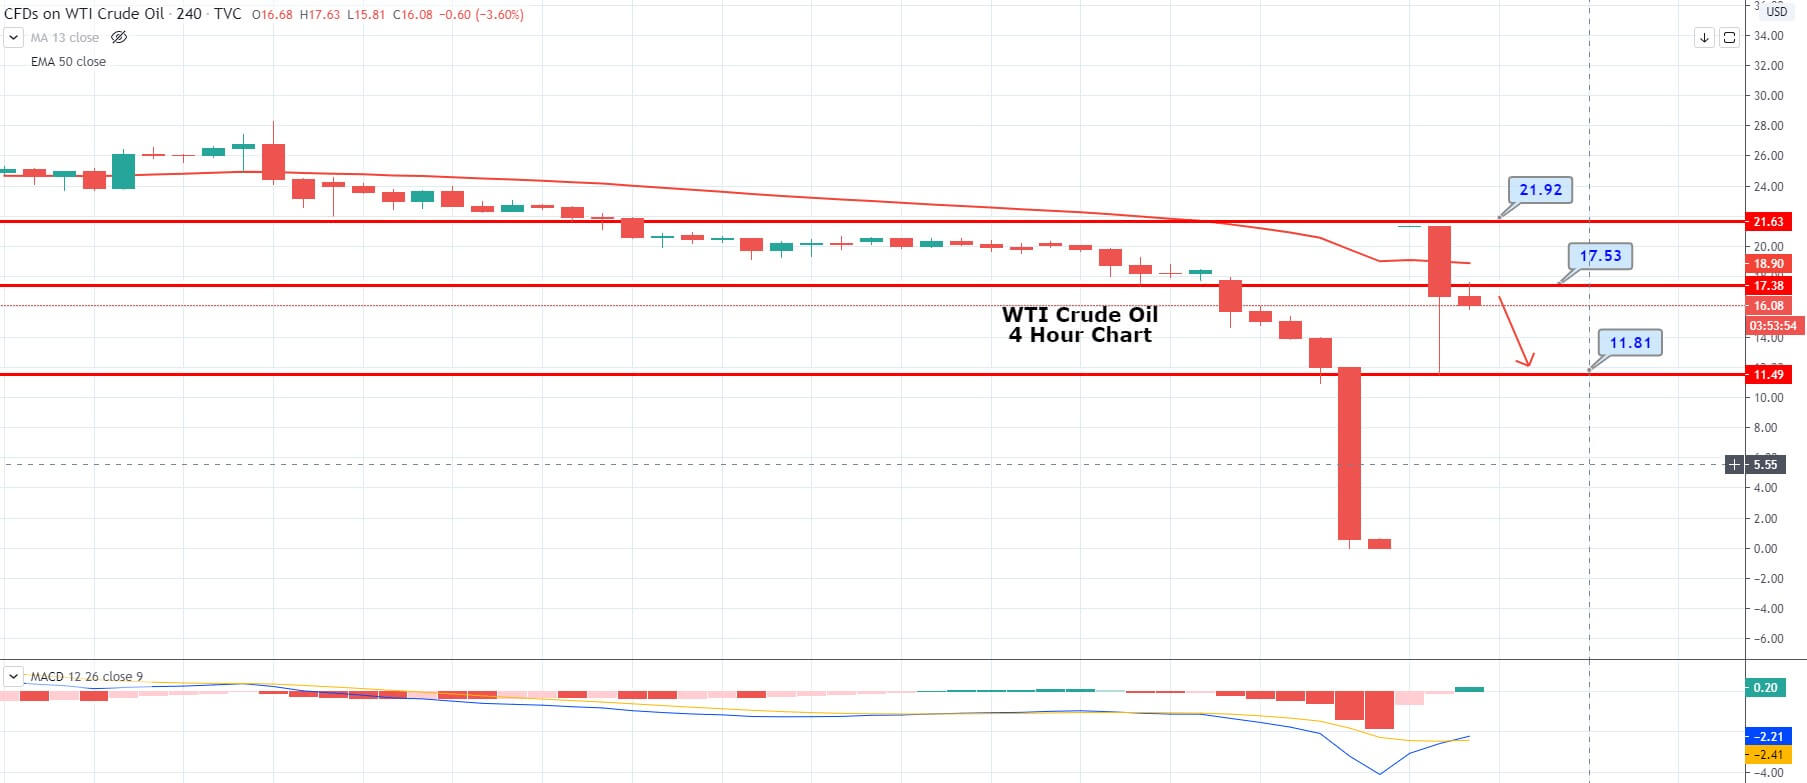
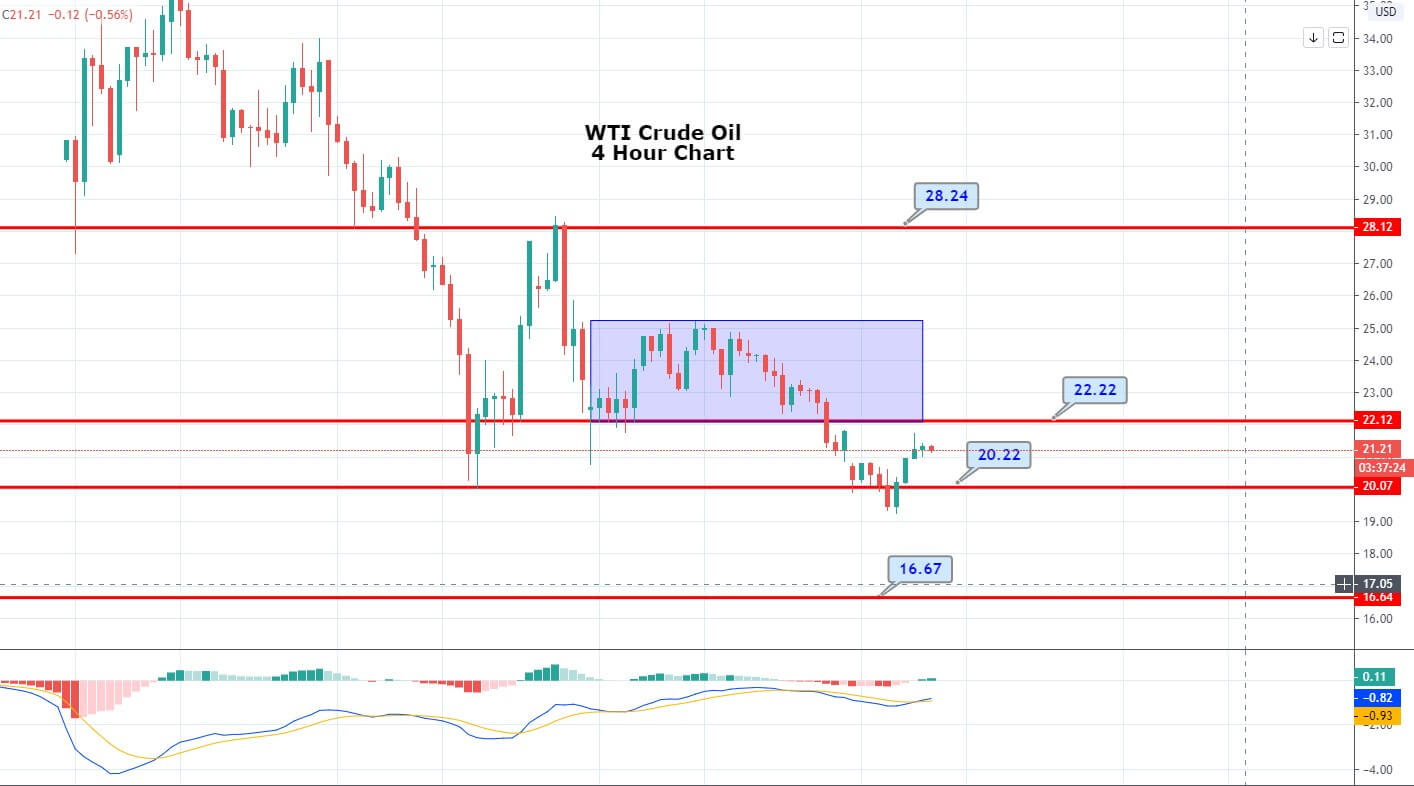
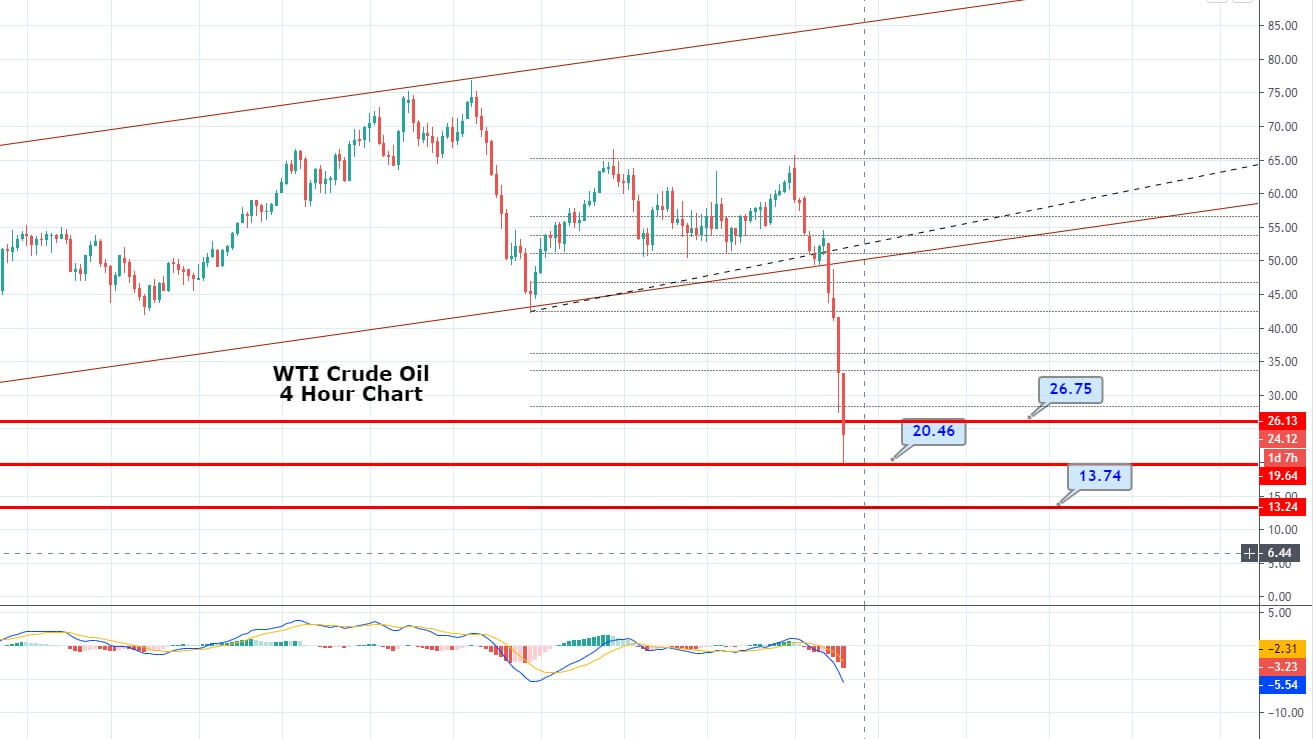
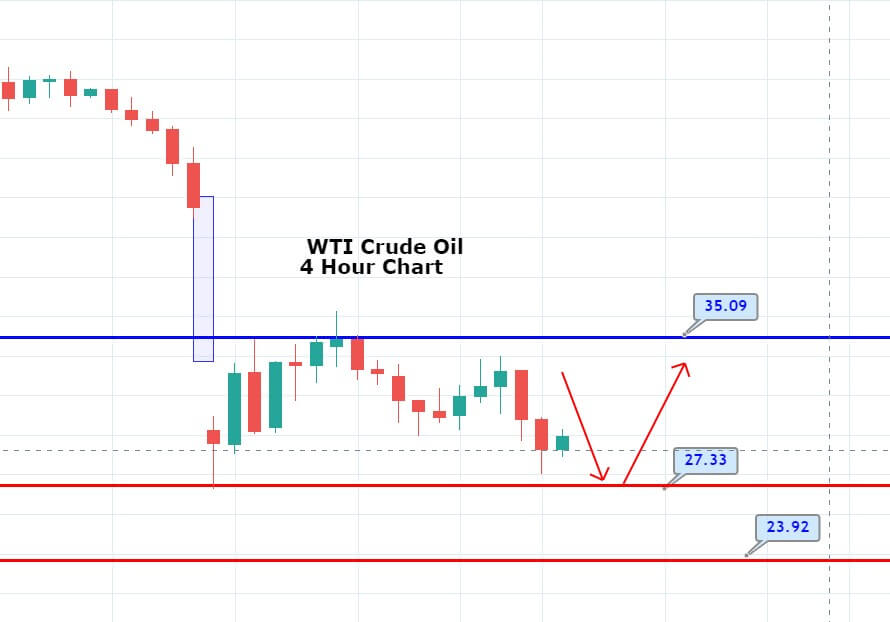
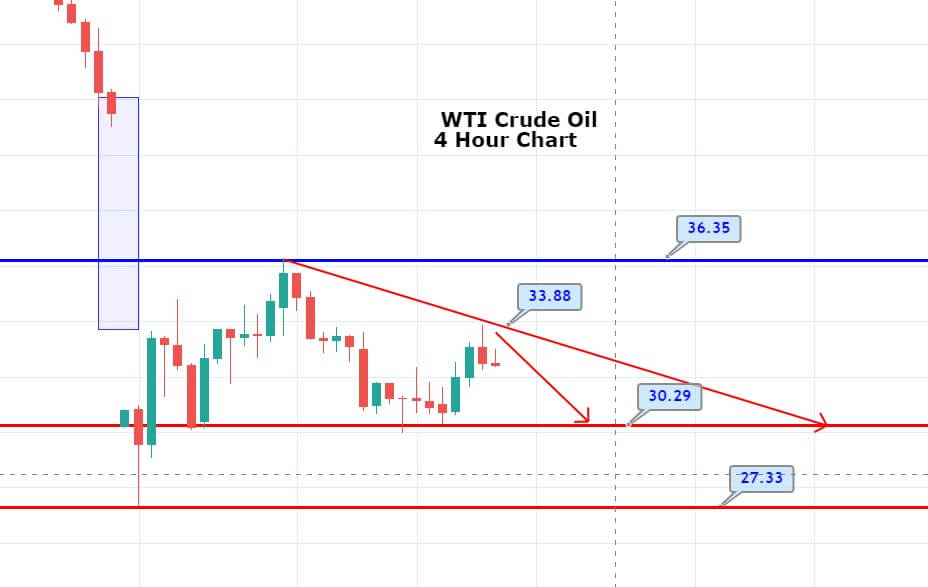
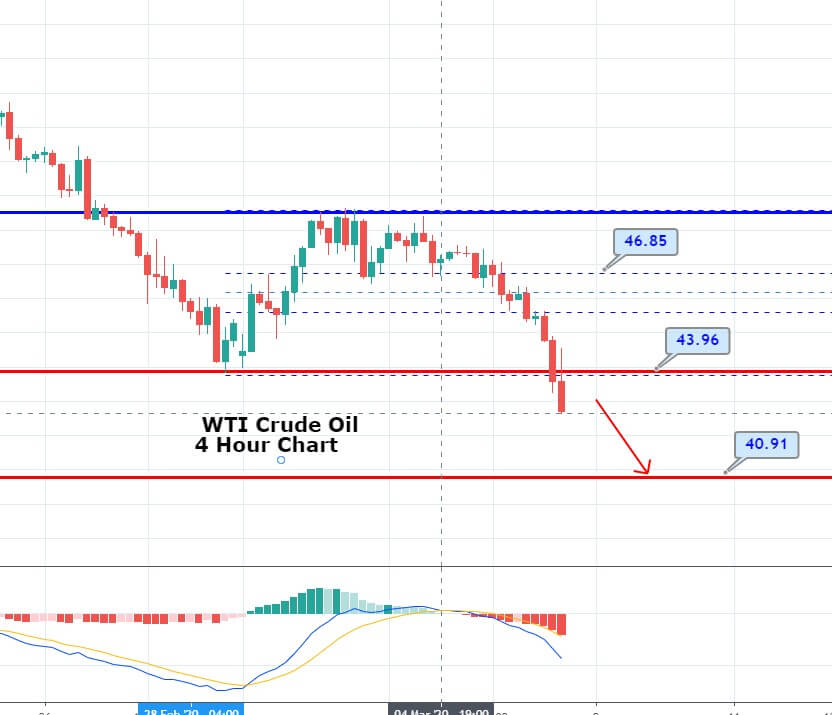
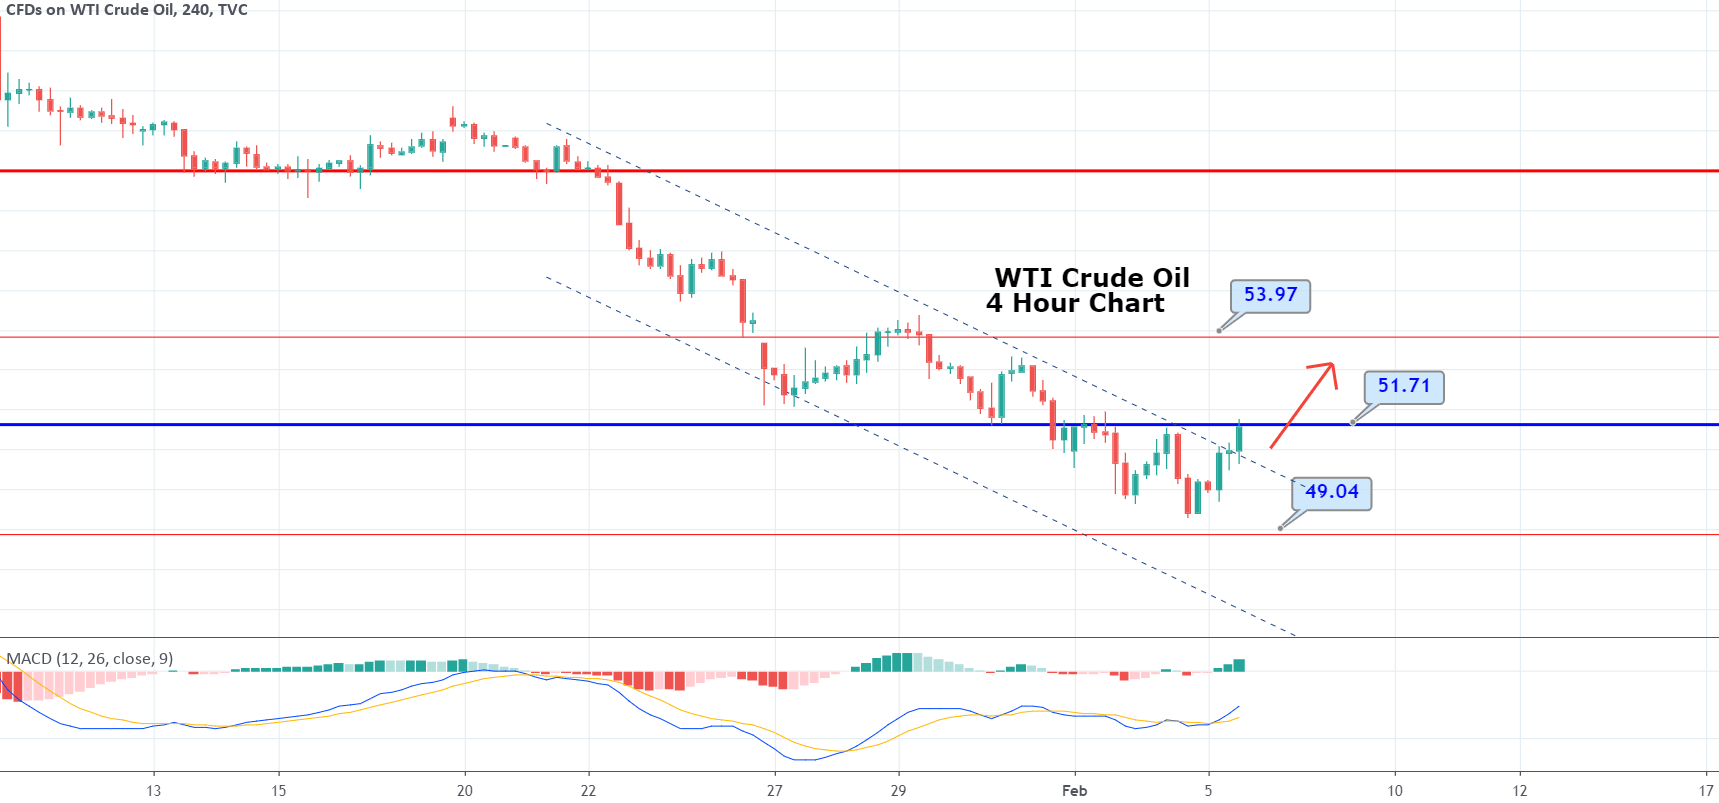
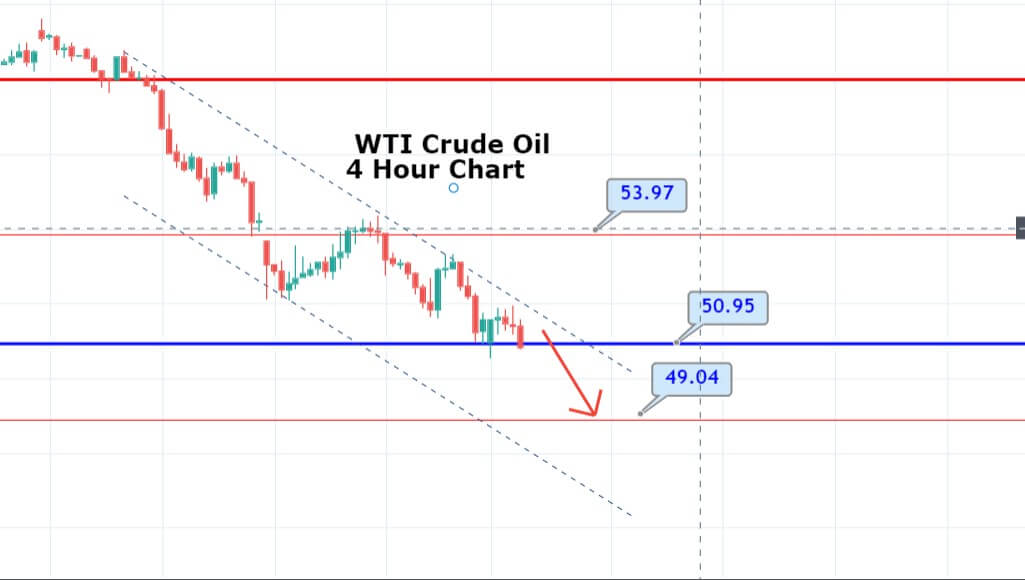
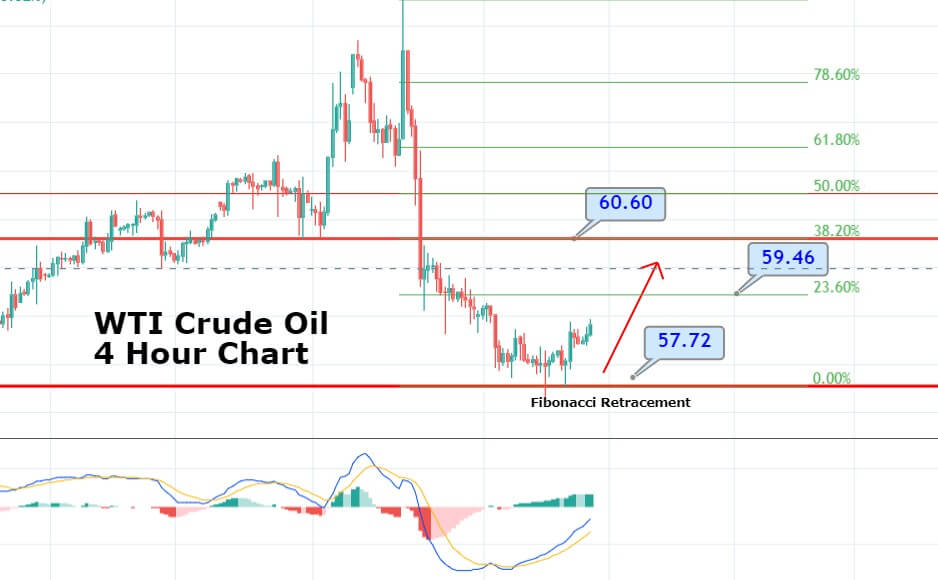
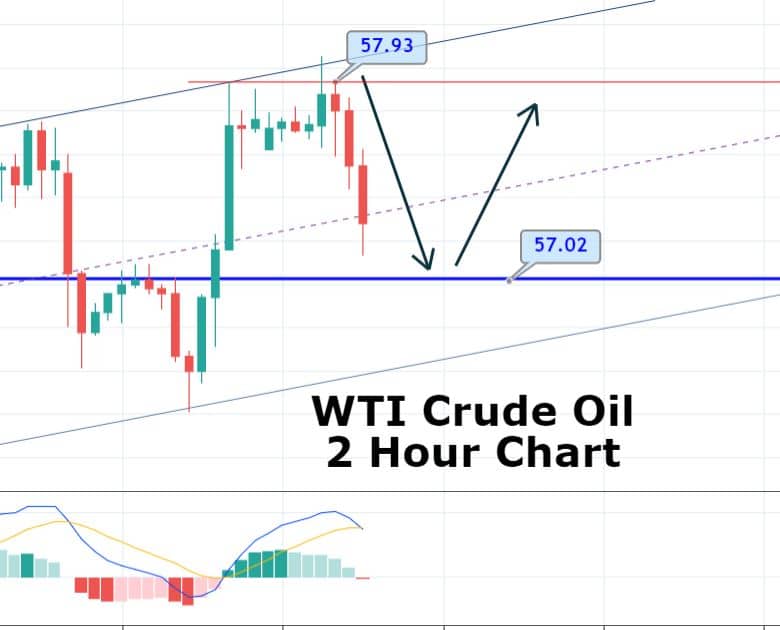
WTI Crude Oil – Trading Tips

The WTI crude oil is finishing the Asian session in a bearish mode, falling from 53 to 52.70. Crude oil is facing significant resistance at 53 levels today. The MACD and RSI are bearish as both of them are holding under their crossover levels of 0 and 50 respectively. 

Consider staying bearish on crude oil below 53 to target 52.65 and 51.80 levels. All the best! 


Categories
Forex Market Analysis

EZ Economic Sentiment Plunges To Its Lowest Level Since 2016

Hot Topics:

  • EZ Economic Sentiment plunges to the lowest level since 2016.
  • Pound falls after unemployment rate release.
  • Dow continues advancing with all eyes on the 25,000 pts level.
  • Expecting the Crude Oil Inventories data release.
  • Limited down movement before BoC MP decision.


EZ Economic Sentiment plunges to the lowest level since 2016.

The Eurozone ZEW Economic Sentiment in March dropped to 1.9, the lowest level since July 2016. The ZEW President Achim Wambach said, “The reason for this downturn in expectations can mainly be found in the international trade conflict with the United States and the current situation in the Syrian war.” 

Once the sentiment data was released, the common currency reacted dropping 0.25%. As we have envisioned, the Euro dropped from the blue box.

In the European stocks market, the German index DAX 30 continued its rally closing the session with a gain of 0.99%. The index is moving in an ascending channel; the price could still reach new highs until the 12,702 – 12825 area before starting a potential corrective move.

At the same time, the Dollar Index climbed from 88.94, the 3 weeks lowest level, advancing to its short-term pivot of 89.36. The price still is bouncing from the Potential Reversal Zone (PRZ). Invalidation level is in 88.52 level.


Pound falls after unemployment rate release.

The unemployment rate in March fell 4.2%, the lowest level in more than four decades. The GBPUSD pair plunged 0.31% from the highest level of the year. On the technical side, the pound has made a false breakout reaching 1.4376 and falling sharply below 1.43. We are now expecting a setup as a 1-2-3 pattern before we look to sell the pair.


Dow continues advancing with all eyes on the 25,000 pts level.

In the middle of the big companies earnings release, Dow Jones continued advancing, breaking up our key resistance level of 24,625 closing the session with gains of 0.59%. Our central vision is bullish with the target placed at the 25,407 level.

As result of the market risk on sentiment, the USDJPY has moved above our invalidation level (106.61), bouncing in the Potential Continuation Section (PCS); closing the session at 107.0, maintaining the bullish bias with the target placed at 108.41 level.


Expecting the Crude Oil Inventories data release.

Today, the weekly Crude Oil Inventory data released by the EIA is expected. On the technical side, the price is making a bullish channel in five movements. We estimate that Crude Oil could reach the 67.86 – 68.75 area where sellers could enter in action with their targets placed at 64 $/barrel.


Limited falls before BoC MP decision.

The most expected release for this session is the interest rate decision from the Bank of Canada. The analysts’ consensus expects that the BoC will keep its rate unchanged at 1.25%. Our vision is that the loonie could make a new low to the 1.2499 level, where it could find new buyers with their target at 1.274.

Categories
Forex Market Analysis

Opposing forces drive the markets in the upcoming week

Weekly Update

Regarding fundamentals, we are expecting opposing forces drive the markets in the upcoming week. Volatility has sparked bearing in mind the recent intervention of the USA in Syria. However, stock futures are up, and oil is down on hopes Syria attack a one-off.

Thus, we’ll focus on the most foreseeable variables. There are three variables that are mainly moving the markets

  • Protectionism
    • A less negative pressure in the short term as fears erase
    • Recent formal declarations by Chinese president rise expectations of a friendlier trade
    • There are still two months until Trump takes in action any tariff measure
  • Technology
    • Recent testimony by Mark Zuckerberg leaves good feelings and calms the markets
    • Relieves pressure on technology companies
  • Quarterly results
    • 2018 benefits are revised downwards
    • However, 1st quarter is expected to be robust with strong corporate volumes and margins which will be positive in the short term
Macro Data

This week there is no major macroeconomic event that will affect considerably the markets.

On Monday we have American Retail Sales which are expected to increase to 0.4% from the last- 0.1%. This can benefit the US Dollar. On Tuesday, the German ZEW Economic Sentiment can have some impact on the Euro and DAX. It is expected to decrease to -0.8 from 5.1. Finally, on Thursday, the American Manufacturing Index is released, and it is expected to decrease around one point.

In general, the macro outlook is more pessimist than positive. However, the previous three variables provide a more positive outlook and provide a better understanding than the macroeconomics events on how the markets will act this week. So that, we could expect a stabilization phase in the markets after the recent volatility. In general, slightly more positive than negative.


 USD Index

Weekly Chart


In the weekly chart, it is possible to appreciate how the USD Index is not only below the 200 EMA but also broke below the weekly support that has been retesting in the recent weeks and which has not been successful so far. In the short term is facing a bearish trend line caused by its recent devaluation.

During the first half of this week, there are not big news. However, on Wednesday, American Inflation numbers come out. It is forecasted that the core CPI will increase to 2.1% from previous 1.8%. Furthermore, on Friday, Moody’s published its USA rating, which right now has the highest rating possible with stable perspective. Hence, recent controversial policies from the American government making protectionism and a trade war a reality can alter the expectations for the mention economic events. In case the forecast does not vary the USD should not be hurt. However, an unexpected increase in the Core CPI and a rating downgrade from Moody’s can really hurt the Dollar.

Daily Chart 

The daily chart is similar to the weekly chart. The retest cannot break above the recently broken support and is facing more bearish pressure ahead. Nevertheless, it just formed double bottom pattern followed by a short-term bullish trendline. This week will be critical to know whether the bearish support is strong enough or it holds on to the current bullish trend.

EURUSD

Daily Chart

Regarding the EURUSD, it has been flat since February. Last month it broke its monthly bullish trend, and the consequently retest it.  From there, it has remained flat with no major fluctuations. However, with the recent uncertainties facing both the Eurozone and the USA it will not be surprising to see the EURUSD leaning towards a side. For now, it is holding at a strong resistance that dates back to September of 2017.  It is facing a couple of support and resistance which will help to know towards what side it will lean and leave the rectangle it is in now.

USDJPY

Daily Chart

Moving into the USDJPY, it has just bounced from a monthly bullish trend after doing a fake breakout and consequently bouncing back. A bullish trend could be considered since there are not big resistances ahead part from the 200 EMA and the recent bearish monthly trend. In the short term, there are two resistances not very strong, but that may cause a small retracement. However, the monthly support is stronger than the resistance it is locked up between.

GBPUSD

Daily Chart

GBPUSD seems to have no limits. At the beginning of the year, the Pound broke an important bearish trendline holding to its current bullish trendline. Moreover, last week just broke another key resistance. With no more important resistance ahead it has a clear path to keep up with the current upward trend. Maybe it is possible to do small retest as we saw with the previous one.

Crude Oil

Daily Chart

Recent political events, like the recent issue of the missile attack against Syria, have created volatility in the markets and consequently, the price of oil has been on the rise. After holding to the trendline and breaking above $65 it is possible to see a retest of the recent resistances it just broke above. Without more resistances ahead, analyst set that next target is $70 per barrel.

DAX

Daily Chart

Regarding technical, it is within a bearish trend that can be prolonged as there is still uncertainty in terms of politics and the recent macroeconomics event have not been reaching the forecasted ones. However, an improvement in the economic sentiment and political stability can help the DAX to break the ahead resistance and enter a bullish trend, leaving the current flat to bearish trend it is involved in now.

As commented at the beginning, on Tuesday the German ZEW Economic Sentiment is released. Hence, it can major point to decide whether it breaks the recent resistance and follows the daily bearish trend.

© Forex.Academy

Categories
Forex Market Analysis

What kind of trigger could boost the Dollar?

Hot Topics:

  • What kind of trigger could boost the Dollar?
  • Will the Eurozone continue to bring weaker economic data?
  • Could the UK CPI have reached their peak?
  • Fear of a new war or do we expect a new bearish leg?
  • A new higher high in oils is expected before it starts a corrective move.
  • Downward continuation limited before the BoC decision.

What kind of trigger could boost the Dollar?

The recent tensions originated by the strike made between the US, UK, and France on Syria and the reactions of Russia condemning the act could continue to increase the volatility in the markets. Another triggering factor could be the one originated by the US Retail Sales, which fell in February -0.1%. In March the analysts’ consensus is expecting an increase near to 0.4%. In technical terms, the greenback is still in a range and could be making a bottom formation. The control levels are 88.66 to 89.16. Invalidation level is below 88.1.


Will the Eurozone continue to bring weaker economic data?

This week the Germany and Eurozone ZEW economic sentiment reports were released. Particularly, the level of confidence fell to 13.4 in February from 29.3 reported in January. Probably it could be produced by a stational factor, like the weather conditions (winter time). In the panoramic chart, we are watching the current structure, as a corrective formation that could reach new lows in the 1.196 – 1.20 area. The invalidation level is above 1.2476.


Could the UK CPI have reached their peak?

In the last months, the British CPI apparently reached their peak, with a CPI of 3.1% (YoY) reported in the past year in November. Then in December and January, it achieved a 3.0%, but in February in line with other activity indicators, it has shown a decrease in the economic activity. It is probable that at these levels we are witnessing a stabilisation of the economic activity. In the same way, on the chart, we are watching a potential top pattern as a mother wave that could initiate a new bearish cycle with a target at the base of the sideways channel. The invalidation level is above 1.4345.


Fear of a new war or do we expect a new bearish leg?

The Japanese currency is moving in an ascending diagonal pattern in search for its long-term 108 level resistance. Despite the US attacks against Syria, the price continues moving according to our vision. We expect to find sellers once the price strikes the 108.2 – 108.4 area,  starting a new bearish leg.

The correlation between the Nikkei 225 and the USDJPY pair, bring us a clue about the moves that it could make. The first scenario is a breakout above 21,957 pts for a bullish continuation move, drawing the 22,764 – 23,050 area as a target. In the second scenario, if the price moves making a new bearish leg, we expect that move to reach the 20,660 zone, making a “mother wave”  and starting a new bullish cycle.


A new higher high in oils is expected before it starts a corrective move.

Last week the oils, Brent and WTI, reached their highest levels since 2014. For inverse correlation and as it was envisioned by us on January 12th, the Crude Oil VIX ETF reached the Potential Reversal Zone, where it might start a bullish cycle. In practical terms, once the WTI reaches the 67.8 – 68.7 area, it is likely that it begins a corrective move.


And concerning Brent Oil, we could see it at a new high, to 72.9 level,  before it starts a falling move.

Falls continuation is limited before the BoC decision.

Next Wednesday 18th the Bank of Canada (BoC) Monetary Policy Meeting will take place. The analysts’ consensus expects that the decision will maintain the interest rate at 1.25%. The price is making a downward cycle since March 19th, and our vision is that the Loonie might fall to the area between 1.245 – 1.254, where it could start an upward move, at least up to 1.274. The invalidation level for the ascending movement is 1.225.


Categories
Forex Market Analysis

Dolar Index closes bearish helped by mixed CPI data

Hot Topics:

  • Dolar Index closes bearish helped by mixed CPI data.
  • EUR-USD is losing momentum.
  • Manufacturing Production (YoY) falls, and pound closes slightly upward.
  • BoJ – Kuroda keeps the promise of monetary policy.
  • Crude Oil climbs to the highest level since 2014.

Dolar Index closes bearish helped by mixed CPI data.

The index of the greenback yesterday closed down 0.04%, finding support at level 89.03 weighed down by mixed inflation data. On the one hand, Core CPI (YoY) rose to 2.1% in March from 1.8% registered in February. On the other side, the Consumer Price Index CPI (MoM) fell to -0.1% in March, while in February it recorded an advance of 0.2%. We continue to observe the lateral range in which the price is with a bearish bias. (Click on the chart for full resolution).


EUR-USD is losing momentum.

The pair of the single currency is losing momentum, in the fourth consecutive trading session, the euro advanced 0.10% finding resistance at 1.2395. In an interview with Reuters, the ECB lawmaker Ardo Hansson said that the ECB “needs to be patient and eliminate its stimulus very gradually.”

Although the ECB has kept the interest rate at low levels and has maintained its policy of buying bonds, lawmakers are debating that it is time to start cutting this policy. ECB legislator Ewald Nowotny, meanwhile, said he would have “no problem” in raising the deposit rate from -0.4% to -0.2% as a means to normalise monetary policy.

In this macroeconomic context, the euro is reaching a key area in the range 1.2412 – 1.245. Should not exceed the level 1.2476, the pair could make a new bearish leg. In the long term, we still have our eyes on 1.26 as the end zone of the EUR / USD bullish cycle.

Manufacturing Production (YoY) falls, and pound closes slightly upward.

Manufacturing Production (YoY) fell to 2.5% in February well below the consensus that estimated an advance of 3.3%. The sector that was most affected was the construction sector with a decline of 1.6% in February. The National Statistics Office attributes to a large extent these low figures to the effect of severe weather.

On the technical side, we are observing a possible corrective process that could begin to be developed from area 1.42 – 1.425 with a potential level of invalidation in over 1.4345 coinciding with the highest level of the year.


BoJ – Kuroda keeps the promise of monetary policy.

The Governor of the Bank of Japan, Haruhiko Kuroda, reiterated his optimistic view on the expansion of Japan’s economy, affirming that “With the improvement of the product gap and the medium to long-term inflation expectations observed, we expect that inflation will accelerate as a trend and go to 2 percent. ”

On a technical level, on the one hand, the USD-JPY is still in a limited lateral range between 106.64 and 107.49, the predominant bias is bullish and increases its probability of strength as it closes above 108. The level The invalidation of the bullish sequence is 105.66.

On the other hand, by a positive correlation concerning USDJPY, we see in the Nikkei 225 Index within a long-term bearish pattern developing an ascending diagonal formation, which in case of exceeding 21,957 could lead to exceeding 22,500 pts.


Crude Oil climbs to the highest level since 2014.

First, it was the turn of the Brent oil; now it is the turn of the Crude oil that has climbed to the highest levels since 2014, reaching 67.36 US $ / Barrel, while the Brent oil climbed to new highs reaching $72.69.

For the Brent Oil, although the trend is bullish, the closest resistance is $72.91, while the level of invalidation of the bullish cycle is below $67.

As with the Brent Oil, the Crude Oil is in a free climb up to $ 70.7 as long as it remains above the $64 level.

On the opposite side, by inverse correlation, the Loonie remains in free fall with a target at the base of the bullish channel, the impact zone could be between 1.2456 to 1.235.


Categories
Forex Market Analysis

Volatility moves towards Europe

Hot Topics:

  • S. Core PPI (YoY) reaches the highest level since 2012.
  • Volatility moves towards Europe.
  • The pound rally continues due to the weakness of the dollar.
  • Jinping reduces risks of a Trade War.
  • Oil Brent reaches the highest level since 2014.

U.S. Core PPI (YoY) reaches the highest level since 2012.

The signs of strength in the economic growth of the United States continue, the Underlying Producer Price Index (YoY) reached 2.7% in the March period, the highest level since June 2012. The Core PPI (MoM) index, for its part, it reached 0.3% on the expectations of analysts who projected 0.2%. According to the Bureau of Labor Statistics, 70% of the increase in final demand is attributed to a rise of 0.3% in the prices of final demand services, in the same way, transport and storage services for final demand increased by 0.6 %. The increases in the level of inflation for producers are expected to have an impact on the Consumer Price Index, which will be published this Thursday.

Despite these positive macroeconomic data, the greenback index continues its strong depreciation, which has lost 2.83% in the year. Today is closing with -0.25% of loses. We are paying attention to the zone between 89.15 and the 61.8% of Fibonacci retracement level, where the Index has found support.

Volatility moves towards Europe.

The risks of the Trade War between the United States and China are disappearing more and more with the bilateral attempts to resolve the conflict in a friendly way. However, in Europe, the scenario that seemed full of geopolitical stability is changing. This Sunday 08, Viktor Orban won the elections in Hungary for the fourth time in a row. With an utterly autocratic speech, the nationalist Prime Minister proposes an anti-immigrant policy and open attacks towards the European Union. Hungary refuses to comply with the agreed European migration policy, that is, accept quotas of Syrian refugees, in the same way as the United Kingdom raised in one of its arguments against Brexit. It should be added that Mr Orban is not alone in this political tendency; he has found allies in power in Poland, the Czech Republic, Slovakia and Italy. All of them are willing to reject the obligation to accept refugees and respect the right of free movement.

The euro has closed with gains for the third consecutive session with a 0.29% of advance. The pair shows a bullish move in the middle of a sideways formation. In the last trading session, the price has found resistance at 61.8% of Fibonacci retracement

The pound rally continues due to the weakness of the dollar.

The pound continues for the third consecutive session in a bullish rally advancing 0.64% in the week and has gained 0.35% in the last trading session. All this occurs in the context of the weakness of the dollar despite the excellent macroeconomic data of the United States. The level of support to be controlled is 1.4145; the key resistance level is 1.42 as a psychological level.

Jinping reduces risks of a Trade War.

Chinese President Xi Jinping has promised to reduce import tariffs by alleviating the fear generated by the escalation of bilateral tensions between the United States and China. In a speech held at the Boao Forum, President Jinping promised to open the Chinese economy further, protect the intellectual property of foreign companies. These words filled the market with optimism, leading the indexes to move positively, the Dow Jones Index advanced 1.48%, while the yen reduced its attractiveness as a refuge, leading the USD-JPY to close with 0.41% of earnings.

The USD-JPY pair is forming an ascending diagonal pattern, which still has space to follow a rally, the closest resistance levels are 107.49 and 108, and the support level to control is 106.64.

The Dow Jones index, which is within a descending channel, the price is for the control support level at 24,037.3 and is developing a possible upward diagonal formation whose closest resistance is at 24,630, a level that coincides with the Upper part of the bearish channel. Bullish positions are valued as long as they do not fall below the 23,749.3 level.

Oil Brent reaches the highest level since 2014.

The euphoria of the reduction of the economic tensions between the United States and China due to the sayings of Jinping, not only has motivated to the indices but also the oils. The Brent has reached its highest level since 2014, reaching the $ 71.03. Crude Oil, on the other hand, approached two-week highs reaching $ 65.76. The oil rally and the Dollar weakness also benefited to the pair USD-CAD (by inverse correlation) which closed at lowest levels since February testing the psychological level 1.26 approaching the level of Fibonacci retracement 61.8% at 1.2583.

Our central view for this highly correlated group has been bullish; but we currently prefer to maintain a neutral position considering that once the oils reach specific levels in the long term for their structures, they should make a significant corrective movement that will allow us to join to the trend. As long as Brent does not reach the area between $ 71.26 and $ 72.91, and Crude Oil does not come close to $ 69 and $ 70, we do not expect a start of a significative correction.

In the case of the USD-CAD pair, once it reaches the base of the channel, it is expected that a bullish move could begin.

©Forex.Academy


Categories
Forex Market Analysis

USOIL (WTI) – EXPECTING TO SELL THE SHOOTING STAR (UPDATED).


Instrument: USOIL (WTI)

Main Outlook: Bearish

Forecast Timeframe: 2 to 3 weeks.


Summary.

In the original Long-Term Pick, we proposed the level of $63 as the first profit target. Today, the USOil has reached our first profit, now is the time to move the SL to breakeven and let the trade run to the final profit target of $59.75.

Charts.

Figure 1: USOIL Original Scenario.(Click image to enlarge)


Figure 2: USOIL Updated. ( Click image to enlarge)