Categories
Forex Videos

Forex! USDJPY Forecast – Support & Resistance Areas Explained!

Where next for USDJPY – Support and Resistance areas explained

Thank you for joining this Forex academy educational video. In this session, we will be looking at a daily chart of the US dollar Japanese yen pair and looking at support and resistance lines.

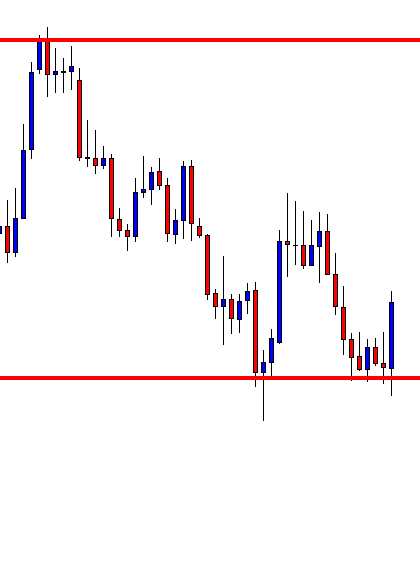
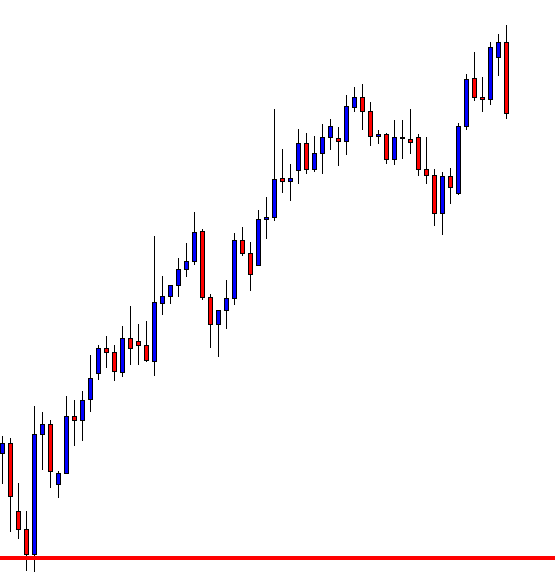
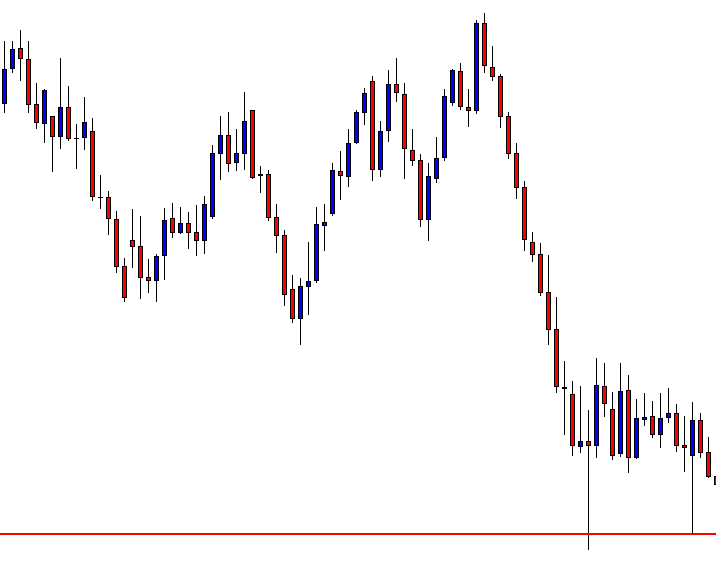
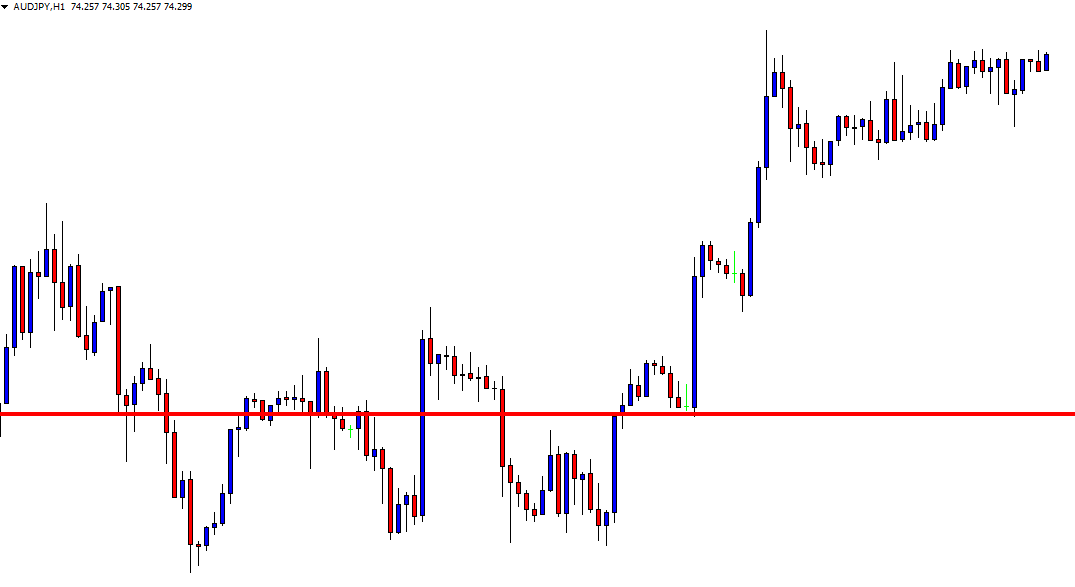
It has been a tumultuous few months for the US dollar Japanese yen pair. With a high in February of 112.00 down to a low a few weeks later in March of 101.16. Many investors will have been completely caught offside, and wins and losses for those who got it right or wrong will have been substantial.
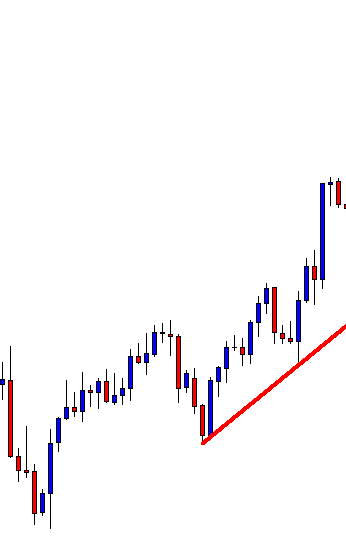
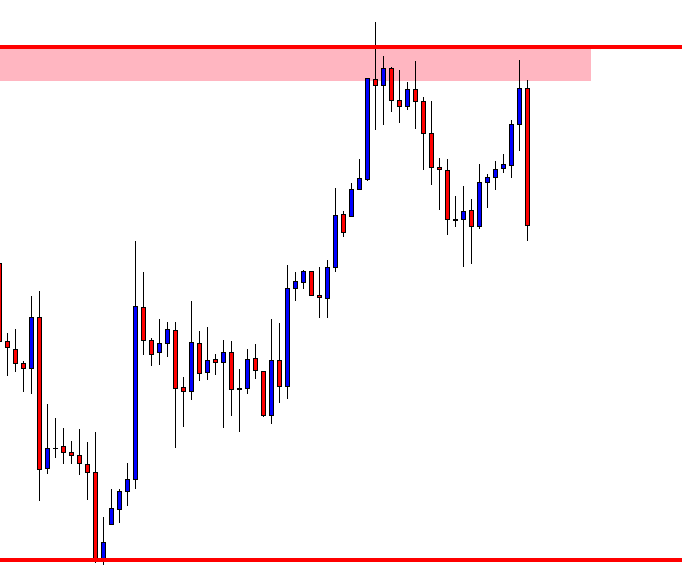
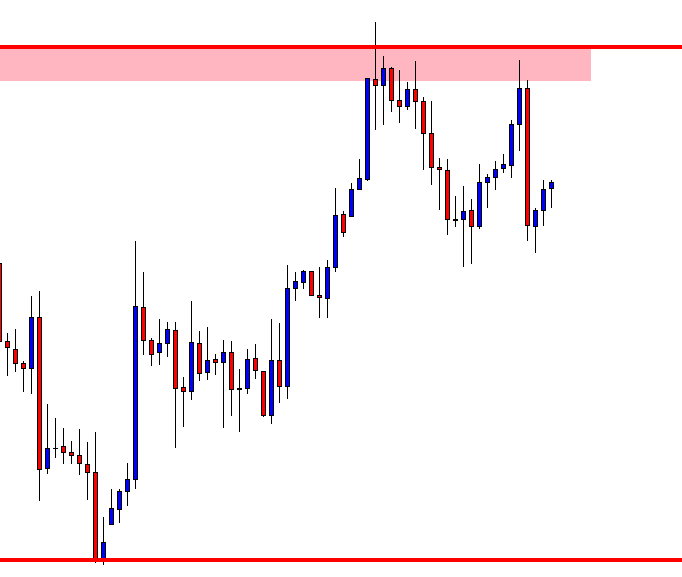
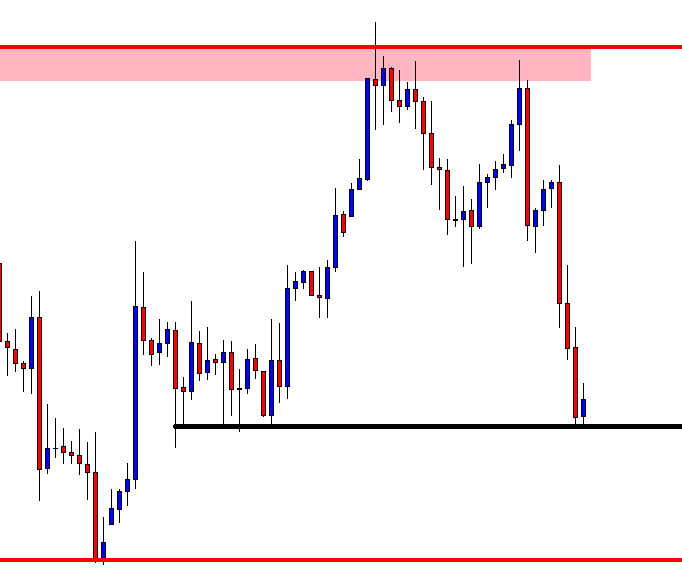
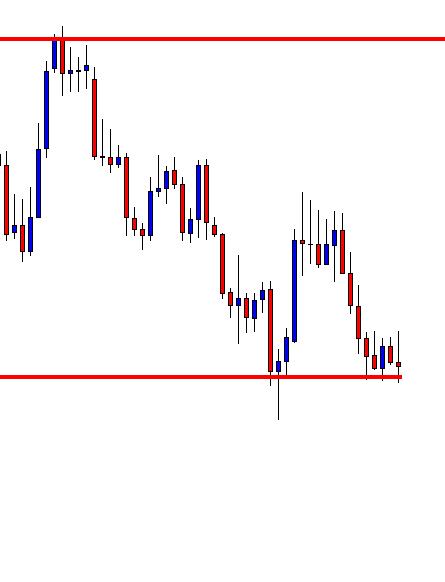
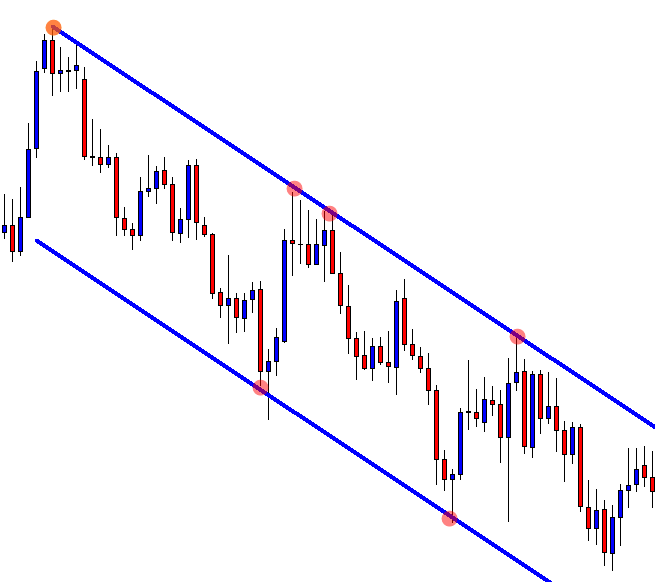
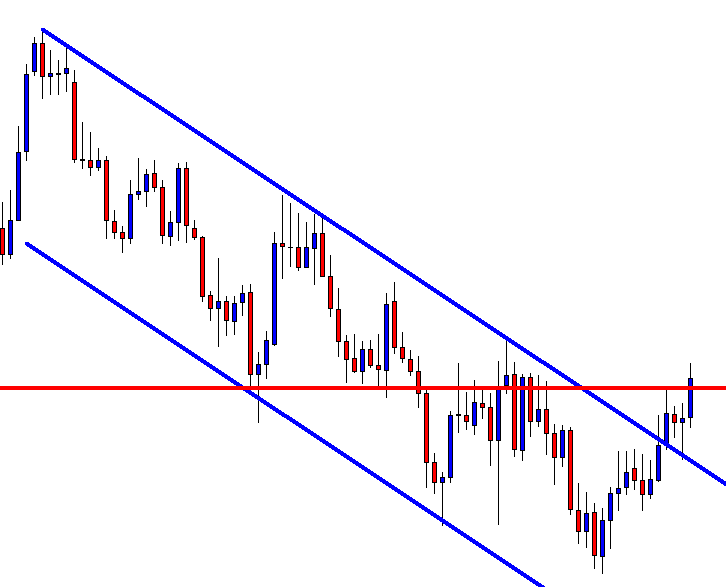
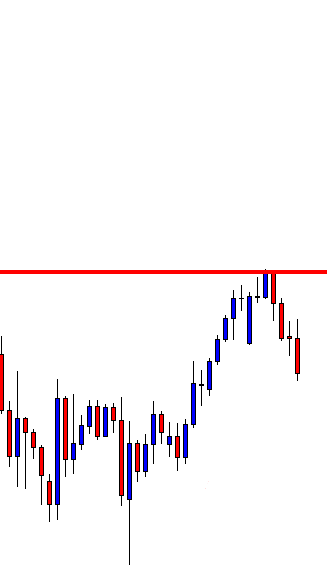
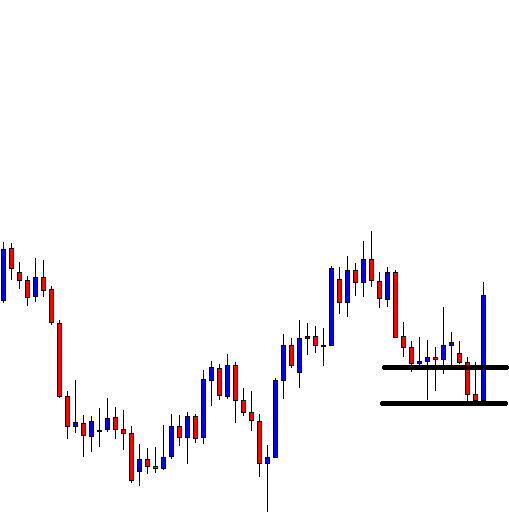
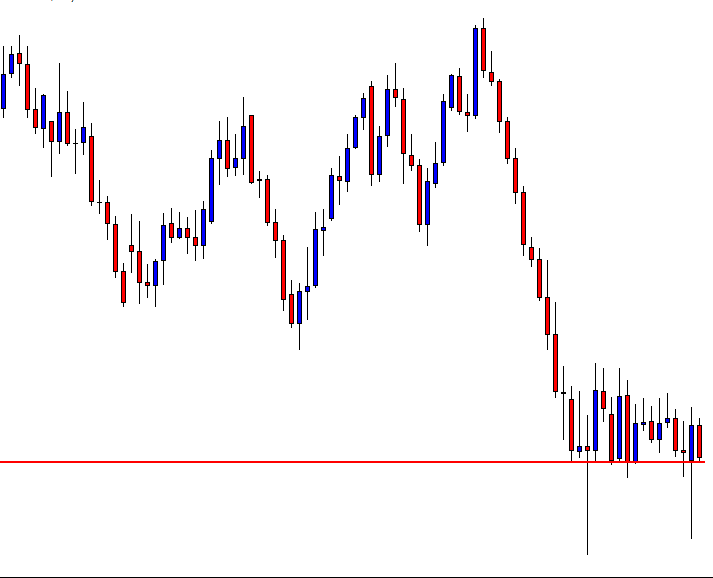
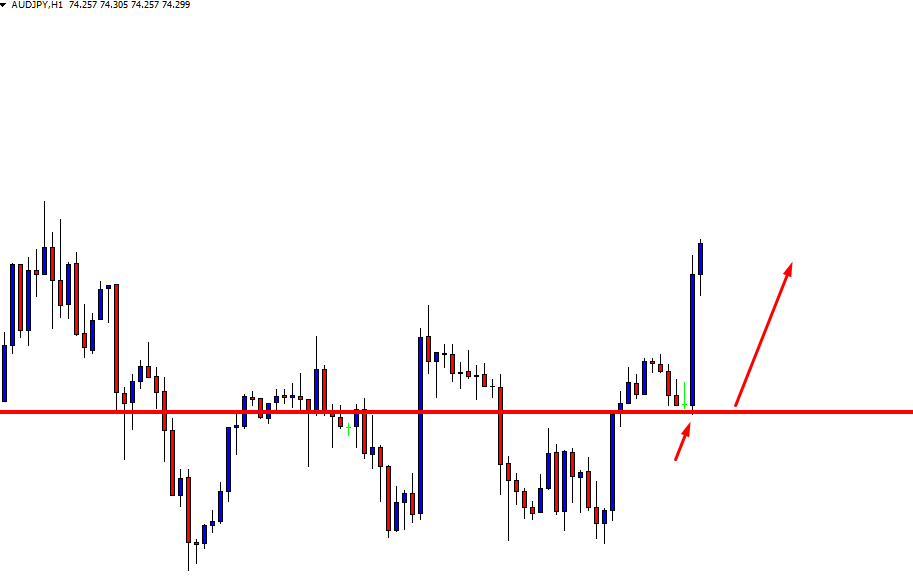
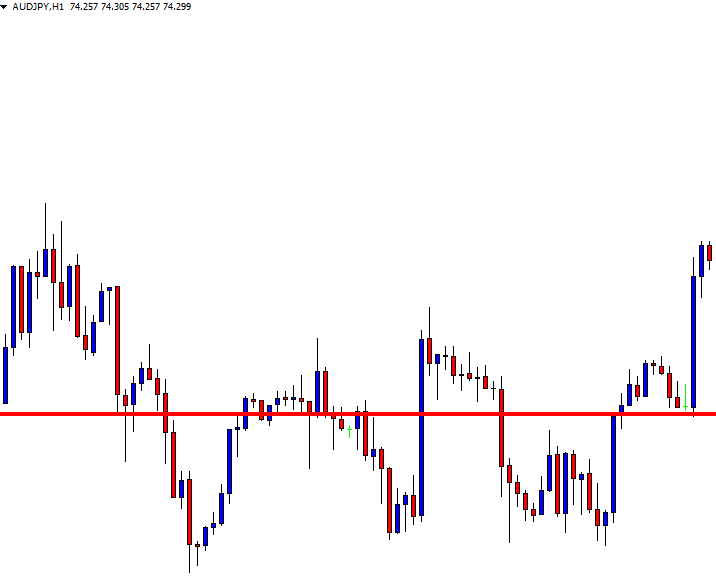
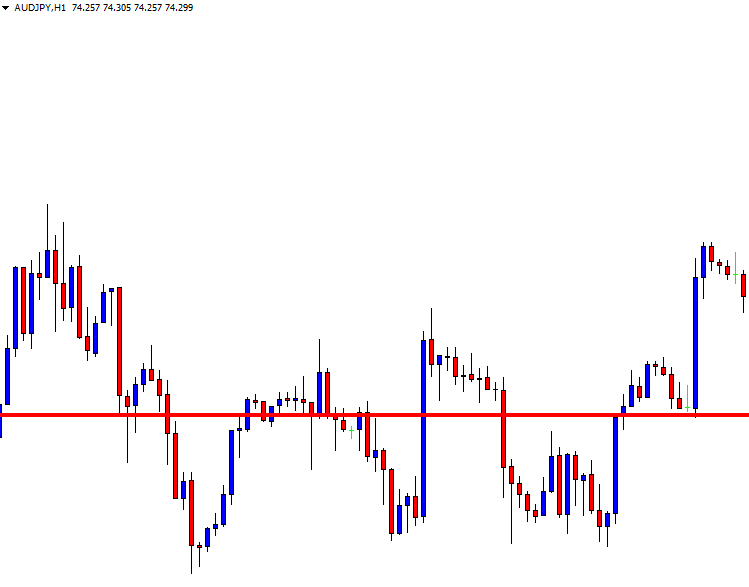
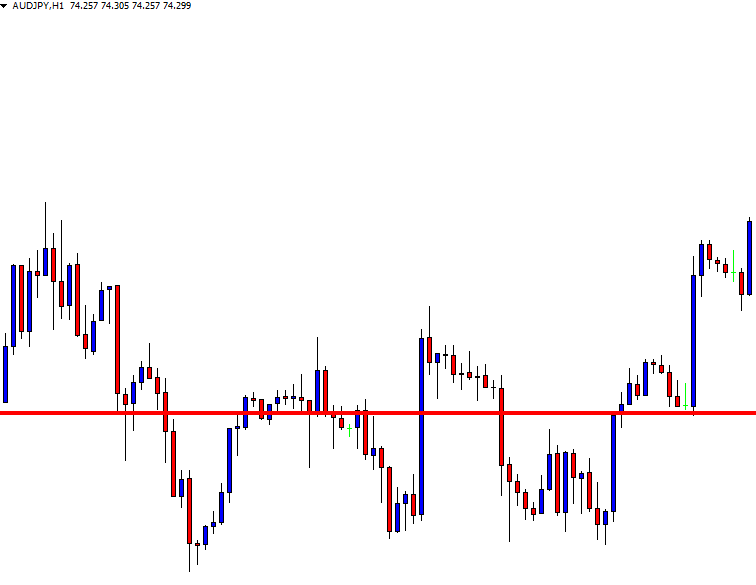
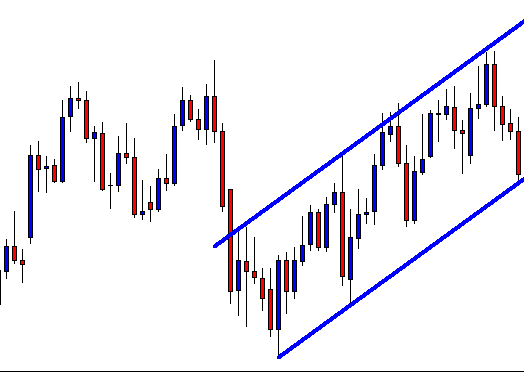
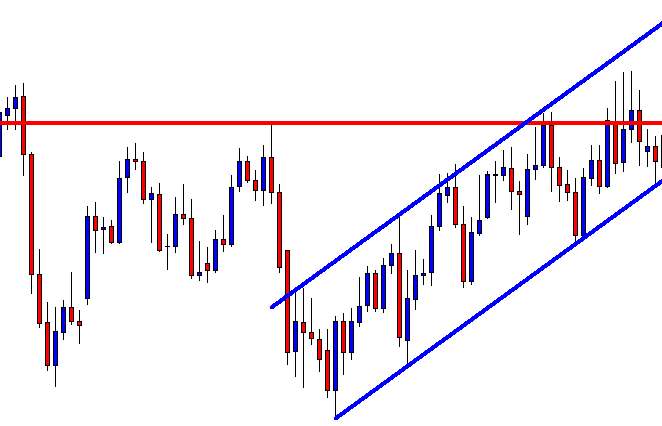
When analyzed on the daily chart adding simple support and resistance lines, we see clear patterns emerging of price action and where the exchange rate forms peaks and troughs.
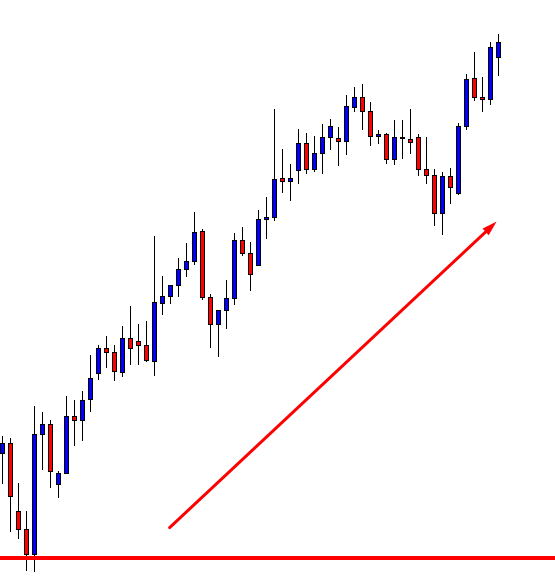
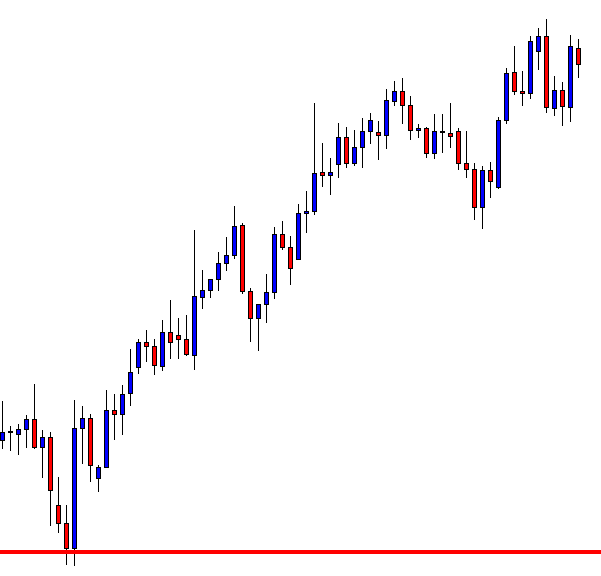
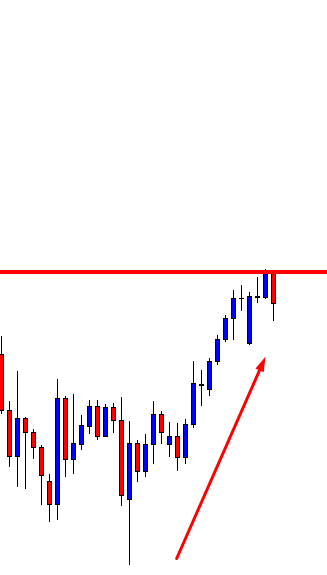
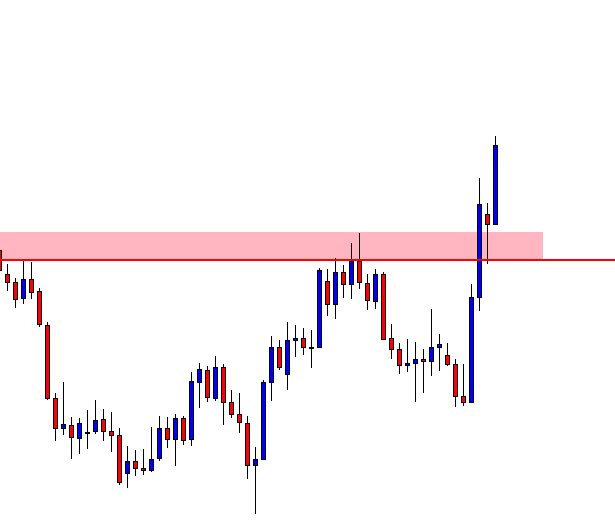
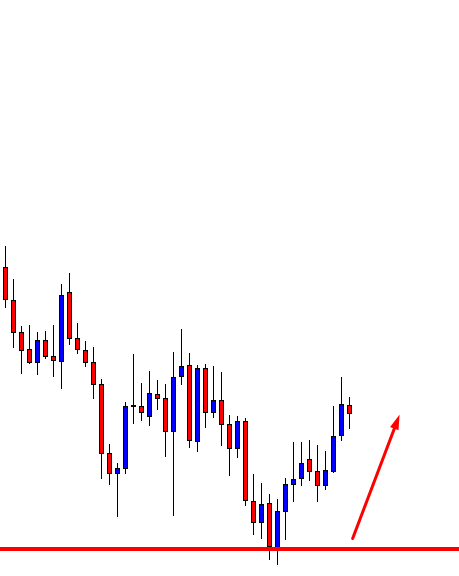
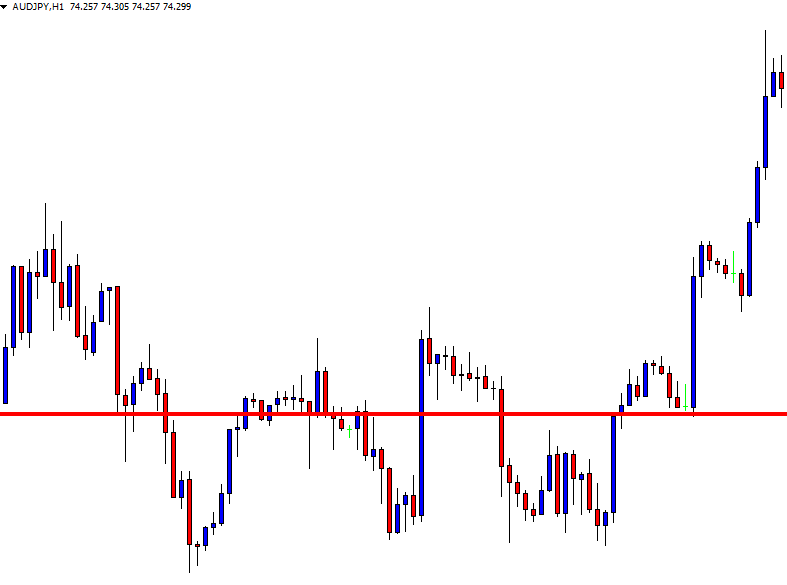
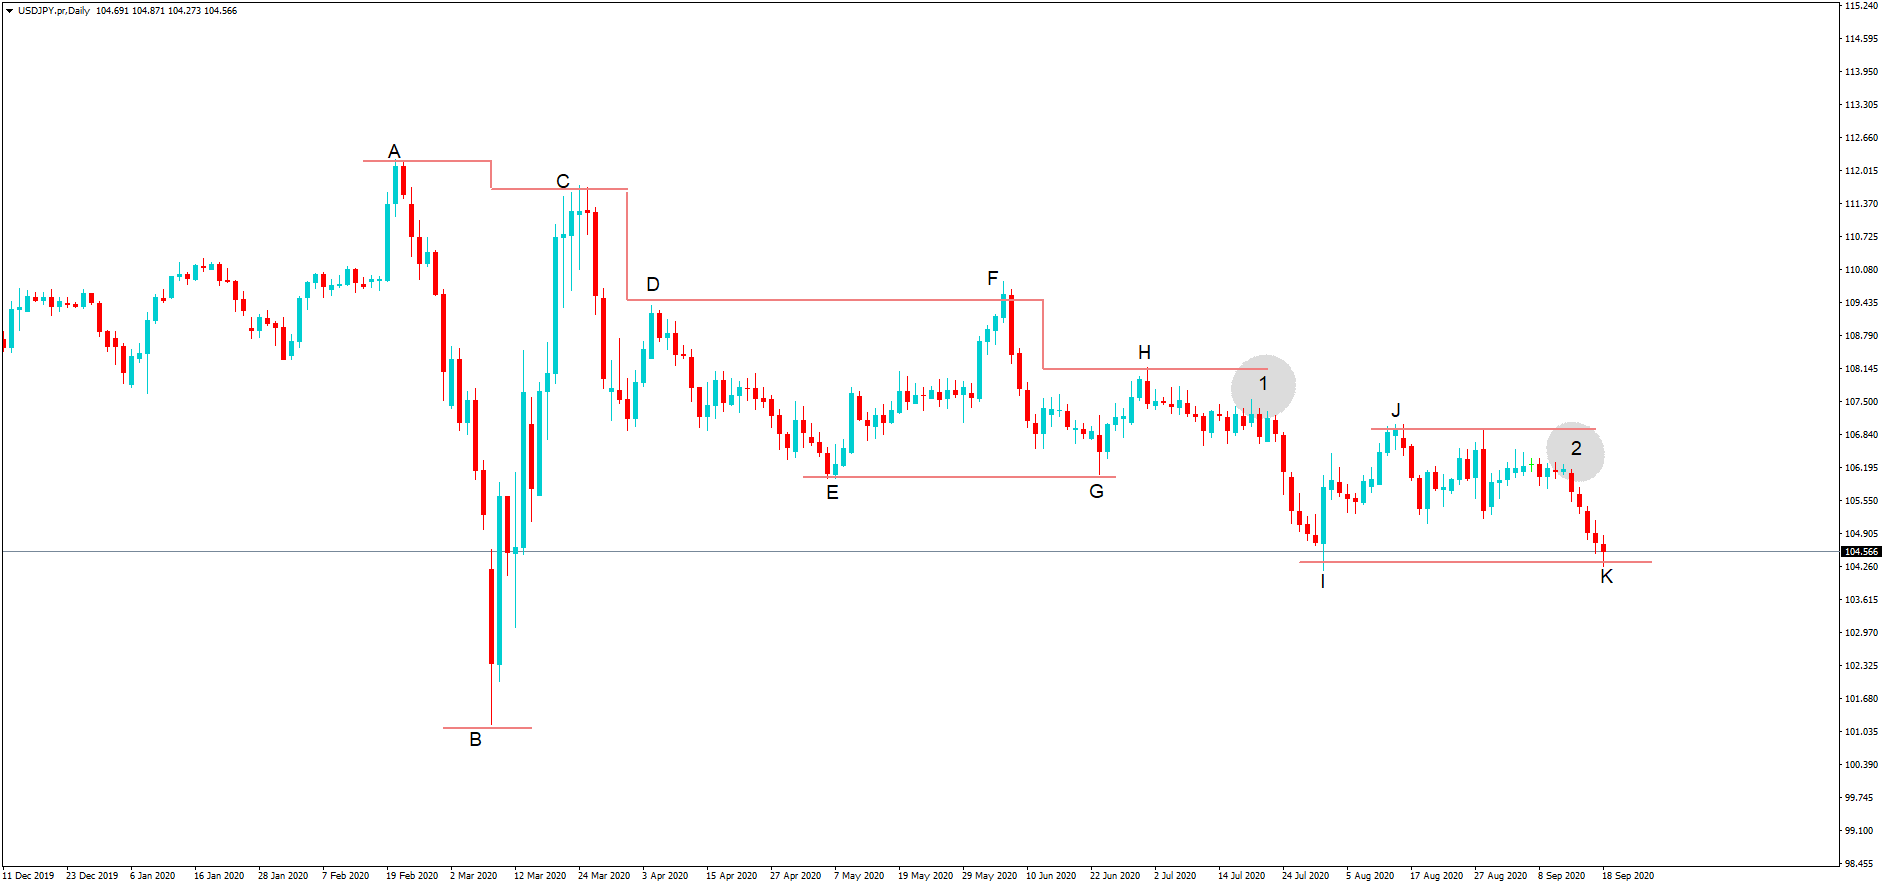
The fall in the pair from position A to position B was down to the coronavirus’s impact and where the Japanese yen is favored in times of such crisis due to its safe-haven status. However, this huge move had to become oversold, and of course, it did just above the key 101.00 level, and where we saw a rally back to position C, which incidentally is a step lower than position A. Typically, we find that institutional traders will pull out of a huge upside momentum trade slightly before a previous high, or a previous low if the situation was reversed because they fear that in this situation sellers are lurking at the previous high level, and that is proved when the pair pulls lower.


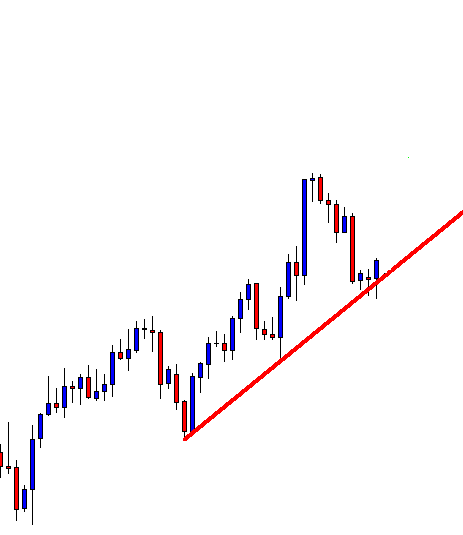
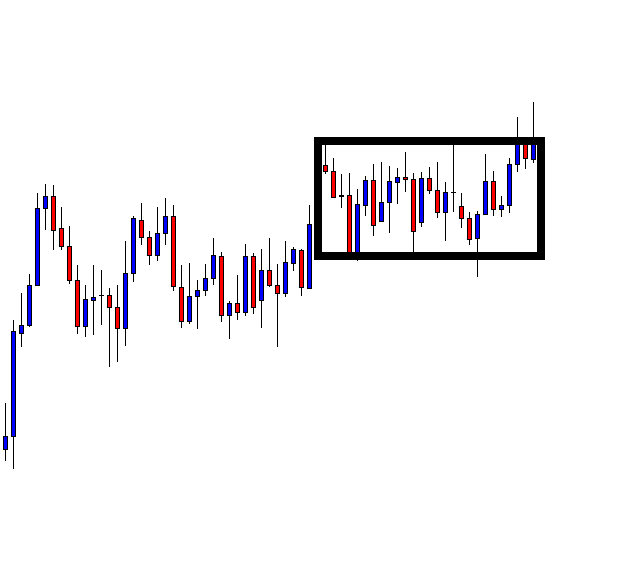
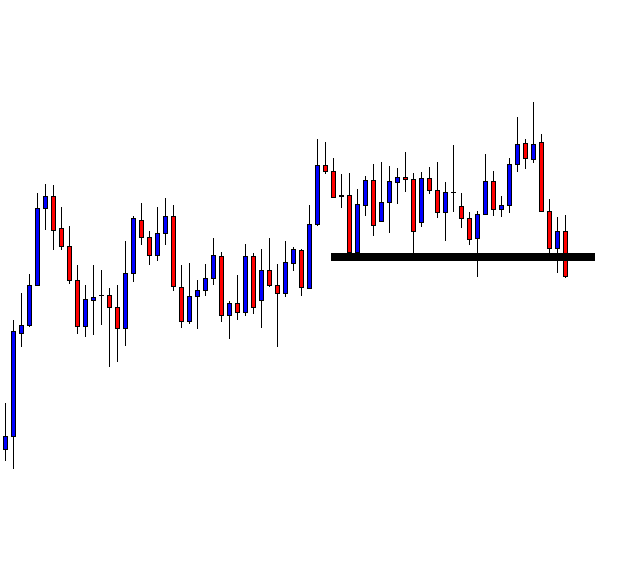
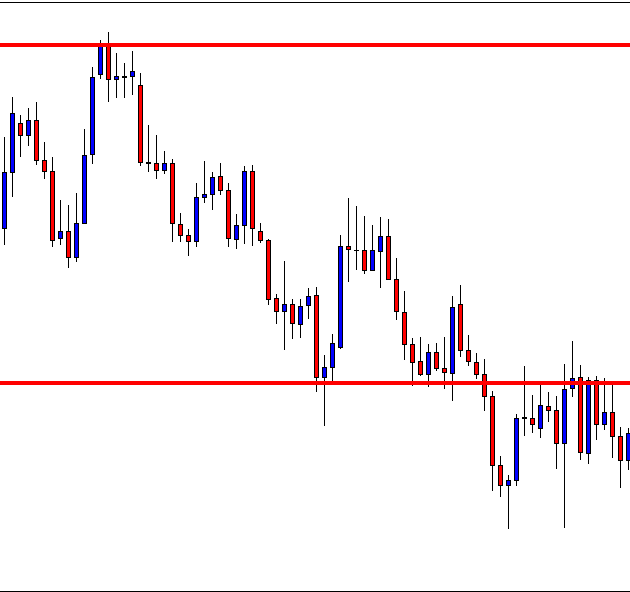
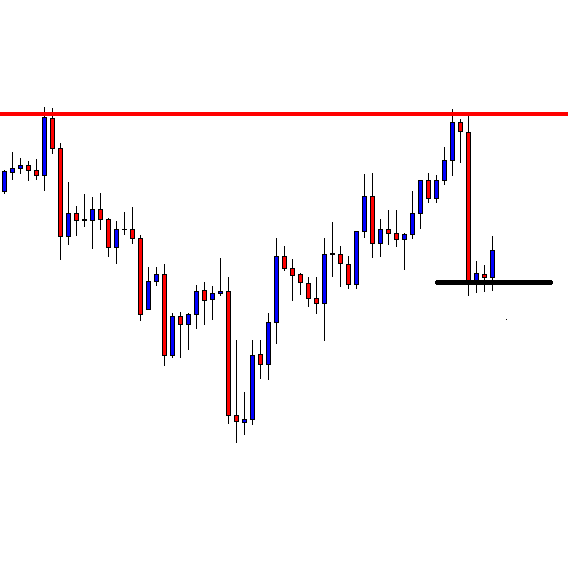
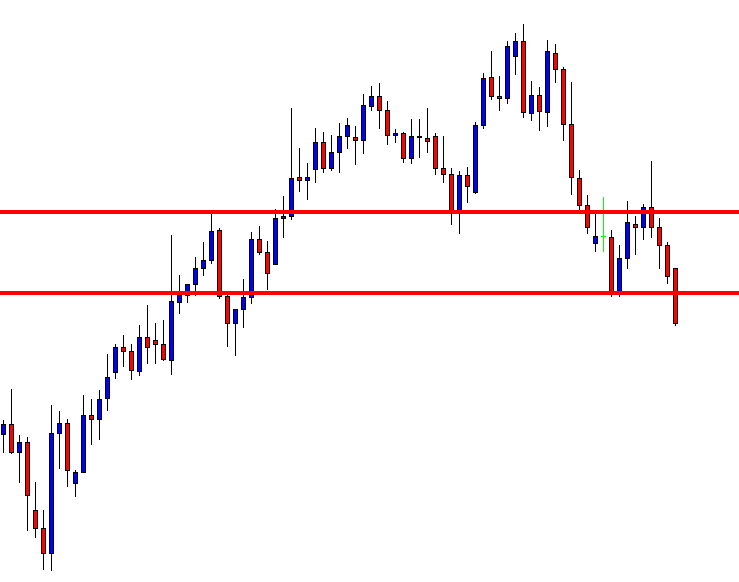
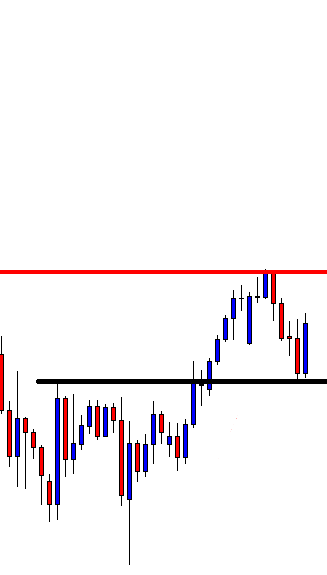
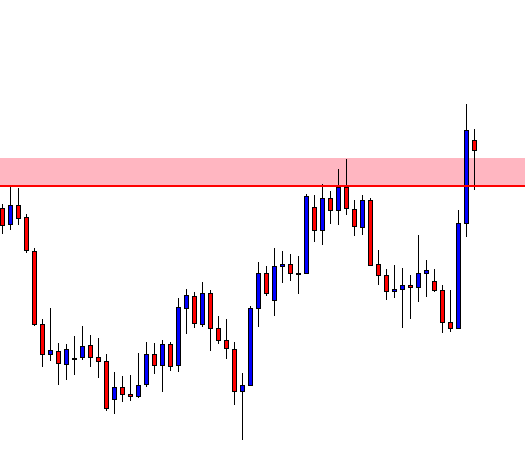
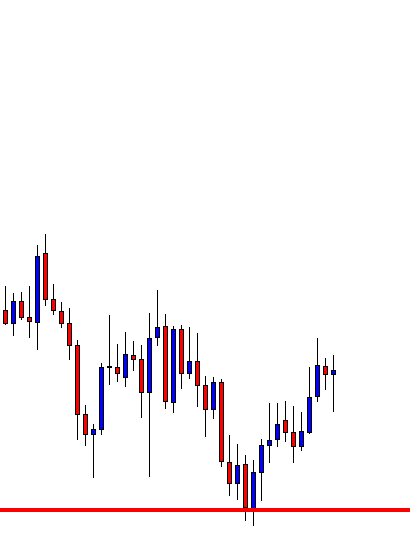
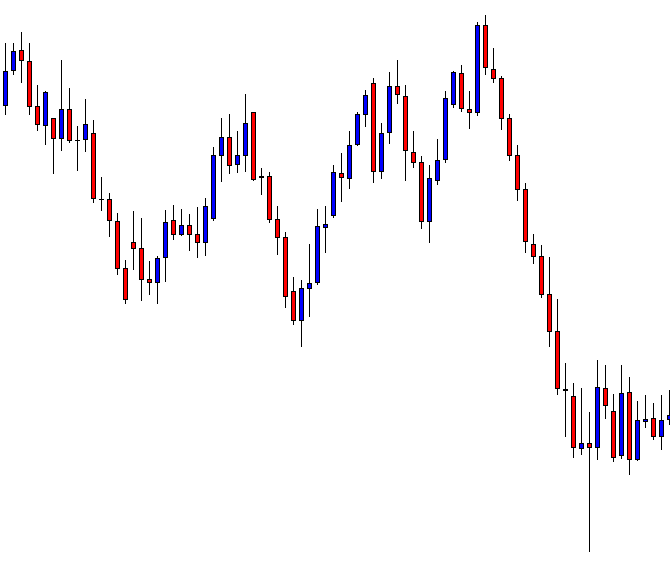
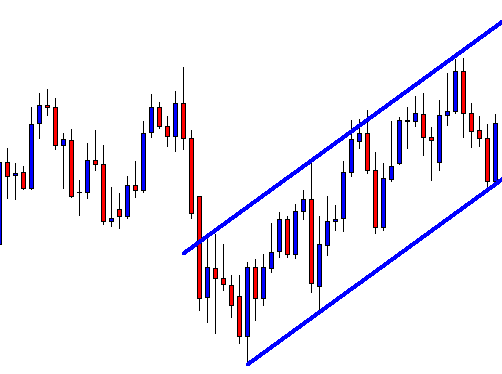
We then see a period of consolidation between positions D E and F. And a subsequent lower step to G and where the pair only manages a following high at position H, again a defined step lower than the previous high of position F.
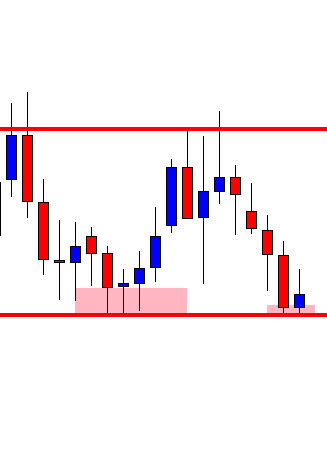
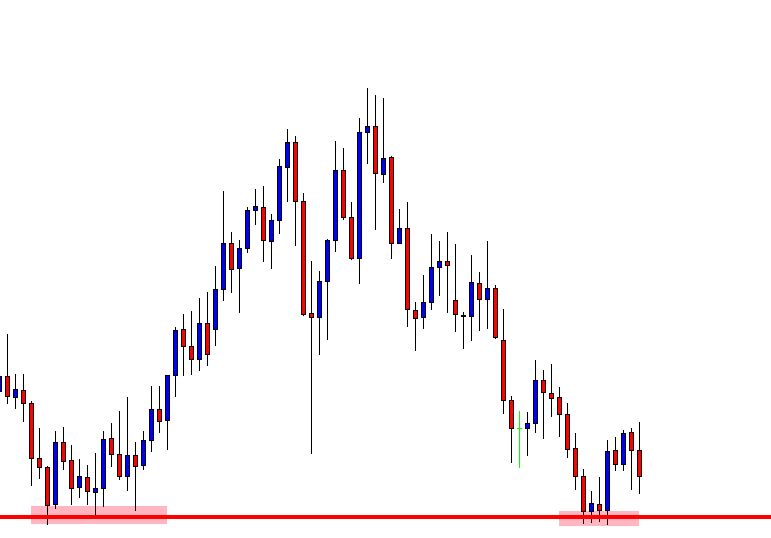
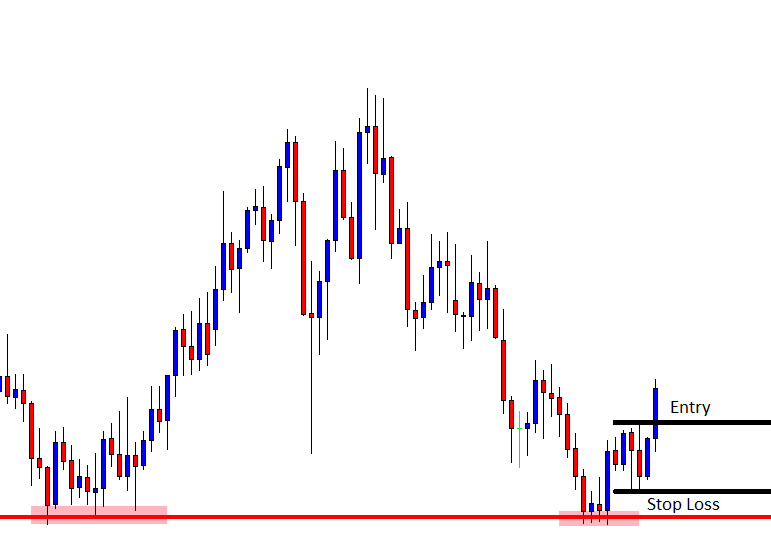
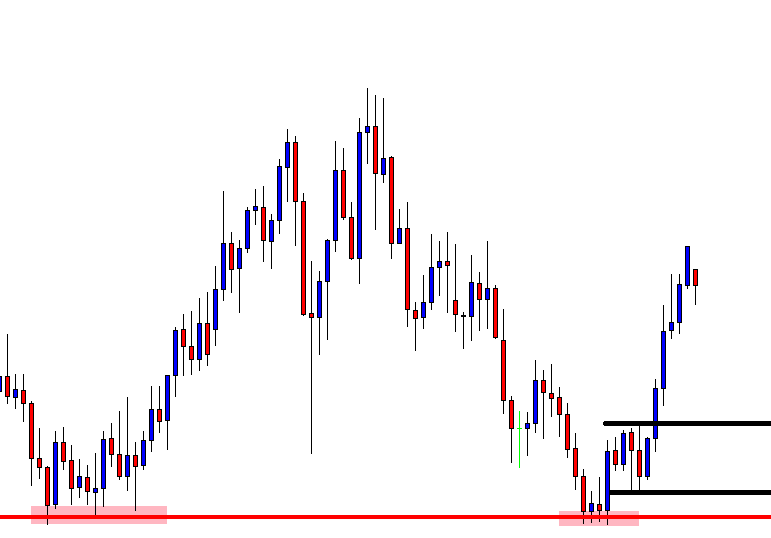
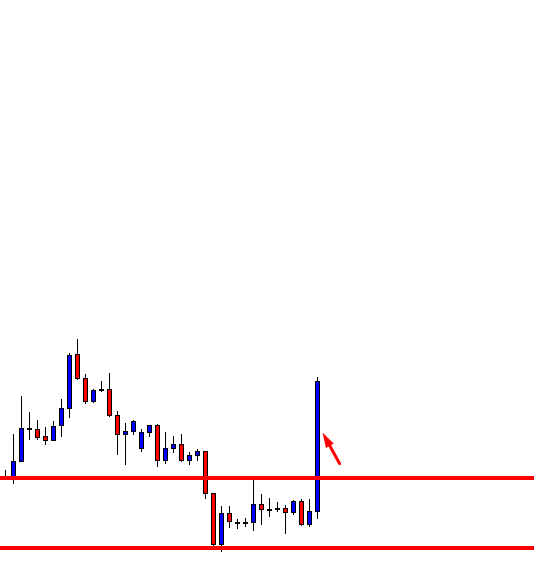
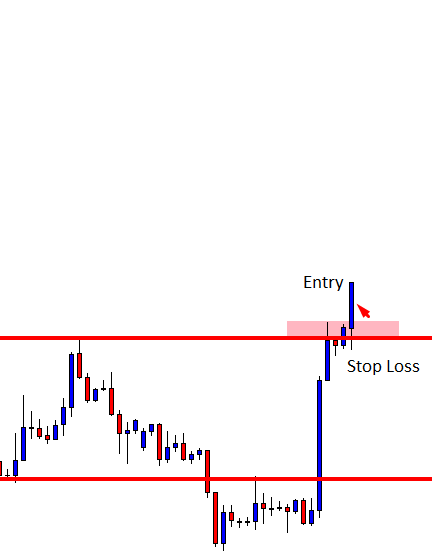
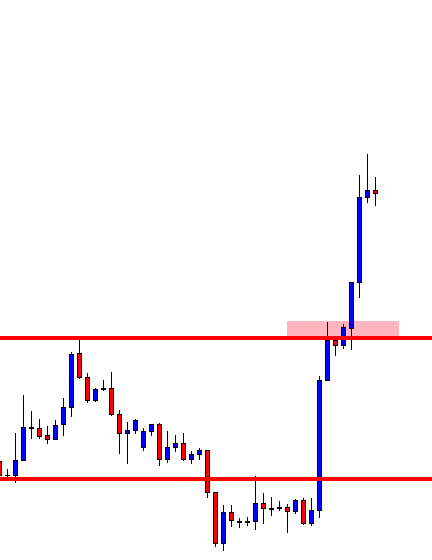
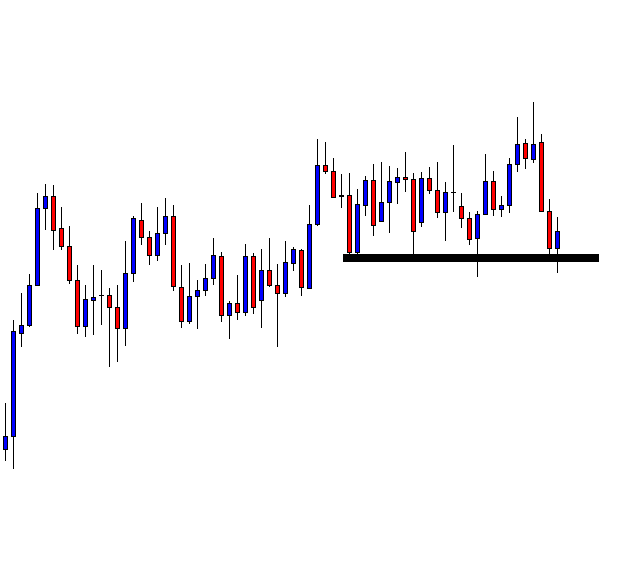
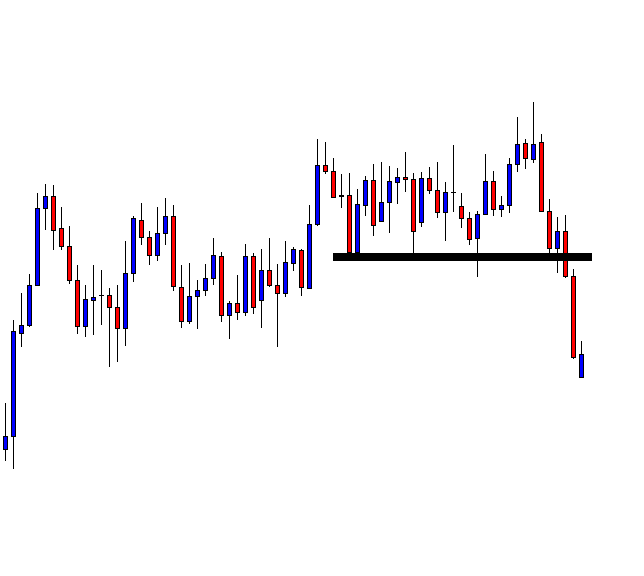
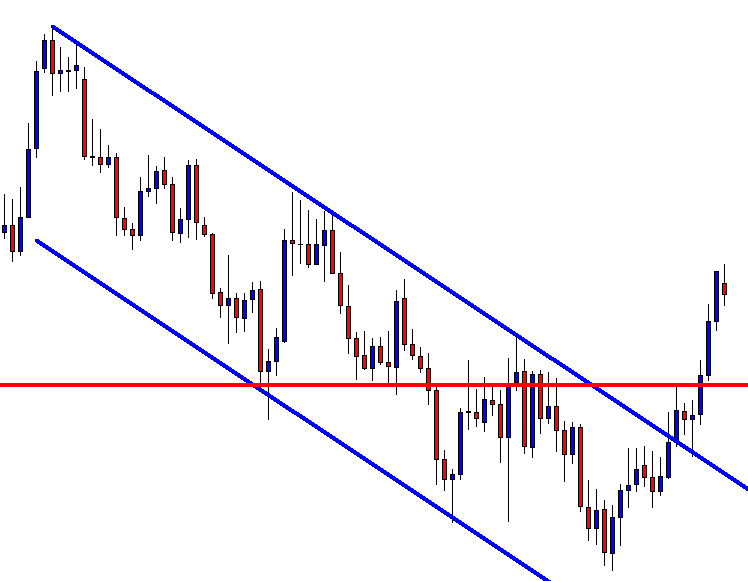
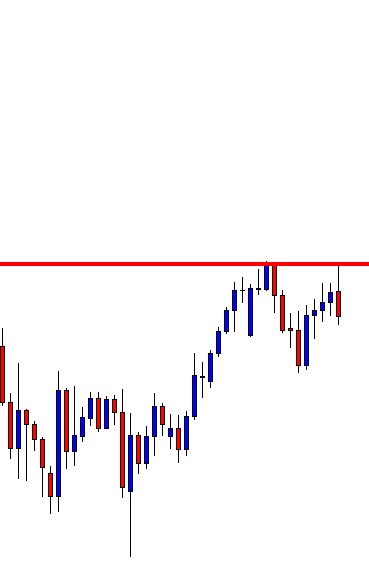
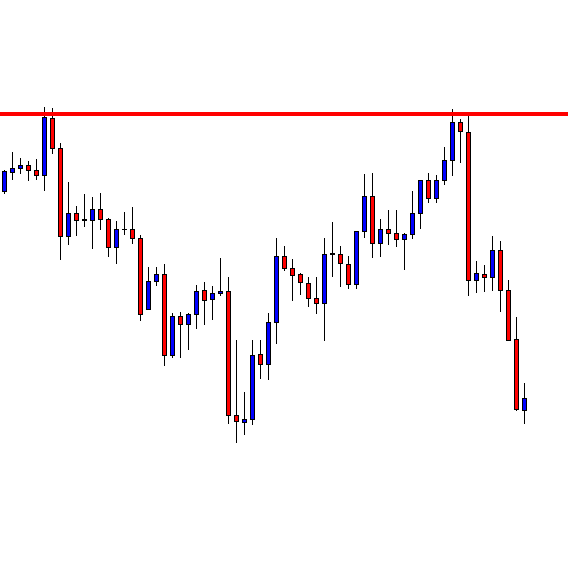
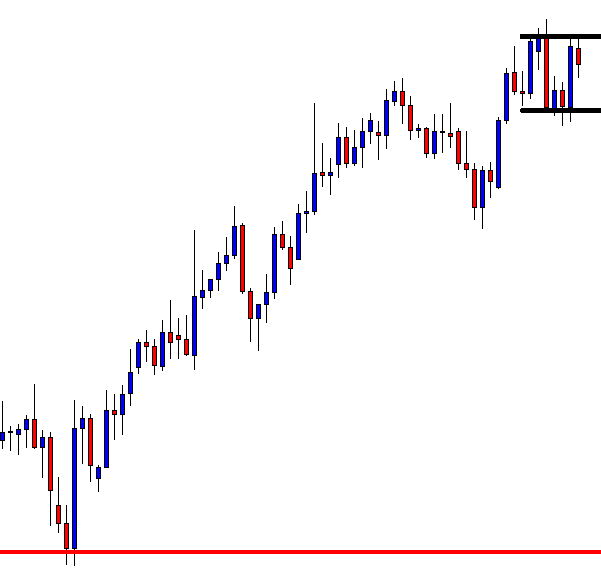
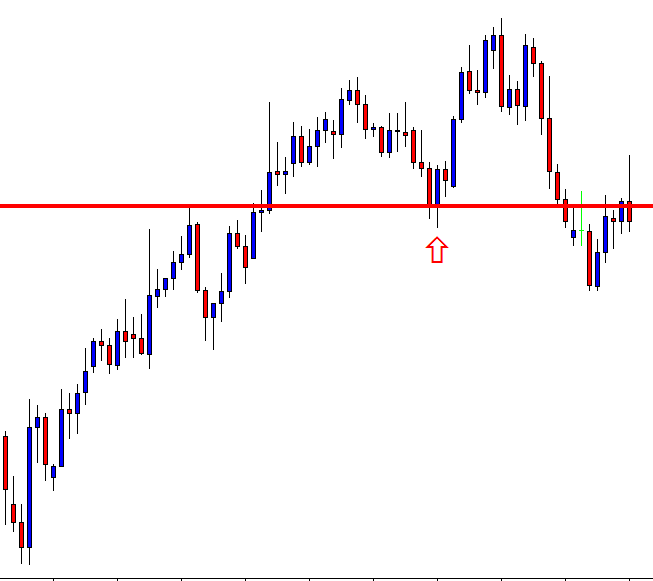
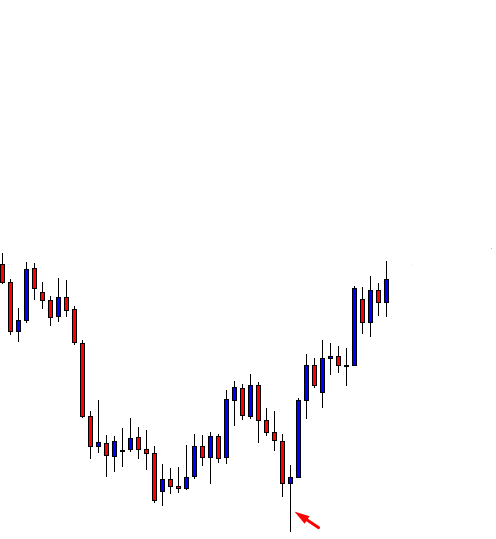
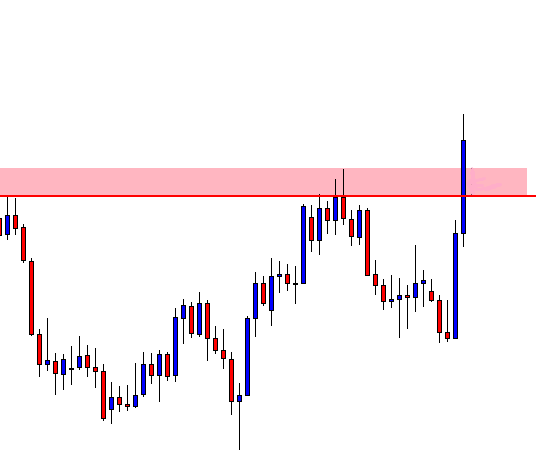
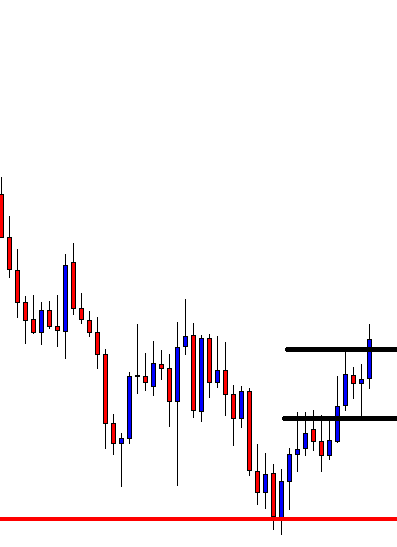
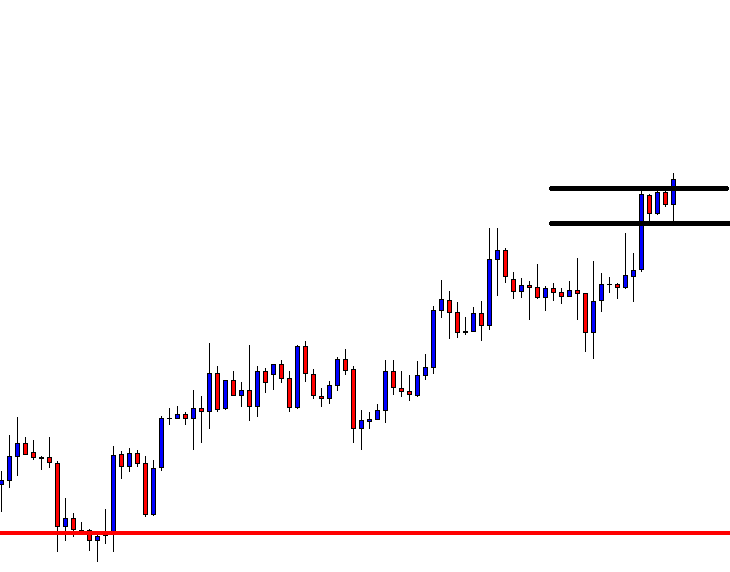
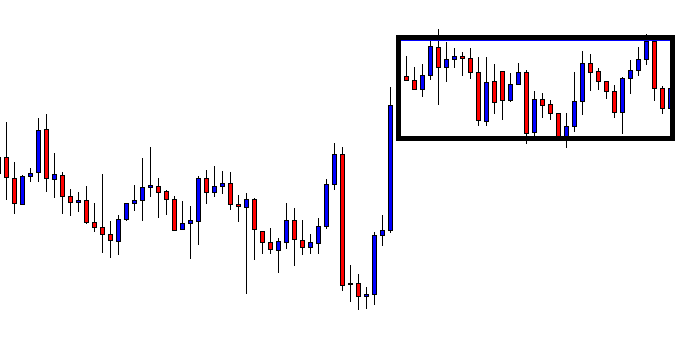
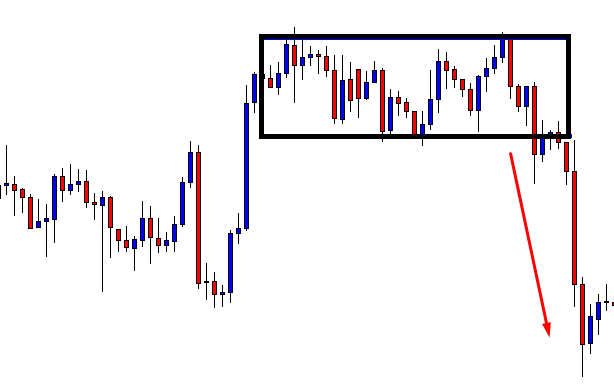
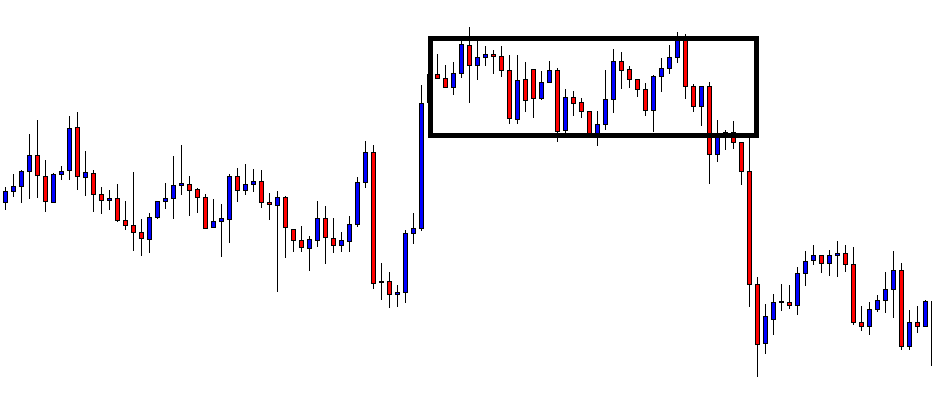
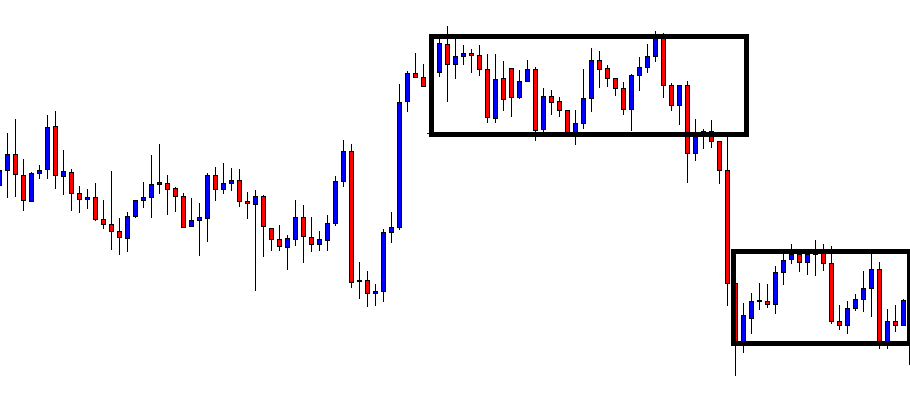
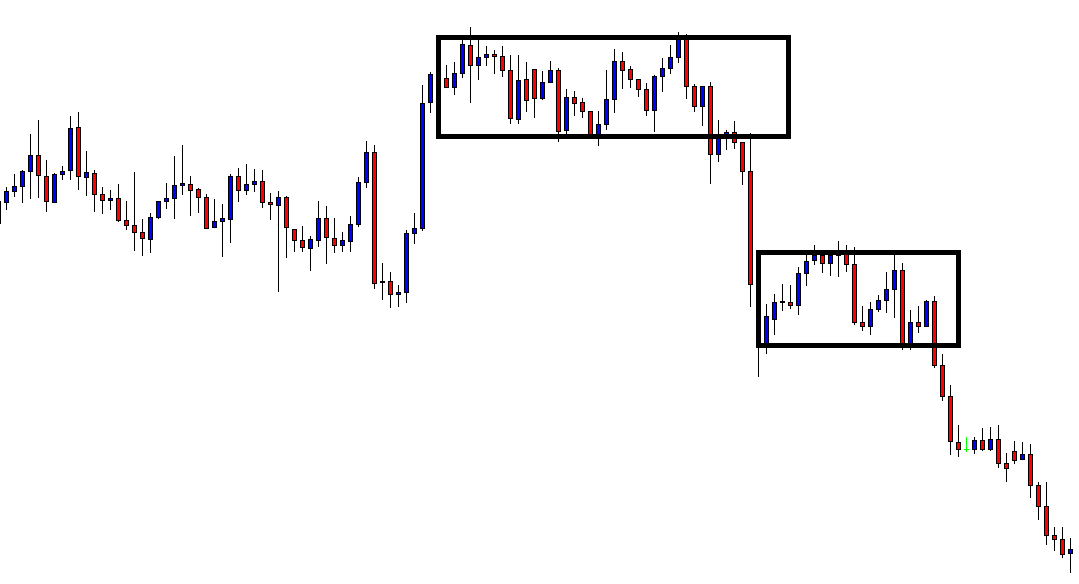
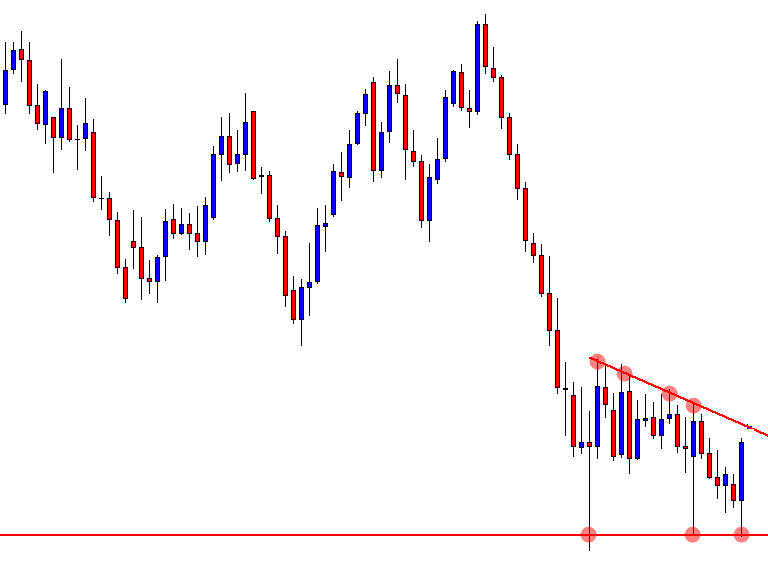
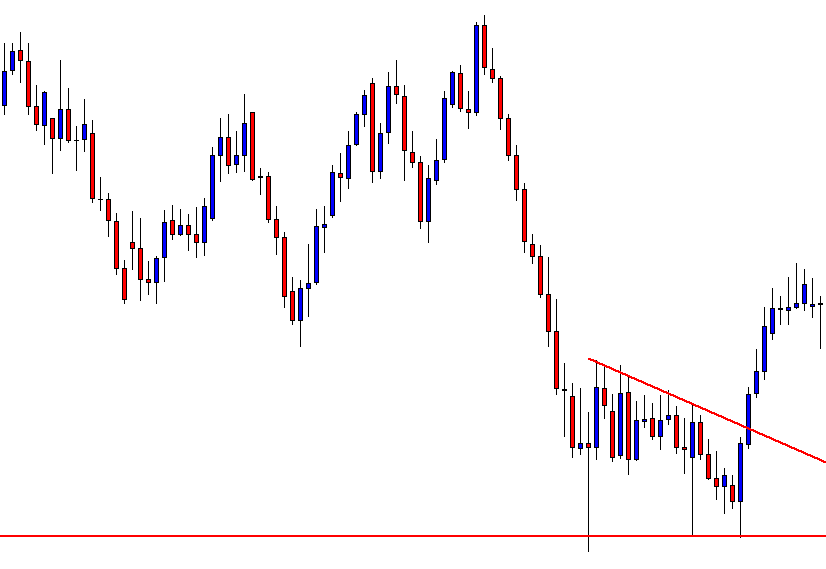
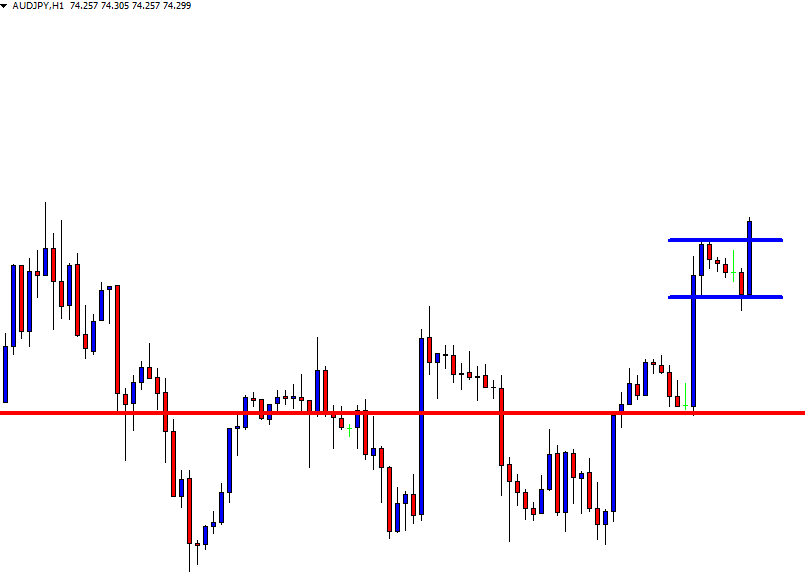
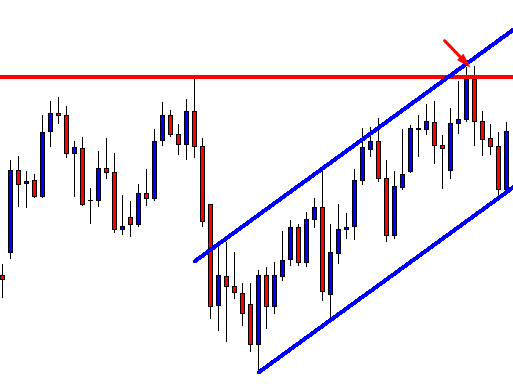
Now things become interesting because price action fades in a tight consolidation period and at position 1 does not reach the previous high of position H and collapses down to position I. Again, we have a shift lower to position J and where we again see price not able to pull back to that resistance line at position 2, and price again begins to fade down to position K which incidentally is a double bottom formation aligned with position I.
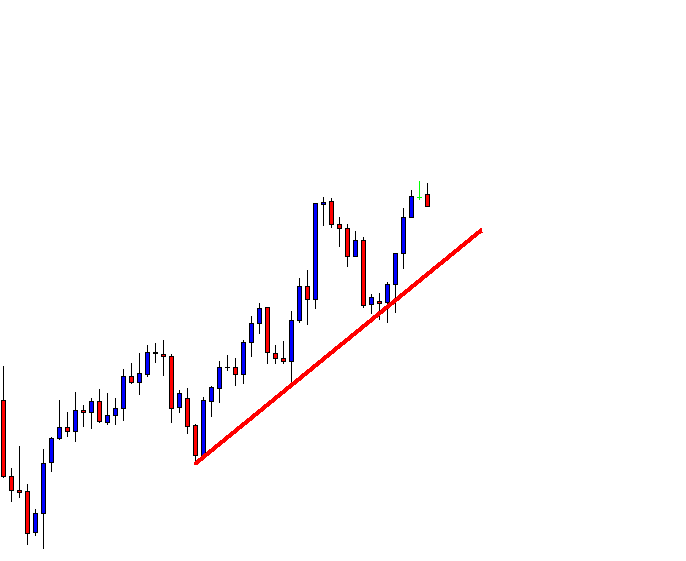
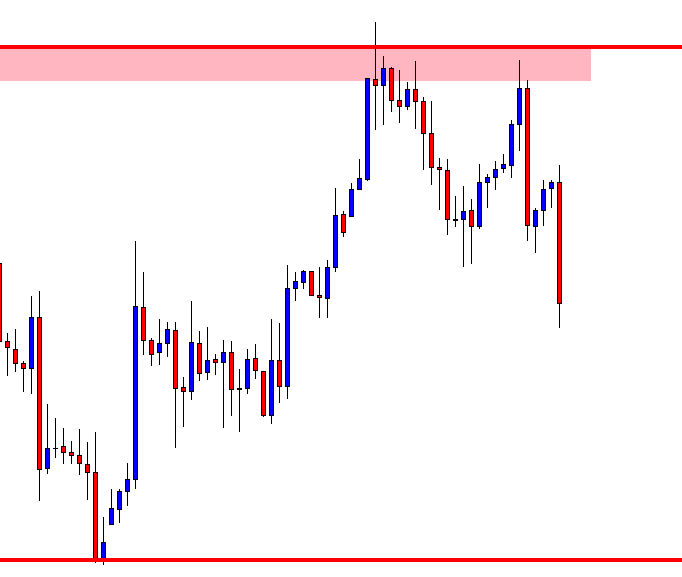
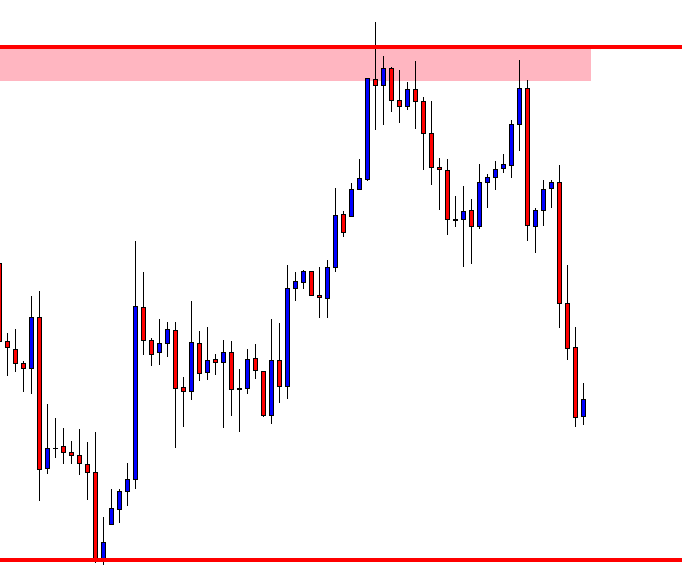
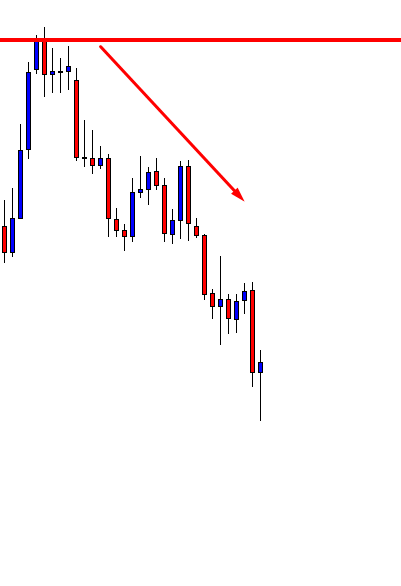
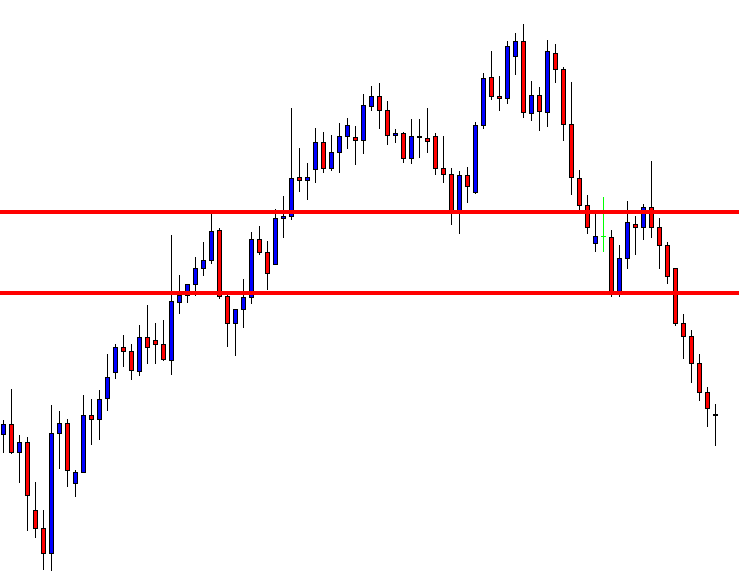
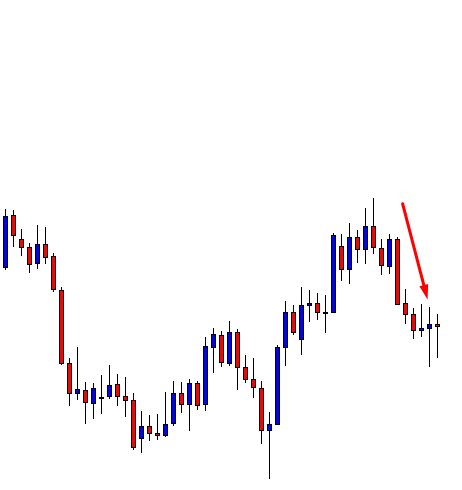
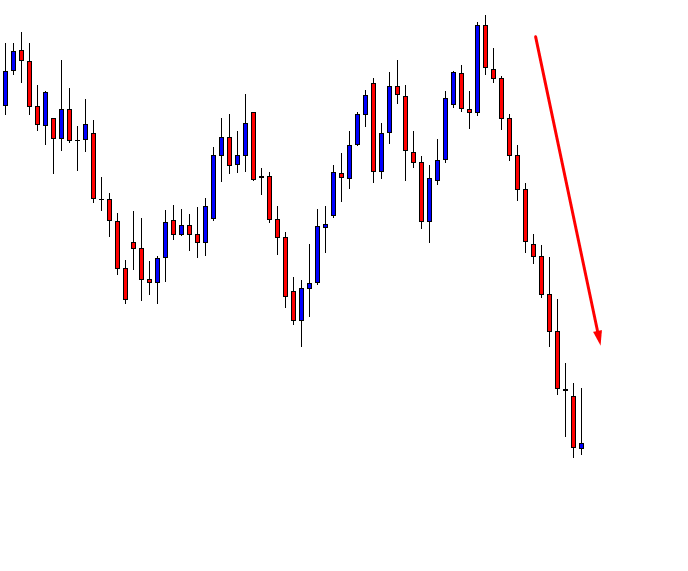
These fading areas of price action are unable to reach previous highs, as shown by positions 1 and 2 and very strong telltale signs that price action is about to move lower. Obviously, the opposite applies. But with the USDJPY pair, we are looking for reasons to go short due to the overall fading trend and the nature of the yen being bought in times of uncertainty.


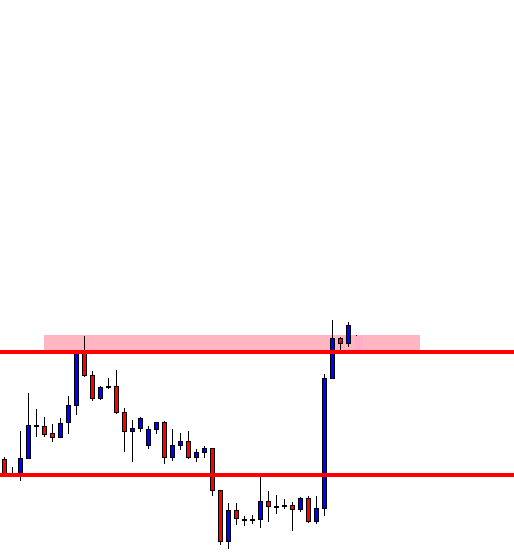
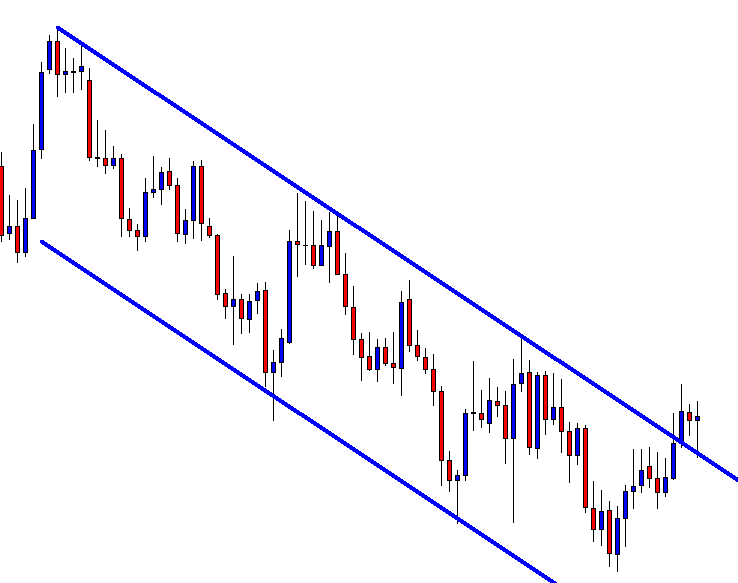
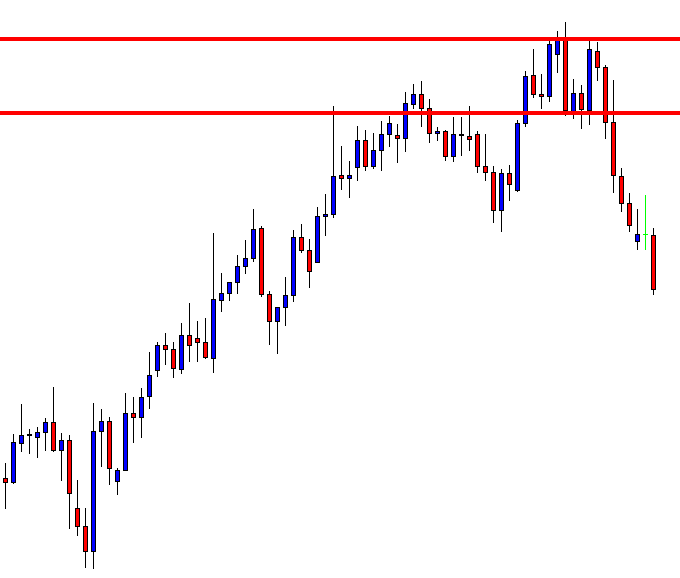
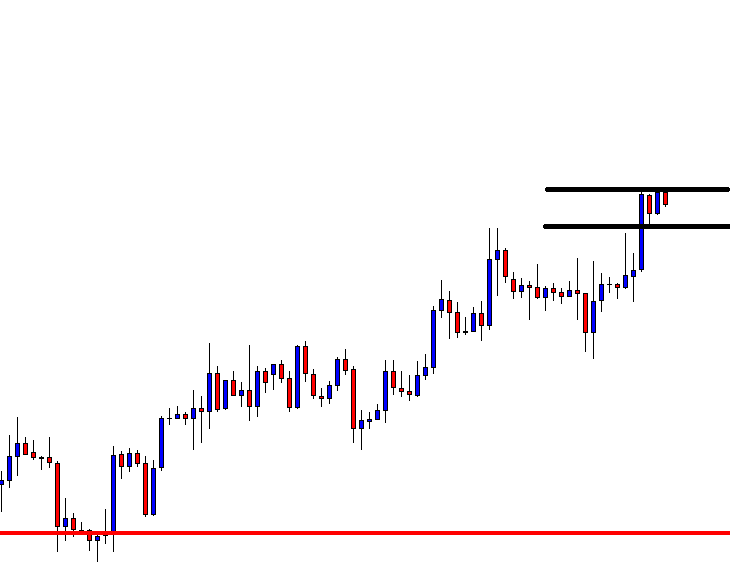
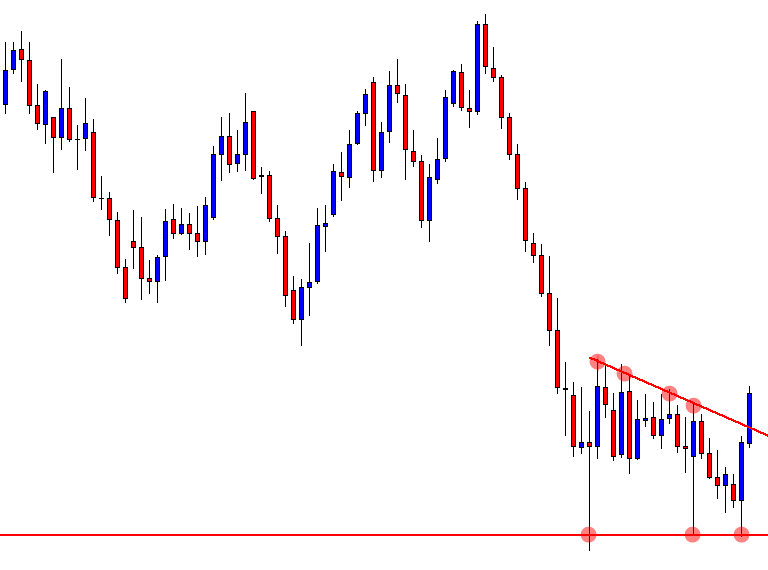
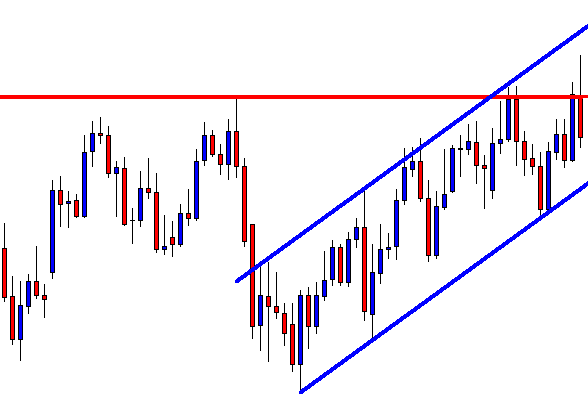
And with the market being extremely volatile right now and US elections only a few weeks, we can reasonably expect a continuation in the strength of the Japanese yen and, therefore, more movement to the downside in this pair.
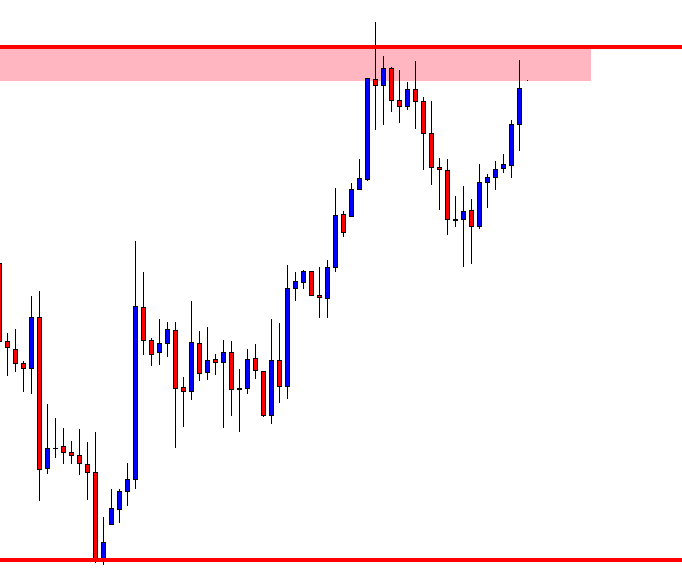
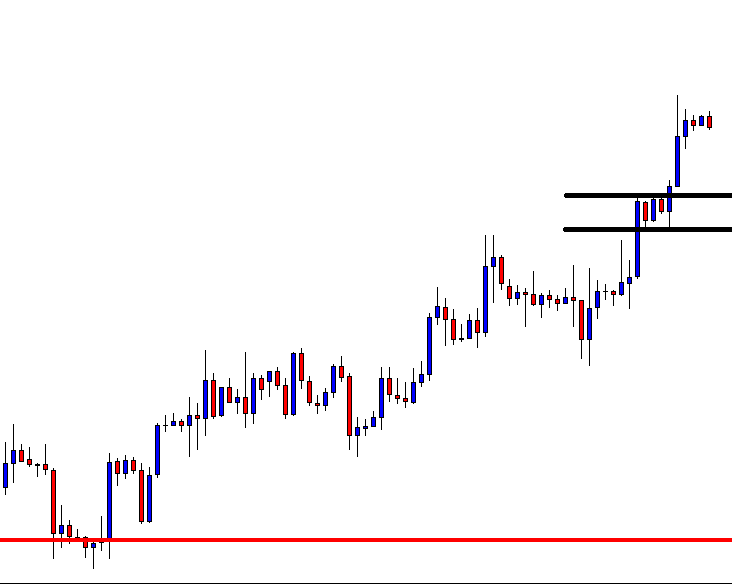
Add these simple trend lines of resistance and support to your own charts and look out for fading price action to these lines, such as described in positions 1 and 2.

Categories
Forex Market Analysis

WTI Crude Oil Prices Came Under Pressure Despite OPEC Agreed To Cut Production! 

The WTI crude oil prices dropped despite the report that OPEC minister agreed to cut the oil output by 1.5 million barrels per day. It’s worth to mention that the cut is finalized after approval from Russia. A meeting of both OPEC and OPEC+ members later in the day is in focus. 

Russia’s willingness for deeper production cuts is still doubtful because recent reports suggested that Moscow was supporting an increase to the current level of cuts rather than a further reduction. The news failed to boost oil prices today because falling U.S. equities places a further burden on oil markets. 

Despite some improvement in prices this week, the WTI is still below 24% on the year, and the coronavirus is playing a major role. The coronavirus cases continue to rise in the world’s largest economy. Some time ago, the U.S. Vice President Mike Pence accepted that they have a shortage of virus testing kits for now. Moreover, New York officials also recently crossed wires while saying that the coronavirus infects nearly 2,733 people in the city, which is also putting bearish pressure on the crude oil prices.

Daily Support and Resistance

  • S1 42.01
  • S2 41.76
  • S3 41.42

Pivot Point 43.51

  • R1 43.72
  • R2 44.26
  • R3 45.01

On the technical front, the crude oil price has broken below the double bottom support level of 43.95, which opens up further room for selling until 40.95. Recently, the MACD of crude oil has also forming bigger histograms on the 4-hour chart, which are supporting the selling trend in the WTI prices. Closing of candles below 43.96 may confirm the chances of more bearish bias in the WTI prices today. Let’s consider staying bearish below 43 to target 42.25 and 41.75. Good luck! 

Categories
Forex Price-Action Strategies

Do Not Ignore Significant Levels of Support/Resistance

Price action trading is considered one of the most effective and easiest ways of trading. Traders are to follow a few rules and be disciplined to be a successful price action trader. One of the most important factors is marking the support/resistance zone/level. If a trader draws support/resistance zone/level; accordingly, trade management gets easy for him. In today’s lesson, we are going to demonstrate an example of how important it is to mark support/resistance levels on our trading chart and manage trade accordingly.

This is a daily chart. The chart shows that the price after being very bullish produces two bullish candles consecutively. The first candle comes out as a bearish engulfing candle as well.  Thus, major intraday charts’ traders may flip over to their charts and look for short opportunities. However, before we proceed, we must mark significant levels that may work as a level of support. Think about the levels that you may mark as the level of potential support. If you are done, proceed to the next chart.

These two levels may work as a level of support. The line below is the most significant level on this chart because this is the lowest low, and this is where the trend starts. The line above is quite significant since it produces a double bottom earlier. There are levels where the price reacted earlier. Thus, they may work as flipped support. However, two marked levels are crucial as far as this chart is concerned.

The chart produces a bullish reversal candle right at the marked level. It has been extremely bearish. The second last candle comes out as a strong bearish candle as well. Price action traders usually keep their eyes on a chart like this to go short upon breakout. That does not happen here. It produces a bullish inside bar. The chart is still the sellers’ paradise. Nevertheless, it is a bullish reversal candle, and it may change the whole equation on this chart. To have a better idea, let us zoom out the same chart.

The chart now tells the whole story. Do you recognize these two marked levels now? The sellers shall plan about trade management before the price hits such levels. It is often seen the price makes a big anti-trend move after reaching such levels. The reason is many traders/ big traders set their take profit at such level. Once they get out of the market with their profit, the price goes another way around, causing an abrupt opposite move. This may make traders lose money and lose profit. Let us make sure we learn how and where to mark the support/resistance zone/level and manage our trade accordingly.

Categories
Forex Market Analysis

EUR/JPY Completes 50% Fibo Retracement – 61.8% Mark In Eyes!

The EUR/JPY is trading with a bearish bias at 120.950 areas in the wake of the U.S. Iran trade war. Iran immediately called a parliament to decide whether US troops should remain in Iran soil or not. The parliament voted the US troop withdrawal from Iran, which was criticized by the US.

The US President Trump said that they had invested billions of dollars in building an airbase in Iran, and they would not leave until Iran pay them back. US army denied the troop withdrawal from Iran.
Iran then announced that it would no longer follow the 2015 nuclear contract with the world powers. According to that provision, Iran was bound to follow the uranium enrichment limits mentioned under the 2015 Nuclear Agreement.

In response to what, US President tweeted that Iran would never become a Nuclear Power. He then said that the US military would attack 52 Iranian Historical values if they make US troops to leave Iran. This has increased the geopolitical tensions throughout the globe and has increased the uncertainty as to which extent these countries could go further.

On the other hand, the FOMC meeting minutes for the December meeting were released on Sunday, which showed that US Fed policymakers were in favor of further easing. However, Federal Reserve has already announced that no further rate cuts would be made in 2020, and the interest rates will remain unchanged throughout the year.


EUR/JPY – Daily Technical Levels

Support Resistance
121.16 121.35
121.06 121.44
120.87 121.64
Pivot Point 121.25

The EUR/JPY pair has already completed 38.2% Fibonacci retracement around 120.950, and it’s now likely to head towards 61.8% Fibo levels. Immediate support is expected to be found around 120.800 level, while the MACD and RSI support the bearish bias. The idea is to trade bearish below 121.005 to complete 61.8% Fibonacci retracement around 120.650 today.

Good luck!

Categories
Forex Chart Basics Forex Daily Topic

Caution! A Big Round Number Ahead

In today’s lesson, we are going to demonstrate an event to find out what the price may do around the big round number. A big round number plays a significant role as far as traders’ psychology is concerned. The price usually gets volatile around a big round number. It may get tough for the traders to find out entries around the big round number. Let us now dig into USDCHF recent activities around the big round number 1.00000.

The price is heading towards the North with good bullish momentum. Look at the last candle. This is one good bullish candle, which states that the buyers are dominating the pair. Do you notice anything unusual here?

Here it is. The candle breaches through the level of 1.00000. As a trader, you must not miss such a big round number. Now that the price makes a breakout, you are to wait for the breakout confirmation and a strong bullish reversal candle to go long on the pair. This might be one of the best trades in your trading life if things go accordingly.

The price comes back in. However, it still looks all right for the buyers since if we consider the spikes at the last swing high. A bullish engulfing candle closing above the last bearish candle would be the buying signal. On the other hand, if it keeps going towards the downside, the sellers may take over the baton.

The price does not produce any bullish momentum. For the last four H4 candles, it could go either way. Traders are to wait patiently since this is the game around a massive round number.

Here it comes. It has now become sellers’ territory. The candle forms right at the level of 1.00000. The level could have been a level of support. It is now a level of resistance. The sellers on the minor charts keep going short; on this chart, they are to wait for consolidation and downside breakout to ride on the next bearish wave.

It consolidates and produces a sell signal after four H4 candles. The last H4 candle suggests it may be time for the price to consolidate again. An explicit bullish breakout at the level of 1.00000, did not work for the buyers. It could happen at any level, but when we deal with a massive round number, we happen to see it more often.

The Bottom Line

The market runs on many aspects, and traders’ psychology is one of them. Many traders set their Stop Loss and Take Profit at round numbers. Thus, the price may get extra volatility around a big round number. We may get breakout even on the H4 chart, which may turn out to be a fake breakout. We must remember this every time we see a big round number.


Categories
Forex Basic Strategies

Is Drawing One Trendline Enough?

The Trendline is an excellent trading tool that the price action traders love using on their charts. Drawing trendline as accurate as it can get and adjustment with spikes are two factors that traders are to look after before using trendline. Another factor trendline traders often need to do is drawing multiple trendlines on the same chart. In this lesson, we are going to demonstrate an example of that.

The chart shows that the price after finding its support at the trendline heads towards the North and makes a new highest high. Thus, this is a valid trendline. Ideally, the buyers are to wait for the price to come back to the trendline again and to produce a bullish reversal candle to go long on the pair. Let us proceed to find out what happens next.

The price does not come at the trendline. It finds its support well above the trendline and heads towards the North again. This is annoying, is not it? Do not get annoyed. Concentrate on the chart. Do you see anything interesting? Have a look at the next chart.

We can draw another trendline on the same chart since the price has a bounce and makes a new highest high. Traders are to wait again for the price to come back at the trendline and to produce a bullish reversal candle to offer them a long entry.

Wow, this time, the price comes at the trendline and produces a bullish reversal candle. Traders have been waiting for such price action. By flipping over to the next chart and an upside breakout, traders may grab some green pips.

The chart shows that the price comes back near the trendline’s support again, then heads towards the North. It consolidates hard on the minor charts, as it seems. The point here is that the price does not come at the first drawn trendline or produces a bullish reversal candle. It comes at the second drawn line, and this time, it creates the bullish reversal candle right at the trendline’s support. It heads towards the North and may have offered entry as well.

The Bottom Line

In most cases, the price does not come at the first drawn trendline. It has the tendency to come at the second drawn trendline more. It is often seen that the price obeys the third drawn trendline as well. Thus, if we are to trade on the trendline, we may keep an eye on the chart to draw a trendline as many times as we need to.

Categories
Forex Chart Basics

An Inverted Hammer at a Double Bottom

The Double Bottom is a pattern, where the buyers eagerly wait to get a bullish reversal candle at. Typically, a Bullish Engulfing Candle, a Bullish Pin Bar,  a Bullish Truck Rail are considered the strongest bullish reversal candle pattern. Usually, a Bullish Inside Bar and an Inverted Hammer are the weakest reversal pattern. In today’s lesson, we demonstrate an example of how a Daily Inverted Hammer candle offers a long entry.

This is the daily chart. It shows that the price has been roaming around within two horizontal levels. It is at the support and produces an Inverted Hammer. An Inverted Hammer is a bullish reversal candle but not a very strong one. Look at the upper shadow. It suggests that the price has a strong rejection at a level of resistance.

To some extent, it signifies intraday buyers’ less confidence. However, it is the daily chart, and the bullish reversal candle forms right at a double bottom’s support. Thus, let us flip over to the H4 chart to find out whether it offers us an entry.

The H4 chart shows that the price is on consolidation. The last candle looks ominous for the buyers. Nevertheless, traders on this chart combination are to look for long opportunities as long as the support holds the price. Let us go to the next chart to find out what happens.

The price finds its support and produces two consecutive bullish candles. One of them breaches the resistance and closes well above the resistance. A long entry may be triggered here by setting the Stop Loss below the consolidation support.

The price heads towards the North with good bullish momentum after triggering the breakout. The last candle on this chart comes out as a bearish candle with some gap. The buyers may consider closing the entry and come out with the total profit. On the other hand, some traders may want to take partial profit and ride on the wave up to the resistance. Have a look at the chart below.

The price may go up to the marked resistance level since this is the last swing high. If we consider the risk-reward, it is an amazing trade. The reward is about five times the risk. Do you remember how it started, though? It began with a Daily Inverted Hammer Candle (relatively weaker bullish reversal) at a Double Bottom’s support. Yes, this is what support of Double Bottom can do.

Categories
Forex Basic Strategies Forex Daily Topic

A Story of an Early Exit

Risk-Reward is a factor, which every successful trader takes care of. Before choosing a chart to take an entry, the first thing that is to be considered is the trend, then the risk-reward factor. Once we have set our Take Profit and Stop Loss level, we shall leave the entry either to hit the Stop Loss or the Profit Target. However, today, we are going to demonstrate an example of an early exit.

This is an H4 chart. The chart shows that the price has found its support as well as a resistance zone. After having a final rejection, it makes a move towards the downside. Then, it heads towards the North now (see the next image). Another rejection and bearish reversal candle at the resistance zone may produce a short entry.

The last H4 candle is bullish. However, the candle closes within the resistance zone. It may go either way. The buyers may get an upside breakout; the sellers may get a bearish reversal. Let us proceed to find out what happens next.

In the above chart, we can see one good-looking bearish Marubozu candle. The candle suggests that the sellers may wait for consolidation and downside breakout to take a short entry. The candle forms at a Double Top resistance as well. The price may consolidate around the neckline level.

As expected, the price starts having correction around the neckline level. It needs to find its resistance and produce an H4 bearish reversal candle along with a breakout at the neckline.

Here it comes. The last candle engulfs all the candles by closing below the neckline. An entry may be triggered right after the candle closes. The price has enough space to travel down to the red-marked line, which allows an excellent risk-reward. However, there is a support level in between, that may hold the price for a while.

The price heads towards that level with good bearish momentum. The way it has been going, it may hit the red-marked level within four/five H4 candles. This means one more trading day may be required to hit the original Take-Profit level.

The in-between level is a vital level, which produces the H4 bullish reversal candle. The price has reacted several times at that level earlier. Usually, we must stick with our original Profit-taking target. However, it is also legit to close our entry right after the last candle closes. A question may be raised “why do we close our entry here?”

Reasons for Early Exit

There are two reasons

  1. The support level is significantly strong
  2. The current bar is the last H4 Friday’s candle, which means the market closes once the candle is finished.

The Bottom Line

When using the Weekly and the Daily charts, traders are to let their opened positions to reach the target during the weekend. However, intraday traders should consider closing their floating trade before the week’s end. Mondays often start with a big gap, which may hurt intraday Stop Losses.


Categories
Forex Basics Forex Daily Topic

Attributes of the Signal Candle Not to be Ignored

After choosing a pair to trade, traders wait for the signal candle at the desired zone/level to take an entry. The attributes of the signal candle are important. Ideally, a signal candle is to be a Marubozu candle, barely having an upper or lower shadow, and longer than other candles around. In today’s lesson, we are going to show an example of how attributes of a signal candle affect the market. Let us proceed.

The price after being bearish finds its support. A long consolidation suggests that a breakout towards either side makes the chart lively again. An upside breakout and the confirmation offer good risk-reward considering the last swing high. A downside breakout seems even more rewarding. Let us find out which way the breakout takes place.

It is an upside breakout. The breakout candle looks fantastic. Buyers are to wait for consolidation and breakout at the highest high to go long on the pair. However, buyers shall calculate that the last swing high is not too far away now.

The price continues its bullish journey towards the last swing high, and it consolidates. Flipped support is to be adjusted here considering the Inside bar. However, an upper shadow at the previous swing high holds the price as well up to the Inside bar. The last candle comes out from the zone, though. Look at its attributes

  • It is a bullish engulfing candle
  • It breaches the resistance zone
  • It is a Bullish Marubozu candle

Many of us may trigger an entry here by setting Stop Loss below the lowest low of the candle. Let us find out what happens next.

The price comes down again. It may have swept away many Stop Losses. Thus, the last entry gets the buyers loss. What do you think about the last candle?

  • It is a bullish engulfing candle
  • It breaches the resistance zone
  • It is a Bullish Marubozu candle and
  • It breaches the last swing high


Traders may want to trigger an entry here. Let us go to the next chart to see how it goes.

This time it works excellently well. A question may arise here: what the difference is between these two candles?. The only difference that can be observed is, “It breaches the last swing high.”

The Bottom Line

We have demonstrated an example today and learned a lesson. Traders are to be immaculate in making a decision, and they have to calculate every single aspect that is related to the trading decision.


Categories
Forex Basic Strategies

Even a Choppy Price Action Offers Entries

The market moves in three ways upward, downward, and sideways. In today’s lesson, we are going to demonstrate an example of a Rectangle breakout and an entry from a choppy price action. Let us have a look at the chart below.

The price action is choppy in this chart. Typically, traders avoid this kind of price movement. However, if we want to take trading as a full-time business, we are to widen our eyes. An entry can be found even in this market. Concentrate on the rectangle drawn here. After all these bounces, rejections the price finds its support and resistance within the rectangle.

The chart produces a bearish engulfing candle right at the resistance of the rectangle. This is a sign that something may happen. Let us assume a bearish move may occur. The first candle of the bearish trend looks good. A downside breakout with good momentum is the second thing that the sellers may wait to get.

The next candle comes out as a bearish candle followed by an Inside Bar. Things are getting better for the sellers. A bearish engulfing candle closing below the support would be the signal to go short for the sellers.

Here it is. The breakout candle is a bearish Marubozu candle. We may trigger a short entry right after the candle closes. Let us find out where we will set our Stop Loss.

Many traders may suggest setting the Stop Loss above the resistance of the rectangle and setting the Take Profit with the same distance. This is a good idea. However, we may set our stop-loss just above the resistance of the last consolidation. The reason is the price consolidates before making the breakout at the support. If the price made a breakout without the consolidation, we would have set our Stop Loss differently. By setting Stop Loss above the last consolidation’s resistance, we are to keep an eye with our Take Profit level.

We may set our Take Profit all the way down at the last swing low. The price may have kept going towards the major support. Look at the chart above. What do you think? The price is still very bearish but it produces a bullish reversal. That is too with a gap. The price action traders do not like price gaps. Considering the fact that we have set our Stop Loss as close as it can get, thus it may be the time to close our trade and come out with the profit.

The Bottom Line

Even a choppy market ends up producing an excellent trading signal. Our first choice shall be trending markets to look for entries. However, if we can spot out some entries from the choppy market, it would surely make us be more profitable.

Categories
Forex Price-Action Strategies

Trading is the Hardest Way to Make the Easiest Money

Financial traders need to be very alert and patient to deal with the market. These two components are vital for a trader to be successful in trading. In today’s lesson, we are going to demonstrate an example of alertness and patience. Let us get started.

The price heads towards the South. Ideally, a trader shall look for short opportunities in a chart like this. The last candle comes out as a bullish reversal candle. It is time for consolidation and waiting to get a downside breakout to take a short entry.

The price seems to go too far. It consolidates and produces a bearish engulfing candle. We may flip over to the H4 chart to find an entry since this is a daily chart. The support level looks strong since it created a long bullish move. The price may play around the level for a while.

As expected, the price stalls at the level of support. Things are different now. A downside breakout would make the pair bearish. A bullish reversal candle would make the traders look for long opportunities. This is where traders must be alert and never be rigid with their initial thought.

A bullish reversal candle forms right at the level of support. Traders may want to flip over to the H4 chart to look for long opportunities. We are not flipping over to the H4 chart this time since I know what happens afterward. Our trading lesson today is going to emphasizes something else.

The price heads towards the South instead. The H4 chart does not offer any entry after that daily bullish engulfing candle. Now, the price action is choppy. It seems that it is a chart to avoid for a while.

Not really, be alert. The price obeys a down-trending channel. Thus, any rejection at the upper band may create short opportunities. The price heads towards the resistance. Let us wait for a bearish reversal candle at the upper band (resistance of the channel).

The price makes a breakout at the upper band instead. It consolidates and produces a Spinning Top. Again, we are to change our trading direction. This time we are to go long.

The last candle breaches the horizontal resistance after consolidation. A long entry may be triggered right after the candle closes. Let us proceed to find out what happens next.

Two consecutive bullish candles form right after the breakout candle. Formation of a bearish reversal candle signals that it may be time to come out with a profit. At last, we make some green pips by going long.

The Bottom Line

This is an example of why we must not be rigid with our direction and how important it is to be alert with price patterns. Trading is never easy. As they say, “Trading is the hardest way to make the easiest money”. If we work hard in learning, only then we will be able to make money easily.

Categories
Forex Basic Strategies

A Twist in the Tale

The Forex market can be very unpredictable. It is a game of probability. With more experience and knowledge, a trader increases the chance to be right in making a trading decision. Having immaculate risk management is another aspect that keeps a trader safe with his investment. In today’s lesson, we are going to talk about the unpredictability of the market.

Let us start with a daily chart of a Forex pair.

The price makes a bullish move and finds its resistance. After four daily candles, the daily chart produces a bullish engulfing daily candle. This is a powerful bullish reversal candle, which forms right at a flipped support. Have a look at the chart below.

The chart above shows that the bullish engulfing candle forms at the flipped support. This means buyers on this chart are to go long on a chart pattern called ‘ABC’ or ‘123’. This is a lucrative and consistent chart pattern, which price action traders love to trade. Let us find out what happens next.

The price stalls and has a rejection at the same level. The buyers would love to get a breakout here to go long and grab some green pips. However, the chart produces a bearish engulfing candle instead. What do you think a trader should do here?

He shall start looking for short opportunities. This is the daily chart. Thus, he shall flip over to the H4 chart to find out a short opportunity.

This is how the H4 chart looks. A very strong bearish candle followed by a little Inside Bar. The trader (the seller) is to wait for consolidation and a bearish reversal candle to go short.

The price consolidates more. It produces a good-looking bullish candle. Let us find out how the next candle comes out. Do not forget that the sellers are waiting to get a bearish reversal candle breaching the lowest low.

This is it. A bearish engulfing candle closes below the level of support. The sellers have been waiting to get a signal candle like this. A short entry may be triggered right after the last candle closes. Let us find out what happens next.

As expected, the price heads towards the South with good bearish momentum. We see the first H4 bullish reversal candle forming at the daily support as well. This may be time to take out the profit.

The Bottom Line

Do you notice how things change within a candle? Before that bearish engulfing daily candle, the pair looks extremely good for the buyers. An upside breakout would make them go long on the pair and push the price towards the North. However, that does not happen, but the price comes down instead. This is what I call “Twist in the tale.” Forex traders often get these twists.

Categories
Forex Price-Action Strategies

A Breakout and the Confirmation

Support and Resistance, also known as Supply and Demand, have long been used in the financial markets. The most characteristic feature of support/resistance is a level of support becomes resistance, and a level of resistance becomes support. The price after making a breakout comes back to the level and makes a move towards the established trend. The price does not always confirm all the breakout levels, though. Traders do not know which broken level is going to produce a trading signal. In reality, they do not even have to know or guess. They have to make decisions according to the price movement or Price Action. Let us have a demonstration of this.

The price is up trending. Traders shall look for long opportunities. To be honest, the last candle on the chart is a buy signal. It was a week ending candle, which must have held the buyers back. Let us wait for a while to get more clues.

The last candle came out as a bearish engulfing candle. Such price action usually makes a pair choppy. The buyers may want to wait for an upside breakout to go long. However, a bearish engulfing candle may not let that happen.

A strong bullish candle closes within the resistance. It seems that the chart may produce a Double Top. Thus, the bear may come and dominate. Let us draw the Neck Line and resistance of the Double Top.

The equation is very simple here. A breakout at the neckline attracts the sellers, which is more likely. On the other hand, an upside breakout attracts buyers. Let us find out which way the price heads to.

The price makes a breakout at the Neckline. However, it does not consolidate around the Neckline after the breakout. Unfortunately, the sellers do not get an opportunity to go short here. It often happens with the traders. Traders’ life is never easy!

Here is a question. Do you see anything interesting? Has the price made another breakout?

It has made a breakout at the red-marked level. It goes back to the level to confirm the breakout, as well. Moreover, it has produced a bearish engulfing candle with a long upper shadow. Things look good for the sellers. A breakout at the lowest low would be the signal to go short.

Here comes the breakout. A bearish Marubozu candle breached the lowest low. The sellers may want to trigger a short entry right after the last candle closes. Let us find out how far down it goes before producing any bullish reversal candle.

Here comes the breakout. A bearish Marubozu candle breached the lowest low. The sellers may want to trigger a short entry right after the last candle closes. Let us find out how far down it goes before producing any bullish reversal candle.

The price heads toward the downside with good bearish momentum. It produces a Doji Candle. It may be time to come out with a profit.

The Bottom Line

The price does not confirm all the breakouts. That does not mean we should start pulling our hair. Concentrate hard and calculate well. The next opportunity is just around the corner.

Categories
Forex Basics

Do not be Biased with Your Anticipation

Financial markets keep going up and down. Traders make money out of those moves. To take an entry, a trader is to do a lot of calculations, such as detecting a trend, waiting for the price to go to the right zone, market psychology, and signal candle, etc.

In trading, we often find ourselves in a situation in which we were waiting for a long entry from a support zone, all of a sudden the price makes a breakout at the support and heads towards the South instead. We feel deprived. However, this should not be like this. In trading, we are to get ready to sell and to buy since the market can go anywhere. We are to stick with the rules to take an entry.

Let us demonstrate an example.

The price heads towards the North with good buying pressure. It seems that the price finds its resistance as well. The buyers are to wait for a bullish reversal candle and a breakout at the resistance to go long again on the pair.

The price keeps being bearish. It seems that the price is going to have a long correction instead of consolidation. The price is at a flipped support. This is where a battle is going to take place between the bull and the bear. Traders are to wait for a downside breakout to sell the pair. On the other hand, a bullish reversal candle is going to attract them to keep an eye for an upside breakout and buy the pair.

The bull wins here. An engulfing bullish candle right at the flipped support means traders shall wait for an upside breakout to buy the pair. The momentum looks good. If the breakout takes place within the next candle, it will be an excellent buy signal. If it takes two candles to make the breakout, that will be a good buy signal as well. Let us proceed to find out what happens next.

The bull has lost the momentum. Traders are to wait for an upside breakout to go long. A good-looking bullish engulfing candle at the support area shall attract the buyers on the minor time frames to push the price towards the upside. That would eventually help the price make an upside breakout on this chart. Let us wait and find what happens next.

What do you see here? A bearish engulfing candle is right at the resistance level. This is a Double Top resistance level as well. If you have been waiting to go long, please change your mind. Get ready to look for short opportunities. This is how the market changes its complexion. You know what you have to do to deal with it. Yes, you must not be biased with your anticipation/calculation — Trade what you see, not what you think.


Categories
Forex Chart Basics

Why Mark Support/Resistance Zone Along with Line?

Most traders use a horizontal line on their trading chart to mark support/resistance levels. Support and Resistance lines are the most basic trading tools, which traders use to make a trading decision. However, traders often find that the price does not react right at the drawn level.  It is because of candles’ wicks and candles’ bodies. We may see that sometimes the price reacts at the level where the candles’ bodies are, and sometimes the price reacts where the wicks are. Thus, it is a good practice that we mark the support/resistance zone instead of marking the level only.

Let us demonstrate an example of that.

The price is being bullish after producing a Pin Bar. We know that a bullish Pin Bar has a long lower shadow. This means it reacts from a zone not only from a particular horizontal line.

The price is on the correction. Look at those Spinning Tops with long upper and lower wicks. Do you notice that one of the flipped support holds the bodies of the candles? However, those shadows often play an essential role, especially when the price is to confirm a breakout. We will reveal that soon.

The flipped support does not hold the price at last. The price comes towards the South further to find its support. The last bullish candle suggests it finds one strong support for sure. Do you notice that this is where the price has bounced earlier and produced spikes?

This time we have marked out the resistance zone. A bullish candle breaches the zone. The buyers need to wait for consolidation. The question is which level to hold the price as the level of support. Is it the level where the wicks are or where the bodies close or both?

Both levels hold the price as support. On this chart, the level, which is drawn on the wicks, holds the price as the support. On its smaller time frames, the level that is drawn on candles’ bodies holds the price as support. If we draw just one level here, we may get confused. Thus, we must mark out the support/resistance zone. Since the buyers are waiting for a bullish reversal candle to go long, it may be produced where the price is now. The price may as well come down at the lower level of the support zone and create a buy signal. Both are valid signals. Let us find out where the signal is produced.

The buyers may want to trigger a long entry right after the last candle closes. Assume only the red line was drawn here. Some buyers would have been confused that the signal did not come from the right level. Thus, drawing the support/resistance zone comes out handy for the traders. Support/Resistance zone helps traders take a better trading decision.

Categories
Forex Price-Action Strategies

Using Multiple Time Frames to Get Multiple Entries

We know using multiple time frames is an essential aspect of trading. Traders use the bigger time frame to find out the trend, breakout, vital support/resistance levels, and relatively smaller time frames to trigger an entry. In this lesson, we are going to learn how the trigger chart can be used as the analyzing chart to find out more entries.

This is a Daily chart, which is being used as the trigger chart. The weekly chart is used as the analyzing chart. It is a combination of Weekly-Daily. The price heads towards the North. Traders are to wait for the price to produce a bullish reversal candle.

A Spinning Top daily candle at a flipped support, the buyers have a lot to be optimistic here. One of the daily candles is to breach the daily resistance to go long on the pair. Let us draw the support and resistance on the chart to get a clearer picture.

This is how the chart looks like with support and resistance levels. If one of the daily candles breaches the resistance with good buying momentum, the daily traders are to trigger a long entry.

The next daily candle breaches the resistance. The buyer may take a long entry right after the breakout candle closes. An entry on the daily chart means that the trader shall leave the trade/chart for three to four trading days by setting Stop Loss and Take Profit.

However, if a trader uses the same daily chart as the trend-detecting chart and flips over to the H4 chart to find another entry, it surely would be more rewarding.

Let us flip over to the H4 chart.

Previously, the daily chart shows an upside breakout. Thus, the trend is bullish. The H4 chart shows that the price starts having consolidation. If the breakout level holds the H4 candles and makes an upside breakout, the H4 buyers are going to go long on the pair as well.

This is the H4 chart with the support and resistance of consolidation. The buyers must wait for an upside H4 breakout to go long on the pair. Let us proceed to the next chart.

Here it comes. An H4 bullish engulfing candle breaches the resistance. The H4 traders may want to trigger a long entry right after the candle closes.

The H4 chart shows the price may have consolidation again. The H4 buyers may want to cash in their profit. However, the entry, which is taken on the daily chart, traders are still to hold their positions until they get a bearish daily reversal candle.

At the end of the day, price action trading works very similarly on the Weekly, Daily, H4, and H1 chart. Today’s examples show that a Weekly-Daily combination offers an entry. After the daily breakout, the Daily-H4 combination offers an entry, as well. With a lot of practice, dedication, and hard work, a trader can trade both of them. This will surely beget more profit.

Categories
Forex Price-Action Strategies

What Is Rectangle and How to Trade on It

The price after making a strong bullish or bearish move, it makes correction/ consolidation. The price consolidates within two horizontal lines. In the financial market, this is called Rectangle. In today’s lesson, we are going to demonstrate some examples of the bullish and bearish rectangle.

Let us start with a bullish rectangle.

The price heads towards the upside with good bullish momentum. At the top, the price seems to start having consolidation. A buyer may want to keep an eye for an upside breakout to go long from here. However, the price continues to consolidate.

The price consolidates within two horizontal lines. We can draw a rectangle here since the price produces the rectangle after a bullish move, so it is called ‘Bullish Rectangle.’ Traders are to wait for a breakout to take an entry. A downside breakout offers a short entry, and an upside breakout offers a long entry. Let us find out which way the next breakout takes place and the price heads to.

The price makes a downside breakout and heads towards the South. At rectangle breakout, the price usually travels at least the same distance of the consolidation length. It seems the price travels 1.5X distance of the consolidation length here. Let us concentrate on the next chart below.

The price consolidates getting trapped within horizontal support and resistance. Do you find anything interesting here? Yes, we find another rectangle. This time it is a bearish rectangle. Let us draw those two lines here.

Again, traders must wait for a breakout to find out its next direction. The price has several bounces and rejections within those two horizontal lines. It is a bearish rectangle, but we know a breakout can take place either way. There is no point in guessing. Let us wait and find out.

The price makes a downside breakout and heads toward the South with good enough selling momentum.

We have demonstrated two examples here. The first one is a bullish rectangle where the price makes a downside breakout. The second one is a bearish rectangle, on which the price makes a downside breakout as well. Breakout direction does not depend on the bullish or bearish rectangle. Trader’s job is to wait for the breakout and breakout confirmation. Entry is to be taken only when the breakout is confirmed. We can spot rectangles almost in all the time frames. However, it is often seen on the H1, H4, and Daily charts. Have some practice on the demo account or do some backtesting to get well acquainted with the pattern to make green pips.

Categories
Forex Price Action

Price Action, Market Psychology, and Adjustment

Price action traders are to get clues from what the price has been doing. Horizontal Support/ Resistance, Trend Line Support/Resistance, Fibonacci Levels, Equidistant Channel along with Candlestick Pattern are price action trader’s main weapons. A trader must know how to use these tools as far as price action trading is concerned. Moreover, traders often need to adjust to marking levels, which are to be integrated with price action and market psychology. In today’s lesson, we are going to show an example of that.

The price has been heading towards the downside with strong bearish momentum. Ideally, traders are to look for short opportunities at upside pullback. See the first reversal candle. The candle closes within the support of the last bearish candle. Thus, the traders must wait to go short since the support holds the price. Let us see what happens next.

At the last candle, the price goes towards the downside but comes back within the support again. Equations are different now. Long lower shadow and proven support suggest that the traders may have to wait longer than they thought.

As expected, the price consolidates on choppy price action, which makes traders wait. Traders find horizontal support. Let us draw it.

The price obeys the support level several times. However, do not forget that the price had a strong rejection. This is where traders may need to make an adjustment.


The price has been heading towards the adjusted support. Risk-Reward does not look right here. It is better to wait for either a downside breakout or a bullish reversal to go long. Let us see what happens next.


We have a bullish reversal here. A bullish engulfing candle right at the support level suggests that the traders may have to look for long opportunities here. The question is, shall we take an entry right after the last candle closes or not. The answer is ‘No”. We have to wait for an upside breakout. Can you guess where the breakout level is? Think for a minute, and then proceed to the chart below.

The price has been obeying a down-trending Trend line producing a Descending Triangle. Thus, the breakout at the Trend line resistance is a signal to go long here. All the buyers need here a breakout by a bullish Marubozu candle.

Here comes the breakout that the price action traders shall wait for. The buyers may trigger a long entry right after the breakout candle closes. Stop Loss is to be set below the horizontal support. Let us find out how it proceeds.

The price heads towards the North and provides 1:1 Risk-Reward. So far here, it seems that it is having consolidation. Some traders may want to come out with their profit. Some may shift their Stop Loss at the breakeven and take some profit out targeting to go all the way towards the swing high. This depends on how a trader wants to manage his trade. With these above charts and examples, we have realized the importance of adjustment in marking support/resistance.


Categories
Forex Market Analysis

Gold’s Bullish Breakout Setup Activated – Get Ready to Buy! 

On Thursday, the precious metal gold prices trade bullish as investors await clarity on Brexit following the European Union delayed a verdict on allowing Britain an extension. Considering the safe-haven demand in gold, the U.S. dollar has dropped from the 99.5 level to 97.2 continuously for the last two weeks.

It’s been months now, the financial markets are volatile and trading the risk-off sentiment in the wake of geopolitical risks such as the U.S.-China trade war, Brexit, Hong Kong rallies and stresses in the Middle East.

As you know, traders divert their investments from the U.S. dollar, stock markets, and other financial instruments to the safe-haven asset gold during the time of uncertainty. That’s precisely what happening right now. Traders seem to move investments into the gold.

Moreover, the weaker dollar is also keeping the precious metal gold supported due to its negative correlation with gold. Let’s take a look at the technical side of the market.


XAU/USD – Technical Levels

Support Resistance 

1488         1496.18

1484.02    1500.37

1475.85    1508.55

Key Trading Level: 1492.2

On the technical side, gold has violated the ascending triangle pattern, which was keeping gold in check below 1,496. Since this level is violated, we may see gold prices going towards 1,504 and 1,507 area. Therefore, consider keeping buying above 1,497. All the best! 

Categories
Forex Price-Action Strategies

Breakout by a Single Candle Generate More Impetus

Breakout is one of the most important factors in trading. Attributes of a breakout give clues with what traders can manage their opened position to make more profit. Price action traders, in particular, love to compute the attributes of a breakout to determine their take profit level.

In this section, we are going to demonstrate an example of a single candle breakout and its impact afterwards. Have a look at the chart below.

The price finds support at the red market level and heads towards the North. The price action suggests that the buyers are going to control the pair. A downward correction/consolidation followed by a bullish reversal candle at a value zone is what they need to wait for. Let us find out what happens next.

The price seems to have started having a pullback. The first corrective candle comes out as an Inside Bar, which is a good sign for the buyers. The buyers wait for the price to come back at a level of support with a reasonable distance from the resistance. Let us see how far it comes up to.

The price has crossed a good distance from resistance. The buyers are to wait for a bullish reversal candle. Ideally, a bullish engulfing candle is the first choice for the buyers. Other candles such as Inside bar, Spinning Top do the job as well, but an engulfing candle’s signal attracts more traders, and it brings more liquidity. Let us see what happens next.

Price action traders dream of such a reversal candle. This is not only a bullish engulfing candle but also an engulfing candle, which breaches the highest high of the last wave. Let us draw the consolidation zone on the chart.

The reversal candle makes the breakout with good momentum. A trader shall trigger a buy entry shall right after the candle closes. When a reversal candle itself makes a breakout, it makes the fore coming move go towards the trend’s direction with good momentum. Look at the chart below.

Look at the pace of the bullish move after the breakout. Here is another very important factor that traders must remember. A single candle breakout usually offers a 1:2 risk-reward ratio. This means traders shall add some extra pips with their profit target when they get such price action. The drama remains. Have a look at the chart below.

The price makes a correction and seems to have found support again. It suggests that the buyers are still in control. Smart buyers take their Partial profit and let the rest of the trade run to earn more pips.

As mentioned, breakout attributes give clues about the trend’s strength. Eventually, this helps traders manage their trade nicely and make more money out of trading.

Categories
Forex Price Action

Equidistant Channel Trading: What Else to Consider?

Equidistant Channel is a very reliable trading tool for the price action traders. In an ascending Equidistant Channel, the buyers wait for the price to come at the support level and to get a bullish reversal candle to go long. It is vice versa, in the case of a descending channel. However, some other equations are to be taken care of by the traders when trading with an Equidistant Channel. In today’s lesson, this is what we are going to demonstrate. Let us get started.

The chart above shows that the price is caught within an ascending Equidistant Channel. Look at the last bearish wave. After a rejection, the price heads towards the support. As a trader, we shall wait for a bullish reversal candle to go long here. Let us proceed to find out what happens next.

Wow! The price action traders always dream of this. This is one good bullish reversal candle. A bullish engulfing candle right at the channel’s support, the buyers, shall jump into the pair to start buying. However, we must set stop loss, take profit. Stop Loss level looks very evident here, which will be below the signal candle (Bullish Engulfing Candle here). What is about the Take Profit level? Where shall we set it? Typically, we set it at the upper band of the channel since the price usually goes towards the resistance of the channel after having a bounce at the support level.

Look at the chart. At the last wave, the price produced a bearish engulfing candle right at a strong horizontal resistance (arrowed). It had a rejection at this level earlier, as well. Thus, this is a level, which must be counted at the time of setting Take Profit level.

Despite having an engulfing daily candle, the price does not head towards the North with a good buying pressure. Anyway, it heads towards the upside. Look at the rejection. This means setting our take profit at the horizontal resistance would give us 1:1 risk and reward ratio here. This is not bad. However, if we make a target to go all the way towards the upper band, it may get us a loss instead.

Let us see how the price action acts afterward.

We would not make a loss here, but see how the price action has been. It gets choppy. It may still offer more long entries since the support is held by the price. However, we know what else is to look for, a breakout at a significant level of horizontal resistance.

Key Points to Remember in Equidistant Channel trading:

  1. A significant level of horizontal support/resistance is to be broken.
  2. If there is no horizontal support/resistance, an anti-trend line is to be broken.
  3. The signal candle is to be a strong trend reversal candle.
  4. In the case of having horizontal support/resistance in the middle of a channel, at least the Risk-Reward ratio is to be 1:1.
Categories
Forex Market Analysis Forex Signals

USD/JPY Testing Lower Edge of Bullish Channel – Can We Expect Buying?

The USD/JPY currency pair traded bullish to hit the three-months high at 108.94 before declining to 108.40. As of writing, the USD/JPY currency pair is trading near the 108.40s and touches away from the 200-day Moving Average.

Brexit developments left a positive sentiment on the market, and the investors got encouragement from the progress between Turkey and Syria wherein the ceasefire was formed by the United States announced by the VP Pence in a press conference during the United States session.

However, third-quarter earnings statements were the main focus that raised the benchmarks, and subsequently, the Dow Jones Industrial Average, DJIA, ended with an increase of approximately 26 points, or 0.1%, near 27,028. Consequently, the safe-haven currency Japanese lost its haven appeal despite US September industrial production came worse than expected. The figure fell by -0.4%m/m against estimates of -0.2% while August was revised to +0.8%m/m from +0.6%m/m.

As for yields, the United States 2-year treasury yields increased from 1.58% to 1.64% due to the Brexit headlines then fell back to 1.60%. Markets are still expecting 20-basis-points of a rate cut at the 31 October meeting and a terminal rate of 1.24% against1.88% currently.

Japanese inflation data for September reported with the headline Consumer Price index in at 0.2% Year over Year (YoY) vs. the expected 0.2% & prior 0.3%.

  • Japan CPI (YoY) sep: 0.2% (est 0.2%, prev 0.3%).
  • Ex fresh food (YoY): 0.3% (est 0.3%, prev 0.5%).
  • Ex fresh food, energy (YoY): 0.5% (est 0.5%, prev 0.6%).

USD/JPY – Technical Analysis 

On the 4 hour chart, the USDJPY is trading bullish above 108.400, and above this, we can expect the USD/JPY to go after 108.900. It’s the bullish channel, which is keeping the safe-haven pair supported.

Daily Support and Resistance
S3 107.69
S2 108.18
S1 108.4
Pivot Point 108.67
R1 108.89
R2 109.16
R3 109.65

In the case of a bearish breakout, the USD/JPY pair can drop towards 108.000 level. Therefore, the traders may consider staying bullish over 108.400 and bearish below the same to capture quick 30/50 pips on either side.
All the best!

Categories
Forex Market Analysis

Daily FX Brief, October 15 – Major Trade Setups – Investors Back from Holiday! 

The U.S. dollar stabilized on Monday, with the ICE Dollar Index edging up 0.1% on the day to 98.46.

The euro slipped 0.1% to $1.1027, halting a three-day rally. Official data showed that the eurozone industrial production grew 0.4% on month in August (+0.3% expected). Later today, the ZEW German Current Situation Index for October will be reported (-23.6 expected, -19.9 in September).

The British Pound retreated 0.3% to $1.2609, following a surge of more than 3.0% in the prior two sessions. Finnish Prime Minister Antti Rinne told reporters that he does not think it would be possible for the European Union and the U.K. to agree on the terms of a Brexit deal in time for the summit of leaders starting Thursday. Meanwhile, U.K.’s jobless rate for the three-month to August will be released later today (steady at 3.8% expected).

Economic Events to Watch Today

Let’s took at these fundamentals.


XAU/USD– Daily Analysis

The safe-haven metal prices rose but still below the key level of $1500 due to fresh uncertainty between the United States and China trade talks. The U.S. gold futures for December delivery inched up 0.2% to $1,499.02 during the Asian session before taking a bearish turn ahead of the European session.

The gold prices recovered as China now wants to do more trade discussions before signing the critical phase one trade deal. The Chinese attitude appeared to contradict the U.S. President’s contention on Friday that both nations were very close to making a deal.

Besides, China wants Trump to finish the scheduled tariff hike in December. Treasury Secretary Steven Mnuchin announced CNBC in an interview that he anticipates that both nations couldn’t reach on the deal due to the December hike.


Daily Support and Resistance

S3 1430.45

S2 1459.63

S1 1474.37

Pivot Point 1488.82

R1 1503.56

R2 1518

R3 1547.19

XAU/USD– Trading Tips

Gold has also exhibited choppy trading in a narrow range of 1,497 – 1,489. A bullish breakout of 1,496 can extend buying until 1,502 level whereas, the bearish breakout of 1,489 level is likely to continue selling until 1,481 level and 1,474. Today 1,494 is a crucial level to focus, as gold can stay bearish below this and bullish above this level.


EUR/USD – Daily Analysis

The EUR/USD currency pair found on the Doji candlestick pattern which indicates traders’ indecision. The EUR/USD currency pair hit a high and low of 1.1043 and 1.1013, and the trading area remained the same as it was on Friday. The EUR/USD continues to maintain a sideways range of 1.1063 and 1.1001. 

At the German Zew Survey front, Economic Sentiment (Oct), which is scheduled to release at 09:00 GMT, is anticipated to print at -27.3 against-22.5 in September. Whereas, the current is expected to come in at -26, marking a deterioration from September’s -19.9 reading. 

Upbeat expectations may get a strong buying trend in the shared currency. However, a bullish daily close could remain elusive If the markets turn risk-averse due to the negative China producer price index data, which was released in the Asian trading hours.


Daily Support and Resistance


S3 1.091

S2 1.0972

S1 1.1005

Pivot Point 1.1034

R1 1.1067

R2 1.1096

R3 1.1158

EUR/USD – Trading Tips

The EUR/USD currency pair trading sideways in tight trading limits of 1.1043 and 1.1001. A close above 1.1043 would suggest a resumption of the rally from fresh lows around 1.0879. Conversely, a close below Monday’s low of 1.1043 would mean an end of the recovery rally.

An upward channel of the EUR/USD is still intact, and the major currency pair continues to trade within this range of 1.1043 and 1.1001. Consider taking buying positions over 1.100 level to target 1.1050 and 1.1070. On the flip side, bearish bias can be seen under 1.1000 until 1.0976 and 1.0856. 


GBP/USD – Daily Analysis

The GBP/USD currency pair got to the highest level since January 2018. The investors are expecting Brexit breakthrough and continuing bets to position for a rally in Pound.

As of writing, the GBP/USD currency pair is currently trading at 1.2618, found on the highest track on the day. 

One-month risk reversals (GBP1MRR), a gauge of calls to puts on the GBP, increased above zero on Friday and currently stands at 0.25, the highest level in 21 months.

The possibilities of Britain securing an orderly departure from the Europan Union have lost during this week due to the comments by the Finlands Prime Minister that time has finished.

However, the GBP currency could continue its bullish momentum as there are some renewed sentiments regarding anther Brexit summit, most probably at the end of this month.

Additionally, the British Pound may get buyings if the United Average Earnings (Aug) releases against past expectations. The data is scheduled to release at 08:30 GMT.

On the negative note, if the data release against the expectation and if any negative news comes concerning Brexit, then the GBP/USD currency pair could hit the bearish track sharply. 


Daily Support and Resistance


S3 1.199

S2 1.2289

S1 1.2469

Pivot Point 1.2588

R1 1.2768

R2 1.2887

R3 1.3185

GBP/USD – Trading Tips

Technically, the GBP/USD continues to trade bullish in the wake of a stronger Sterling. The pair has completed 38.2% Fibonacci level at 1.2592 and now holding above this level, looking for a solid fundamental reason to determine the next movement.  

On the upper side, the GBP/USD is likely to face strong double top resistance around 1.2700. Breakout 1.2700 can trigger further buying until 1.12759. Let’s keep an eye on 1.2588 now to take quick trade opportunities.

All the best!