Categories
Forex Market Analysis

Gold Hits a New Record High

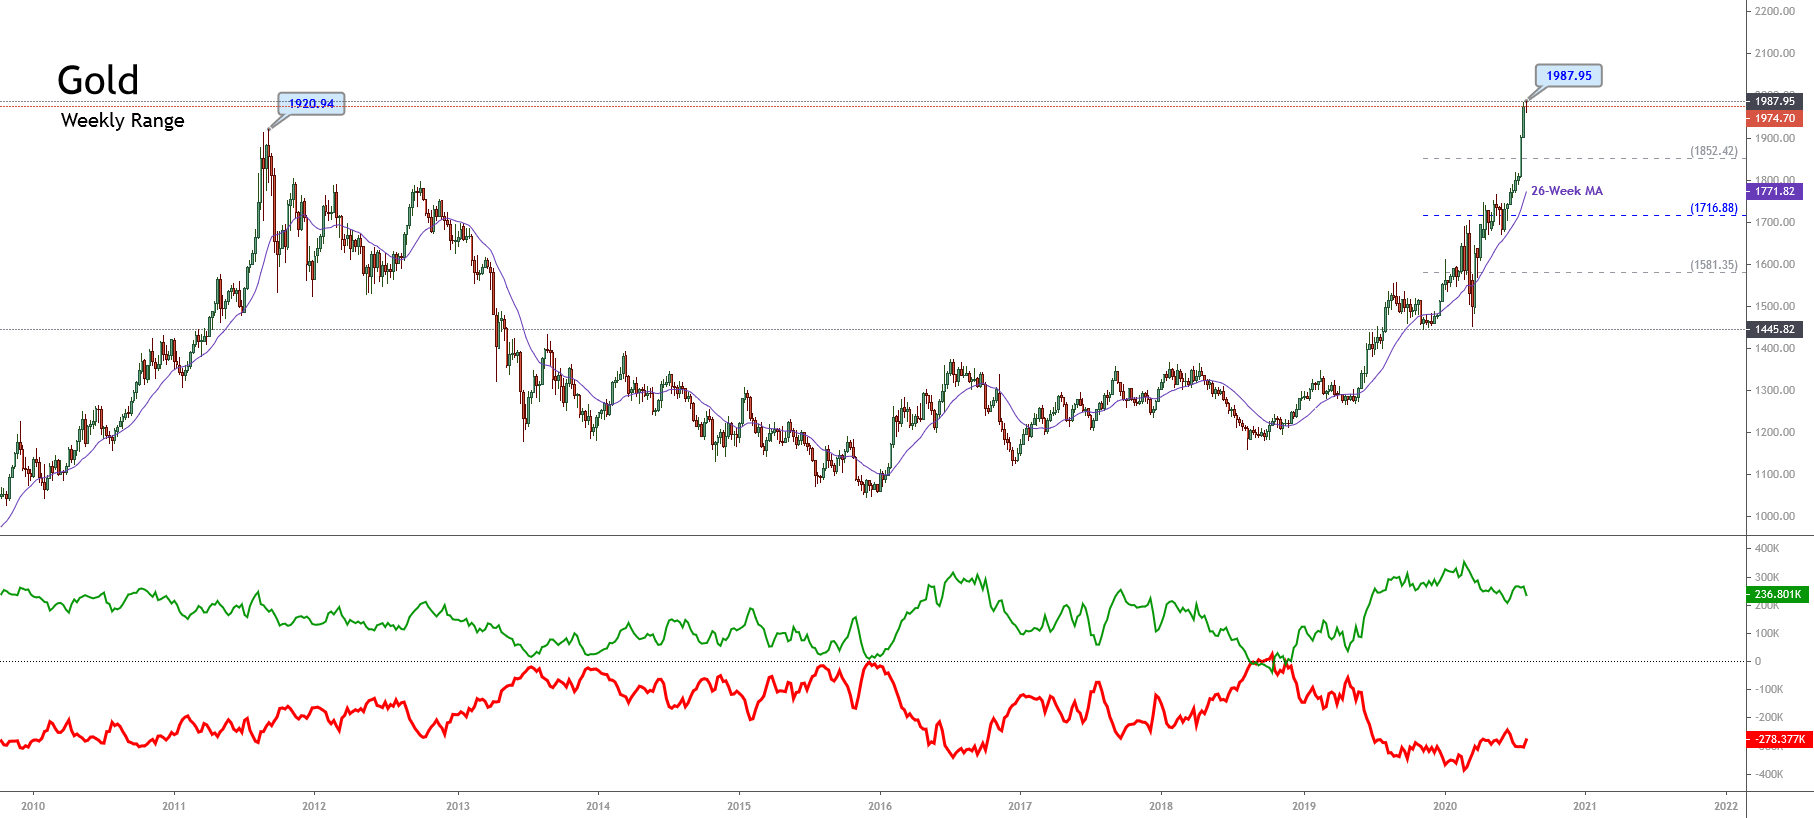
The Gold price opened the current trading week to reach a new all-time high at $1,987.95 per ounce, approaching the psychological barrier of $2,000 per ounce. 

Market Sentiment Overview

During this year, the precious metal reports an advance over 31% (YTD), boosted by global recession concerns. The safe-haven metal has increased its value at a similar pace of the descents on the worldwide growth rate. A fact that reduces the possibility of an economic recovery in the near term.

In its weekly chart, the yellow metal exposes the bullish momentum that sent the price over September’s 2011 high at $1,920.24 per ounce, climbing to $1,987.95 per ounce this week.


On the first chart, we distinguish the price moving in the strong bullish sentiment zone of the 52-week high and low range, where we observe the precious metal reaching fresh highs. Simultaneously, the price action continues moving above the 26-week moving average, showing that the bullish bias remains intact. The separation between the moving average and price leads us to conclude that Gold is in an overbought stage. This condition may carry the precious metal to begin a corrective movement.

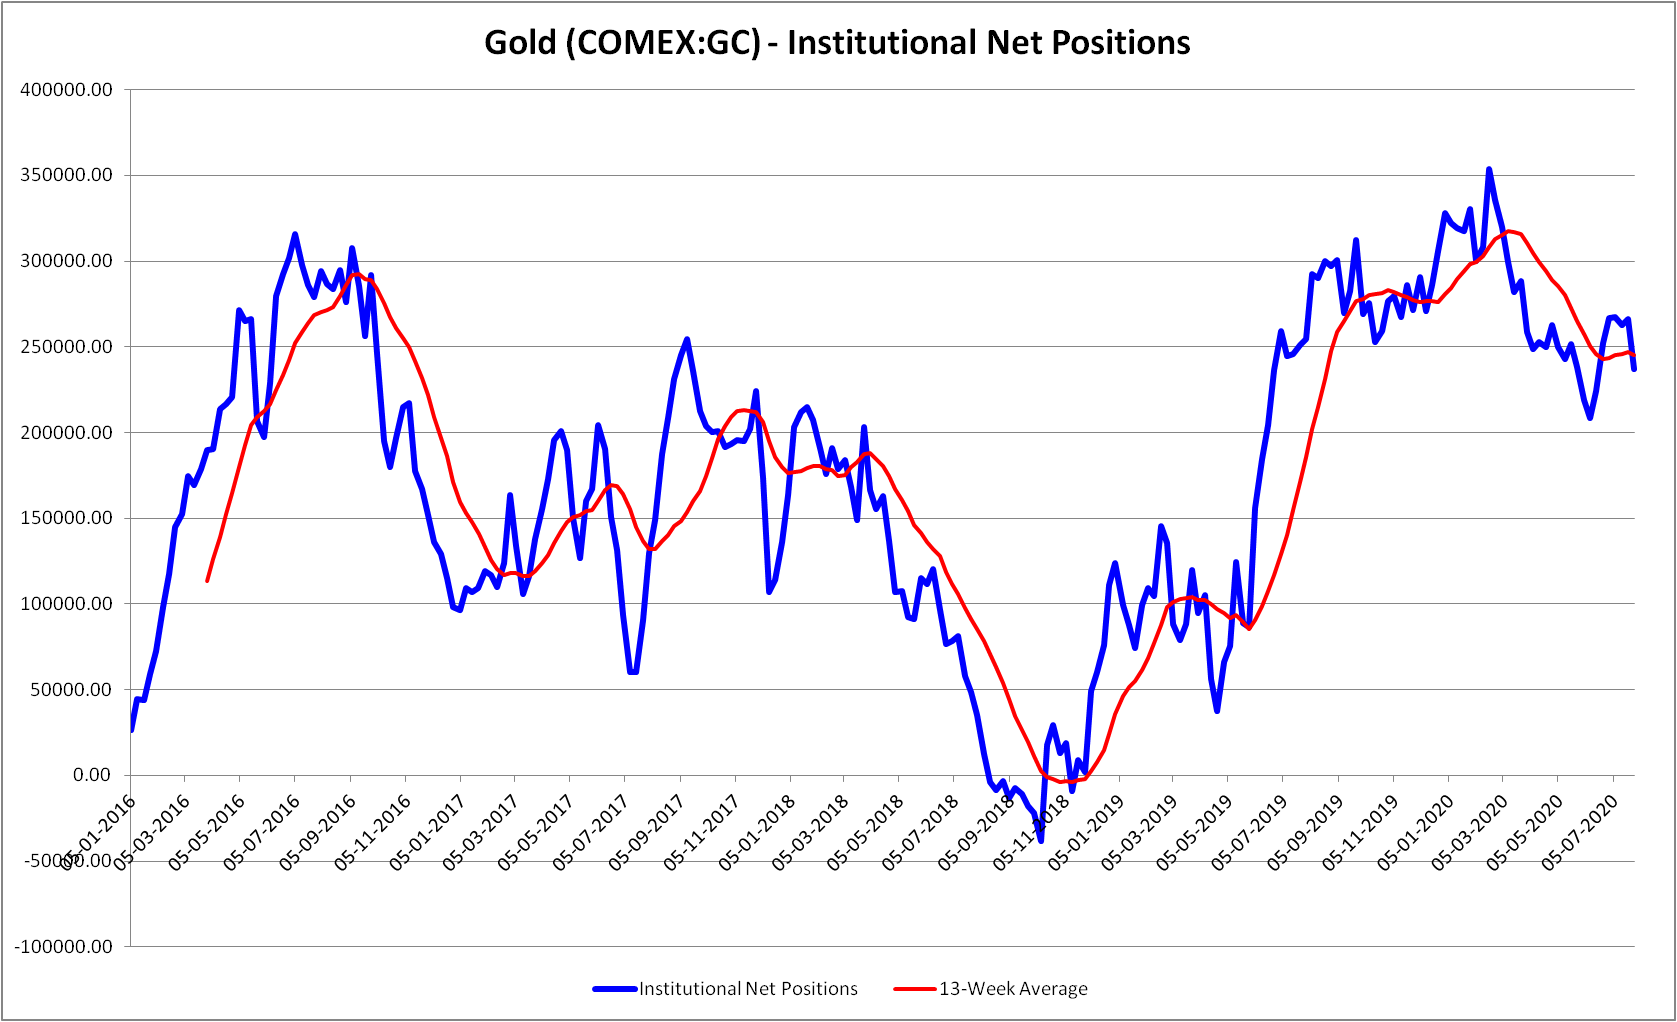
On the other hand, the Institutional Net Positioning – green curve at the bottom of the previous image- shown by its latest CFTC report, reveals a decrease in the speculative positioning,  decreasing by 11.12% (WoW) compared with the previous reading. This decrease exposed in the following figure illustrates the institutional net positioning moving bellow the 13-week moving average. 

Summarizing, although the price action continues reaching fresh all-time highs, the big participants’ actions reveal a take-profit activity on their long-side positioning, which could be being helped by an extreme bullish sentiment on news media.

Elliott Wave Outlook

The short-term Elliott wave  Gold’s perspective unveiled in its 2-hour chart reveals the price moving in a terminal structural series corresponding to an ending diagonal pattern. This technical formation comes after the price rallied, developing a third extended wave of Minuette degree identified in blue.

The bullish cycle that remains intact began on June 05th when the yellow metal found fresh buyers at $1,668.30 per ounce. The impulsive sequence observed in the previous chart, reveals its advance in a third extended wave, which topped at $1981.20 per ounce on July 28th, where the price retraced from, completing its wave (iv) of Minuette degree identified in blue. 

Once the fourth wave in blue was completed, the price of Gold advanced in the current fifth wave of Minuette degree, showing an internal structure that looks like an ending diagonal pattern. This Elliott wave formation warns us about the potential reversion of the bullish trend. Although it will likely decline short-term, Gold’s bias remains on the bullish side as long as the price stays above $1,907.20. However, if the price breaks and closes below the base-line ii-iv of the ending diagonal, the yellow metal could visit the $1,907 level as its first relevant support.

Categories
Forex Signals

Gold: Moving South Below the 50-Period SMA

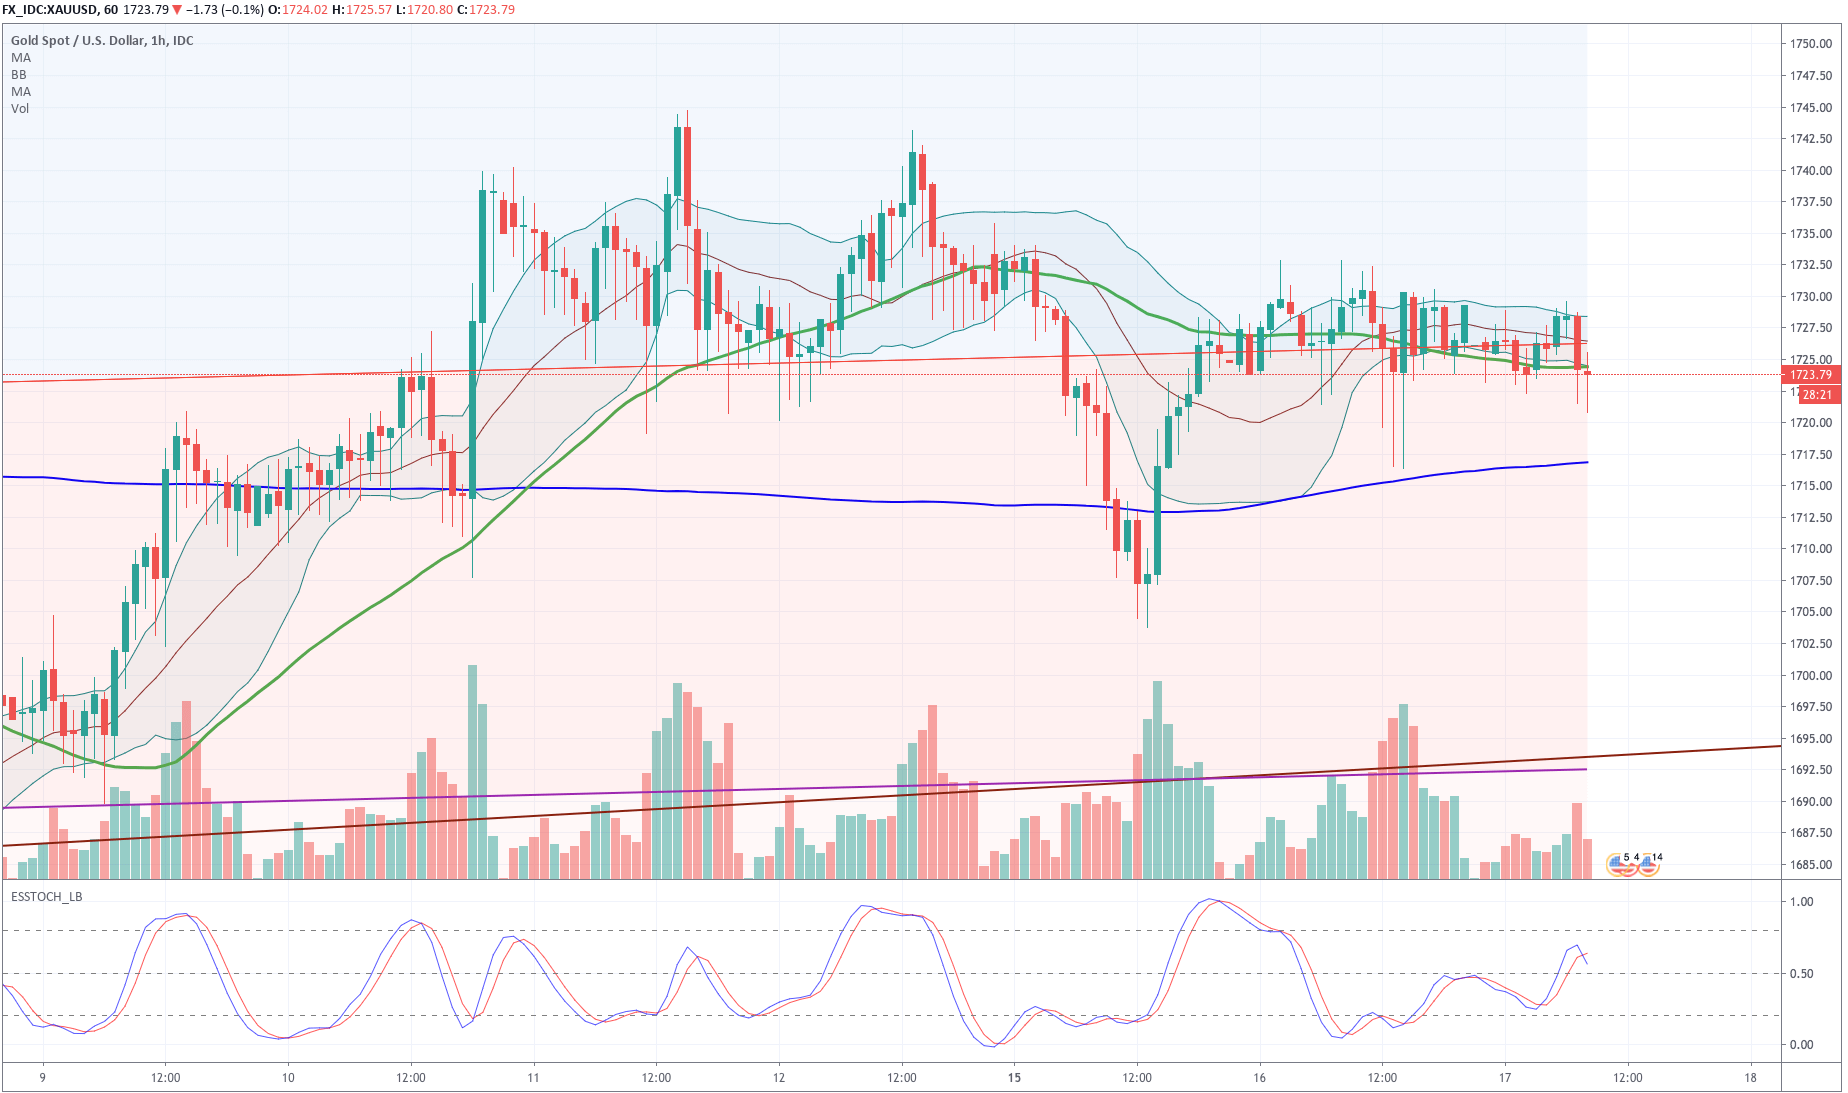
XAUUSD had a bounce off its lows that began on Jun 15 at 13:00 the bounce re3ached the $1730 level and began to move sideways, making lower lows. The last interaction made an evening star with a large bearish candlestick. We think this is a good short setup to scalp with a target at the current 200-hour SMA for a nice and fast reward. The R/r factor is just 1 but the odds of the pair going south are very high, which makes the trade appealing. We see also that the Stochastics made a crossover to near the middle of the range, suggesting an increased bearish momentum.

Trade Setup:

Entry: 1,724.64

Stop-loss: 1,734.64

Take profit: 1,714.64

Reward/Risk: 1

Risk: 100 pips which is $1000 per XAUUSD Lot, or $10 on a micro-lot. The reward is identical as the R/r =1


Categories
Forex Signals

XAU/USD Trades Bullish Amid Trade Tensions – Update on Buy Signal! 

The safe-haven-metal prices took bids and rose to $1,721 while represented 0.15% gains on the day due to the risk-off market sentiment in the wake of intensifying tussle between the United States and China over Hong Kong. As well as, the US dollar selling bias also boosted the yellow-metal. At the press time, the safe-haven-metal prices are currently trading at 1,720.83 and consolidating in the range between 1,712.92 and 1,722.94. However, investors are cautious about placing any position ahead of an expected announcement by President Donald Trump on China later in the day.

It should be noted that the futures tied to the S&P 500, Wall Street’s benchmark index, was down 0.6%. Asian stocks also flashed red with Australia’s S&P/ASX 200 index leading the way lower with a 1.11% decline. 

As we all well aware that China has imposed the controversial security law on Hong Kong to curb the City’s autonomy earlier this week. In return, the US had warned that they would impose bans on China if China moves ahead with this law. So, the law has been implemented now, and all eyes are on President Trump’s actions ahead.


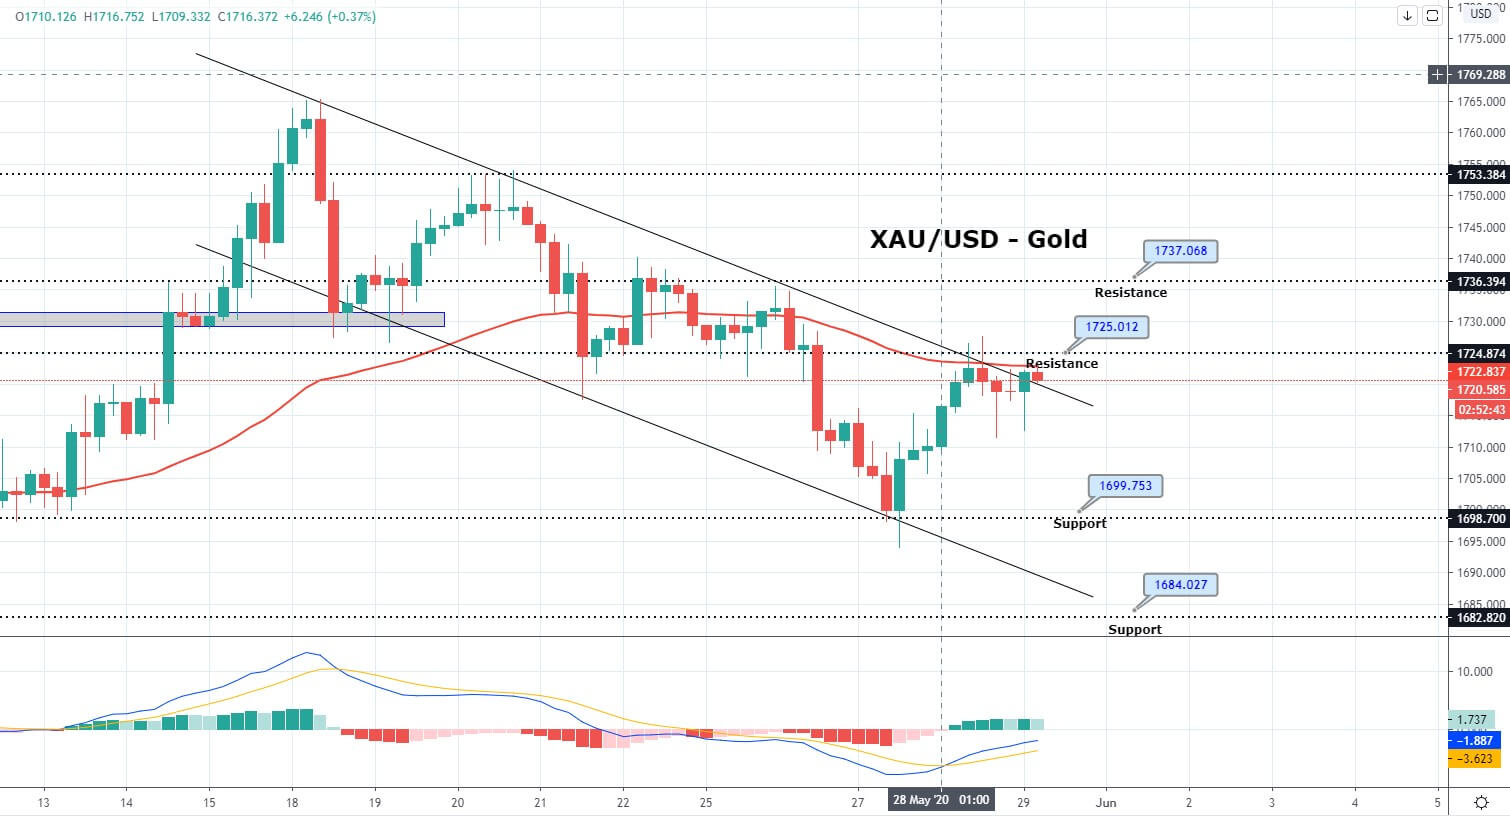
The XAU/USD prices are now holding below 1,725 level, which is extending resistance to gold, but the close of recent bullish engulfing candle is suggesting chances of further buying in gold. The downward channel seems to get violated now, and it’s keeping the gold in a bullish mode. We can try to capture a quick buy trade in gold in order to secure profit until 1,728 level. The RSI is also taking an upward turn and may cross below 50 to supported selling bias. 

Entry Price – Buy 1722.93    

Stop Loss – 1716.93    

Take Profit – 1729.93    

Risk to Reward – 1.17

Profit & Loss Per Standard Lot = -$700/ +$800

Profit & Loss Per Micro Lot = -$70/ +$80

Categories
Forex Signals

Gold Bullish Bias Continues to Dominate – Brace for a Buying Trade! 

Gold is on a bullish run as it’s the pricing has soared to 1,730 level in the wake of increased safe-haven appeal in the market. The U.S. government bond prices increased, pressing the benchmark 10-year U.S. Treasury yield down to 0.637% from 0.751% Tuesday.

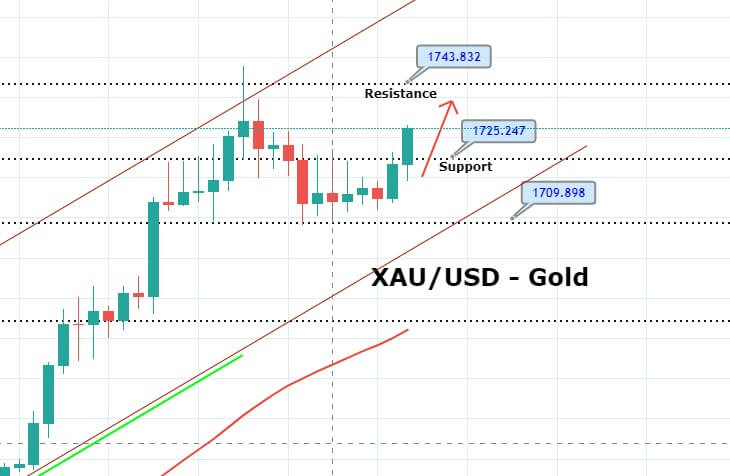
On Thursday, the precious metal gold is trading with a strong bullish bias on the back of an increased number of COVID 19 cases around the globe. On the 4 hour chart, gold is trading within a bullish channel, which is supporting the XAU/USD prices above 1,709 level, and these are also providing resistance at 1,738 and 1,747 today.


The RSI and MACD are suggesting odds of bullish trend continuation, which is why we have entered a bullish trade around 1726 with a stop loss below 1726 and take profit of around 1739. 

Entry Price: Buy at 1726 

Take Profit 1739    

Stop Loss 1718    

Risk/Reward 1.63

Profit & Loss Per Standard Lot = -$‭800/ +$1300

Profit & Loss Per Micro Lot = -$‭80/ +$130

Categories
Forex Market Analysis

Bullish Bias in Gold Fades – Is It Going to Retrace Back? 

On Friday, the yellow metal gold as showing sideways trading around 1,683 level after mounting to the highest level since March 9. Yesterday, most of the bullish bias was seen in the wake of another stimulus plan announced by the Federal Reserve. 

The U.S. President Donald Trump is showing willingness to support the USA fight against the coronavirus (COVID-19), which eventually seems to help the risk-tone. This time, the Fed will elevate about $2.3 trillion to promote small and medium-sized companies, districts and workers harmed by the coronavirus break.

Increased volatility driven by COVID 19 has driven gold prices higher towards the forecasted resistance level of 1,689 and has closed a candle below this level. 

The consumer price index declined 0.4% from the previous month and grew 1.5% year, which is extremely lower than 2.3% gain in February. The pair got major as energy prices sank by the most in five years, exhibiting one of the stronger-ever breakdowns in oil prices.

XAU/USD – Daily Technical Levels

Support Resistance 

1656.59 1700.91

1629.83 1718.47

1585.51 1762.79

Pivot Point 1674.15

On the four timeframes, precious metal gold has formed three white soldiers, which suggest odds of further buying in the pair. Continuation of the upward trend may lead to gold prices towards the next resistance level of 1,702. At the moment, there are odds that gold prices may show correction until 1,676 and 1,669 marks ahead for extending further buying trends today. Good luck! 

Categories
Forex Market Analysis

Gold’s Ascending Triangle Breakout Continues to Play – COVID 19 Fears! 

On Tuesday, the precious metal gold prices slipped over 1%, reversing from a near one-month high hit earlier in the session, as symptoms of less than before coronavirus patients in major epicenters fueled equity markets, pulling away some of the gold safe-haven demand.

The yellow-metal prices broke its early consolidation phase and hit the 1-week high near the $1660 mark in the last hour. Whereas, the gold traders did not give any significant attention to the goodish pickup in the US bond yields as well. The gold is currently trading at 1,665.60 and consolidates in the range between the 1,638.30 – 1,669.95.

The buyers of gold ignored robust recovery in the global risk sentiment, which is supported by a reduction in the number of deaths from COVID-19 and which tends to weaken the metal’s perceived safe-haven demand. Meanwhile, the risk-on sentiment was further strengthened by a strong pickup in the US Treasury bond yields.

Daily Support and Resistance

Support     Resistance
1628.08     1687.6
1592.25     1711.3
1532.73     1770.83
Pivot Point 1651.78

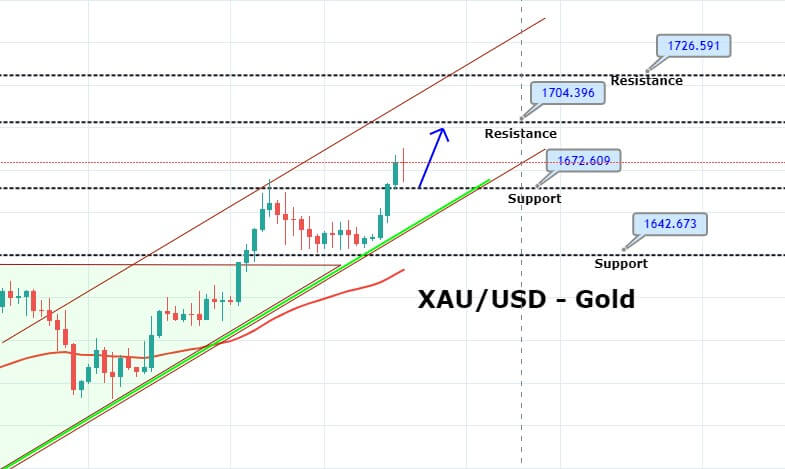
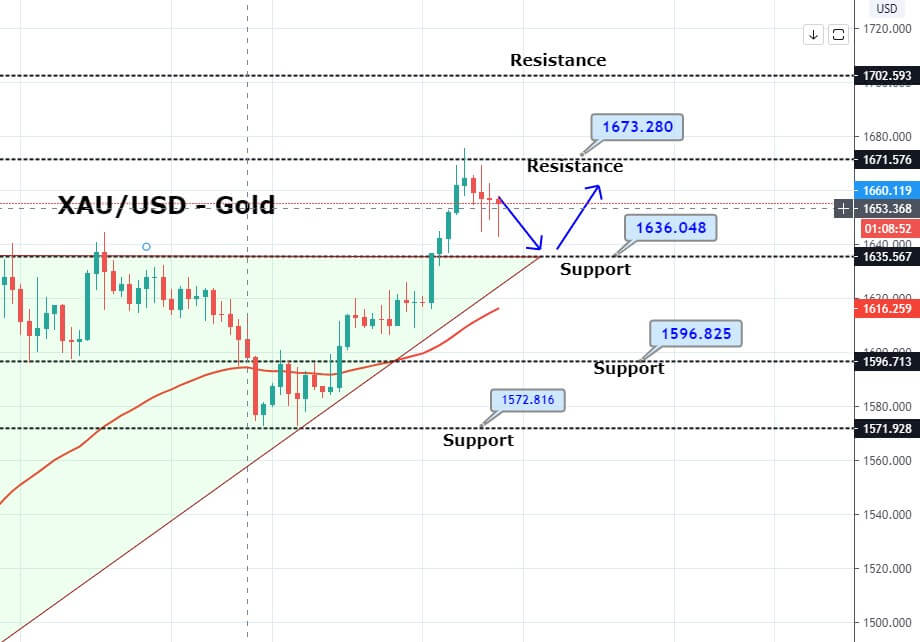
A day before, the precious metal gold violated an ascending triangle, which was providing resistance at 1,636 level, and now it’s working as solid support. Closing of candles above this level is suggesting chances of more buying until the next resistance level of 1,671. While support continues to hold around 1,650 and then 1,636. The leading indicator MACD is also supporting the bullish trend in gold. 

Gold has shown some correction as it dropped today from 1,673 high to 1,650 level, but now it’s time to expect another bullish rally. Let’s consider taking bullish trades over 1,650 levels to target 1,662 and 1,671. Good luck!

Categories
Forex Market Analysis

Gold’s Bullish Bias Remains Dominant – Is It Going After 1,633? 

On Thursday, the precious metal gold prices soared over 1% to trade around 1,608 in the wake of record-high U.S. jobless claims. The U.S. unemployment claims rose for a second week in a series over intensified concerns of economic damage because of coronavirus, which eventually drove traders towards the safe-haven metal.

The quantity of Americans registering jobless claims multiplied from the previous week to a record high of 6.65 million, as more areas of the U.S. enforced stay-at-home steps to curb the coronavirus. 

Global sentiment is getting worse time by time, despite the central banks’ and governments’ on-going struggles to fight against COVID-19. As a result, investors seem to move toward the gold as fears of a global recession stay in play, especially if noises start showing in the largest economy in the world. 

XAU/USD – Daily Technical Levels

Support       Resistance 

1,574.53      1,604.78

1,557.62     1,618.13

1,527.36     1,648.38

Pivot Point 1,587.87

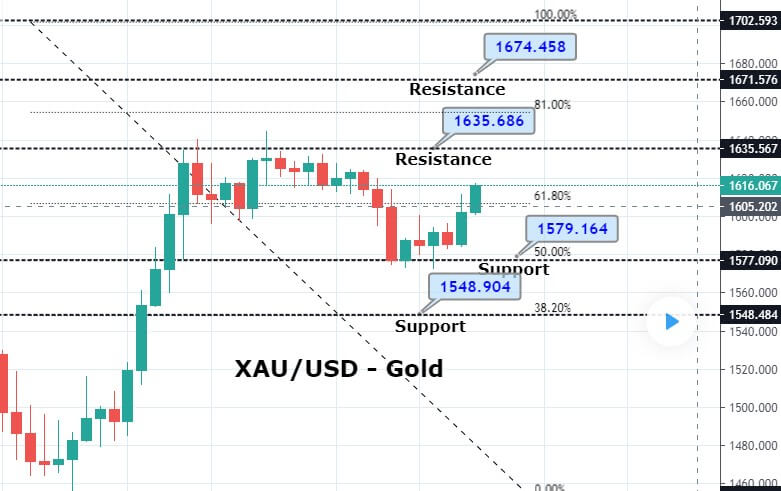
On the technical front, gold is trading at 1,610, and it’s maintaining a broad trading range of 1,635 – 1,577. On the 4 hour chart, gold has closed a bullish engulfing candle, which is suggesting chances of buying trend in gold. The XAU/USD may find an immediate resistance at 1,622 and 1,634, while support stays around 1,600 and 1,595 level. The MACD and RSI are crossing over on the bullish side, and these are also supporting a buying trend in gold. Consider taking buying trades over 1,610 with a target of 1,622 and 1,627. Good luck! 

Categories
Forex Market Analysis

Gold Exhibits a Dramatic Dip – Is It Good Time to Go Long?

On Thursday, the precious metal fell dramatically despite worries about the economic influence of the coronavirus break on the global market.s The United States rejected flying from virus-infected Europe, although gains were capped as investors covered margin calls after plunge inequities.

The global coronavirus crisis deepened, as the number of cases surged to 7,375 (366 deaths) in Italy, to 7,313 (50 deaths) in South Korea, and 6,566 (194 deaths) in Iran. The situation is also worsening in France (1,126 cases), Germany (1,040 cases), Spain (674 cases), and the U.S. (534 cases). The New York Stock Exchange reopened trading following a brief pause initiated by a 7% slump quickly after the market opened. 

Support Resistance

1,646.71     1,696.48

1,619.68     1,719.22

1,569.91     1,768.99

Pivot Point 1,669.45

The yellow metal gold slips dramatically, falling from 1,649 high level to 1,573 level during the U.S. session open. Usually, gold get’s stronger when the stock market drops, but in today’s case, both the stock markets and billions are falling like a tit for tat situation. 

At the moment, gold is gaining support at 1,574 level, and violation of this can open the selling room until 1,562 mark. While the closing of candles above 1,573 can help us capture a quick retracement until 1,602 level. Let’s wait for the market to calm down a bit before we place further bets in gold. 

Good luck! 

Categories
Forex Market Analysis

Safe Haven Gold Completes 38.2% Retracement – Coronavirus Risk In Play! 

On Wednesday, the precious metal gold prices rose slightly following a sharp decline in the prior session, as a U.S. indication of an imminent pandemic urged traders to seek shelter in safe-haven assets.

Gold prices climbed 0.7% to $1,646.19, having decayed as much as 1.9% in the prior session. On Monday, prices reached their highest level in more than seven years at $1,688.66. Today, the yellow metal gold prices eased 0.1% to $1,648.30.

The United States announced it’s citizens to start planning for the virus to expand inside the country as outbreaks in Iran, South Korea, and Italy intensified. The consequences of the epidemic are expected to reflect beyond China as the most significant markets in the region are anticipated to either slow down significantly, stop or recoil entirely in the current quarter.

The speedy spread of the disease and its influence on global economic movements boosted chances for monetary policy easing by global central banks, with U.S. money market futures now entirely pricing in a 0.25% point cut by the end of June. Nevertheless, U.S. consumer confidence soared in February, implying a constant pace of consumer spending that could boost the economy despite rising fears over the fast-spreading disease.

XAU/USD – Daily Technical Levels

Support     Resistance 

1,643.69     1,682.16

1,628.07     1,705.01

1,589.6       1,743.48

Pivot Point 1666.54

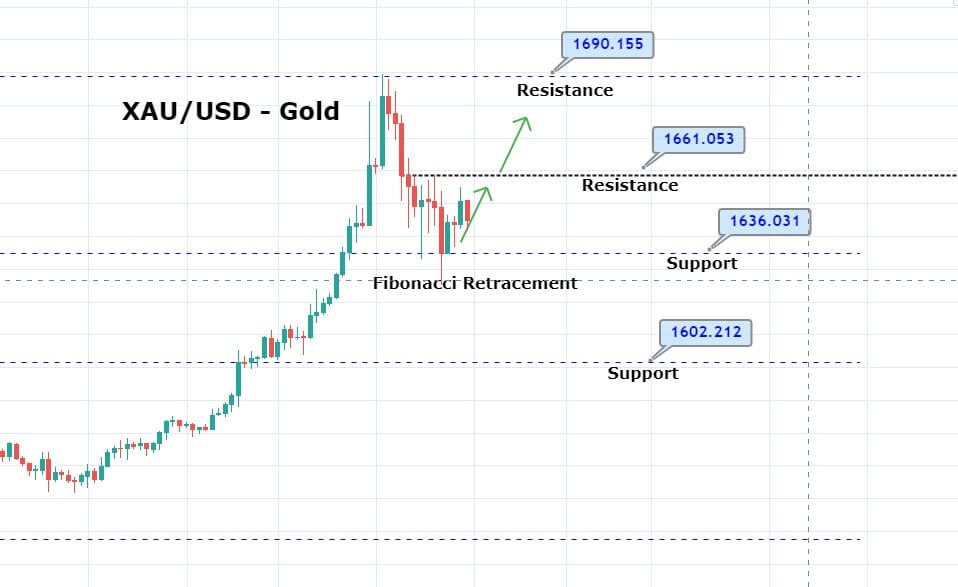
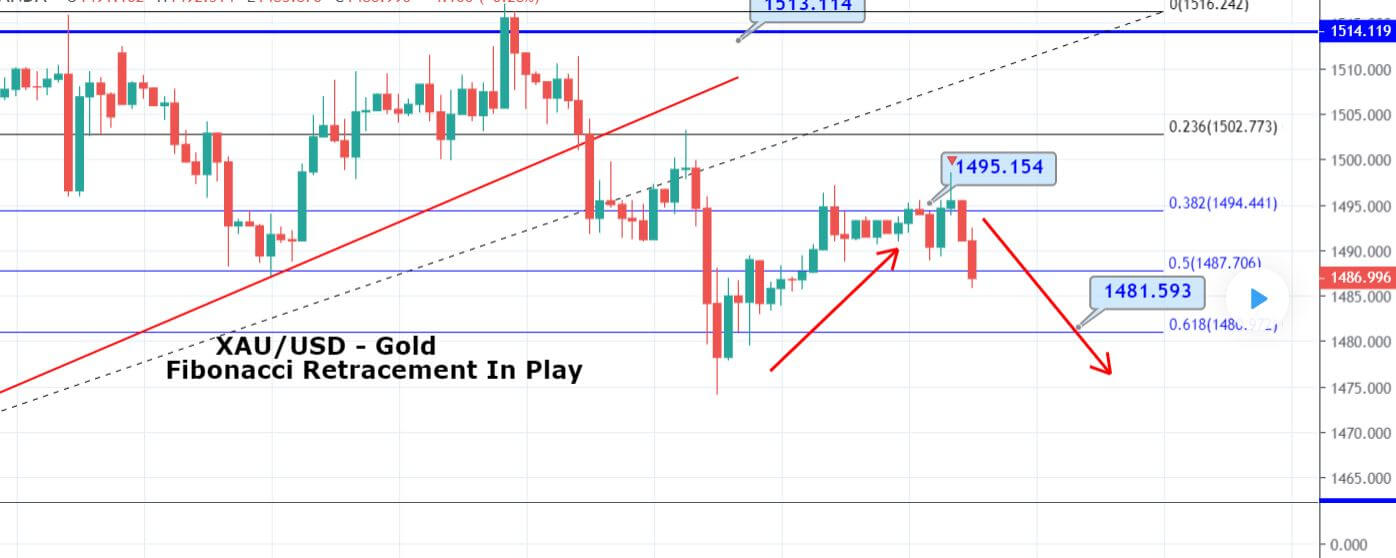
Gold has already completed the 38.2 %Fibonacci retracement at 1,636 level. The MACD and RSI are holding in the selling zone, supporting bearish bias for the gold. Gold has an immediate resistance around 1,660, which may keep gold prices in a bearish mode until this level gets violated. A bearish breakout of 1,636 level can lead to gold prices towards the next support level of 1,619 and 1,609. Both of these levels mark the 50% and 61.8% Fibonacci retracement levels. Let’s consider selling below 1,630 to target 1,626 today. Good luck


Categories
Forex Market Analysis

Gold’s Symmetric Triangle Remisn Intact – Investors Eye for a Breakout!

ouldThe precious metal gold traded bullish again since the inception of the trading day, topping the $1,576 level after the price dropped to the $1562 through the session. That has happened despite the words by the Chinese president that the corona situation is under control and that the disease is at its top; thus, the situation would be entirely contained by next April.

In addition to this, the U.S. Labor Department announced its U.S. Consumer Price Index increased 0.1% in January, following a 0.2% increase in December. The U.S. CPI figures were weaker than anticipated, as forecasts were for a growth rate of 0.2%.

The U.S. core CPI data increased in line with forecast, rising 0.2% during the previous month, following December’s surge of 0.1%. Annual core inflation climbed 2.3% last month, the report declared.


Support Resistance
1,561.75 1,570.37
1,557.54 1,574.77
1,548.92 1,583.38
Pivot Point 1,566.15

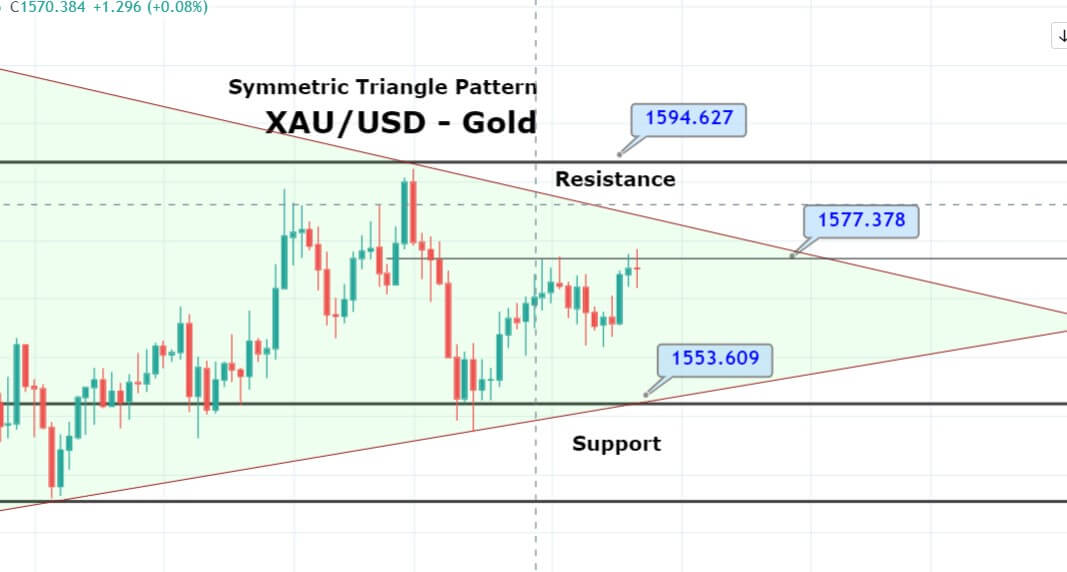
On the technical front, the precious metal gold is trading within a symmetric triangle pattern, which is keeping the yellow metal prices in a sideways range of 1,577 – 1,552. Typically, the symmetric triangle pattern signals the indecision among traders and demonstrates that the investors are looking for a solid reason to trigger a breakout while this breakout can be on either side. With that being said, we need to keep a close eye on the 1,577 level as the bullish breakout of this level can extend buying until 1,585 level. Good luck!

Categories
Forex Market Analysis

Gold Sideways Session Continues Despite Weak NFP Report! 

Gold prices trimmed down on Friday, after sinking as much as 1% in the prior session, as rising tensions in the Middle East lead traders to shift to riskier assets. The safe-haven-metal prices still flashing red and continue to drop mainly due to risk-on sentiment in the market in the wake of de-escalated US-Iran conflict.

As we all well aware that the gold prices hit the high level of $1,611 on Wednesday since 7-year high after Iran shot ballistic missiles at two Iraqi airbases housing U.S. forces. But later, U.S. President Donald Trump gave the sluggish comments regarding impose new economic restrictions on Iran rather than taking any military action against the country. 

Most Asian markets continued to rise on Friday morning as well because trade talks between the U.S. and China continued to move forward according to the plan and will sign the deal on 15 January.

The statement came from China’s Vice Premier Liu He, head of the country’s negotiation team in China-U.S. trade talks, said that he is set to visit Washington next week to sign a trade deal with the U.S.

With this, the U.S. 10-year treasury yields take the bids around 1.865% while S&P 500 Futures marks 0.20% gains to cross 3,280 by the time of writing.


Daily Support and Resistance

  • S3 1481.92
  • S2 1525.03
  • S1 1540.84

Pivot Point 1568.13

  • R1 1583.95
  • R2 1611.24
  • R3 1654.34

Gold traded in line with the prior estimate as it dropped sharply on the breach of 1,552 marks to set a low around 1,538. At the moment, 1,552 is working as a critical trading level. Below this, gold can trade bearish unto 1,542. 

On the upper side, the bullish breakout of 1,552 can encourage buying, but for that, we need a strong reason, and the weaker and expected NFP can be this reason today. In any event, an upward breakout of 1,552 can lead to gold prices towards 1,561. Good luck! 

Categories
Forex Market Analysis

Daily FX Brief, October 22 – Major Trade Setups – Brexit Parliamentary Votes Ahead! 

The Canadian dollar continued to trade bullish around three-month high on Tuesday as the market seems to celebrate the re-election of the Liberal government, 

“You did it, my friends. Congratulations,” Trudeau told supporters in Montreal early on Tuesday.

Despite this win, few of the traders are worried that the Liberals need to depend upon an opposition party to govern the government. 

Economic Events to Watch Today

Let’s took at these fundamentals.


XAU/USD– Daily Analysis

On Tuesday, the yellow metal gold is trading mostly muted, pressed down by floating Asian shares that helped growth in trade discussions between the United States and China, but gained relief from a lack of certainty in the trade talk details.

The lack of clarity over Brexit has kept the gold prices inside a rang for almost two weeks. But on Saturday, some of the uncertainty cleared up from the market after the vote of U.K. parliament against PM Johnson’s Brexit Deal. Gold prices reacted to that news on Monday and showed a slight Bearish trend at the starting day of the week.

The precious metal gold continues to maintain a sideways range of $1,500 to $1,480. At the moment, the gold prices are taking a bullish turn as sellers seem to make profit-taking ahead of the Brexit Parliament vote today. 

Besides, the Peoples Bank of China (PBOC) reduced the mortgage rate from 4.25% to 4.20%. The LPR is estimated based on the range over the medium-term Loan Facility each month. 

Gold may face a bearish trend if the yield drops alliance with a bullish breakout over 1.80%. Nevertheless, the yellow metal is displaying flexibility by neglecting losses. The gold mostly falls due to the Central Bank’s hawkish policy.


Daily Support and Resistance   

S3 1472.23

S2 1480.87

S1 1485.48

Pivot Point 1489.51

R1 1494.12

R2 1498.15

R3 1506.79

XAU/USD– Trading Tips

Gold prices drifted lower on Monday and but the Tuesday sessions are bringing bulls. Gold is poised to test resistance around 1,491, which is extended by the bullish trendline resistance. 

Gold may find support bear near the triple bottom support level of 1,480. The MACD histogram is marking in the red with a smooth trajectory that leads to consolidation. Today, consider staying bearish below 1,492 and bullish above 1,480. 


EUR/USD – Daily Analysis

The Euro was little changed at $1.1152, while USD/JPY gained 0.2% to 108.61. The Euro traded mostly unchanged during the day on Monday, as traders didn’ find any reason to determine it’s direction. The market is presently a bit overstretched, so I would not be amazed at all to detect a bit of a pullback occurring.

The Euro has been comparatively low throughout the day on Monday, as we proceed to see much choppiness at the peak of a significant move. 

Studying the 4-hour chart, the 200-day EMA is also rising beyond the 61.8% Fibonacci retracement mark, a range that should bring much attention as well. With that being said, I am not a tremendous fan of attempting to jump in and begin selling instantly. We need to wait for a few checks; especially, the Brexit Parliament Vote is something than can trigger sharp volatility in the market. 


Daily Support and Resistance

R3: 1.1238

R2: 1.1197

R1: 1.1174

Pivot Point 1.1156

S1: 1.1133

S2: 1.1116

S3: 1.1075

EUR/USD – Trading Tips

The bullish engulfing candle over 1.1100 level pushes the currency pair towards the 1.116 level. The RSI and MACD are yet dispensing a buying bais, though the EUR/USD pair may exhibit retracement till 1.1130 ere dispensing a new bullish trend. 

Consider staying bearish below 1.1156 level today to target 1.1135 on the lower side.


USD/JPY – Daily Analysis

The USD/JPY was closed at 108.598 after placing a high of 108.662 and a low of 108.290. The overall trend remained Bullish that day.

At 4:50 GMT, the Trade Balance for September from Japan showed a figure of -0.10T against the expectations of -0.17T and supported the Japanese Yen. The All industrial activities of Japan for September came in as 0.0% against the expectations of 0.1% at 9:30 GMT.

USD/JPY showed an upward trend in the beginning day of the week, the hopes that U.K. Parliament would approve the re-voting for the Brexit deal caused high-risk factors in the market, and traders started buying USD/JPY under that influence. But when the U.K. parliament denied taking another vote on the same issue, the pair’s upward trend suffered.

Additionally, on Monday, the 10-year U.S. Treasury Bond Yield showed a growth of more than 1.5% and added in the upward trend of USD/JPY.

Furthermore, the White House economic advisor on Monday stated that US-China talks were going very well. If the written agreement would get signed in November, then the December tariff hikes could be avoided. This caused an increased demand for U.S. dollars in the market, and hence, USD/JPY surged.


Daily Support and Resistance

R3: 108.99

R2: 108.78

R1: 108.68

Pivot Point 108.57

S1: 108.47

S2: 108.36

S3: 108.15

USD/JPY – Trading Tips

The USD/JPY continues to trade a bullish channel, which is extending support at 108.350. On the lower side, the violation of 108.350 can extend bearish rally until the 108 level. Overall, the MACD and Stochastics are holding in the selling zone, signaling chances of a bearish bias.

The USD/JPY may find an immediate resistance at 108.57, and that’s I think is a perfect level to open sell positions. On the upper side, violation of 108.57 can extend buying until 108.950

All the best!  


Categories
Forex Market Analysis

Daily FX Brief, October 21 – Major Trade Setups – Brexit Deal Fails to Pass Parliament Vote! 

The U.S. Dollar Index slid 0.3% on the day to 97.28 on Friday. For the first time since December 2018, the index has been down for a third straight week.

The British pound rose 0.6% to $1.2973, posting a four-day rally. On Saturday, the British members of parliament voted to withhold approval of the Brexit deal. It is reported that the U.K. government has asked the European Union for a three-month delay to the Brexit deadline. This morning, the British pound retreated to $1.2919.

Economic Events to Watch Today

Let’s took at these fundamentals.


XAU/USD– Daily Analysis

The safe-haven metal prices consolidating in the narrow range of $1,500 to $1,480 since last Monday, as of now the prices slightly dropped due to traders expected more transparency in the Brexit progress.

At the Brexit front, the United Kingdom Prime Minister Boris Johnson attempted to have a meaningful vote on his Brexit deal on Saturday. Still, the U.K parliament declared an act withholding support until full legislation is passed. Therefore, Prime Minister Boris Johnson requested the European Union for a 3-months delay.

On the other hand, the Peoples Bank of China (PBOC changed the loan rate from 4.25% to 4.20%. The LPR is set based on the range above the medium-term Loan Facility rate every month. 

Gold may come under pressure if the yield ends consolidation with a bullish breakout above 1.80%. However, the yellow metal is showing resilience by ignoring losses. The gold mostly drops due to the Central Bank hawkish decisions.

The United States’ ten-year Treasury is currently unchanged around 1.75%. Interestingly, the benchmark yield is also lacking a clear directional bias since October 15. 

At the US-China trade war front, China’s Vice Premier Liu He stated that the China and United States are on the development track and that they completed the phase one agreement. 


Daily Support and Resistance


S3 1472.23

S2 1480.87

S1 1485.48

Pivot Point 1489.51

R1 1494.12

R2 1498.15

R3 1506.79

XAU/USD– Trading Tips

The precious metal gold prices remain to trade in the old range of 1,496 – 1,488. On the 4 hour chart, gold has formed an ascending triangle, which is extending substantial resistance at 1,495. Therefore, consider lingering bearish below 1,492 level to target 1,488 and 1,482. 


EUR/USD – Daily Analysis

The EUR/USD currency pair hit the longest weekly rally since July 2018; the pair surged 1.22% last week. Having recovered by 0.54% and 0.33% in the previous two weeks. It should be noted that the reason behind last week’s bullish trends could be Brexit optimism headline and the resulting rally in the GBP.

At the Brexit front, the United Kingdom Prime Minister Boris Johnson attempted to have a meaningful vote on his Brexit deal on Saturday. Still, the U.K parliament declared an act withholding support until full legislation is passed. So, Prime Minister Boris Johnson requested the European Union for a 3-months delay.

It should also be noted that the German Producer Price Index is scheduled to release at 06:00 GMT, and the Bundesbank’s monthly report is scheduled to release at 10:00 GMT. The EUR currency could face bearish pressure if the September PPI figures well below the forecast of -0.1% month-on-month, supporting slowdown fears. 

The shared currency may hit the bearish track if the European Union takes revenge in the return of the United States’ decision to impose tariffs on $7.5 billion worth of European imports.


Daily Support and Resistance


S3 1.1035

S2 1.1094

S1 1.1133

Pivot Point 1.1153

R1 1.1192

R2 1.1212

R3 1.1271

EUR/USD – Trading Tips

The bullish engulfing candle above 1.1100 level leads the EUR/USD pair towards the 1.116 level. The RSI and MACD are still showing a buying trend, but the pair may dispense some retracement until 1.1140 before showing a further bullish trend. 

Consider staying bullish over 1.1153 level today to target 1.1160 on the higher side.


GBP/USD – Daily Analysis

The GBP/USD currency pair flashing red and representing 0.46% losses on the day, by the way, the GBP/USD currency pair currently trading at 1.2914. Additionally, the GBP currency could come under pressure further according to the forecasted by the options markets.

The GBP/USD currency pair options market is down on GBP currency since April. Moreover, the investors are adding bets for a decline in the Pound currency due to fading Brexit optimism.

One-month risk reversal (GBP1MRR), a gauge of calls to puts on the GBP fell by -1.70 on Friday, but it is currently found at -1.65. Friday’s figures were the weakest level in 6-months. On the positive note, the gauge had surged to a 21-month top of 0.125 on October 11.

The decline from October 11 high of 0.125 to October 17 low of -1.70 hints the investors were anticipating the United Kingdom parliament to put obstacles on Prime Minister Boris Johnson Brexit’s agreement.

As we know, the Super Saturday burned all the expectations due to the U.K parliament declared an act withholding support until full legislation is passed. Meanwhile, Prime Minister Boris Johnson requested the European Union for a 3-months delay.


Daily Support and Resistance

S3 1.2635

S2 1.2784

S1 1.2876

Pivot Point 1.2932

R1 1.3025

R2 1.3081

R3 1.3229

GBP/USD – Trading Tips

The GBP/USD is trading sharply bullish above but within a bullish channel. The bullish channel is giving support around 1.2900 level. The GBP/USD has formed a test bar pattern on the 4-hour chart, which is suggesting a bullish trend in the Cable.

The next support stays at 1.2900, and resistance is likely to remain at 1.3050 today. Consider staying bullish above 1.2932 today. 

All the best!  


Categories
Forex Market Analysis

Daily FX Brief, October 17 – Major Trade Setups – Philly Fed Index In Focus!

The I.C.E. U.S. Dollar Index slipped 0.1% on the day to 98.31. Later today, the Federal Reserve will release its latest economic report, the Beige Book.

The British Pound resumed its rally amid growing Brexit deal optimism, surging 1.2% to $1.2760, the highest level since May 16. It was reported that the U.K. and European Union negotiators would present a draft Brexit deal to national delegations later today. On the other hand, official data showed that U.K.’s jobless rate rose to 3.9% in the three months to August (3.8% expected). September C.P.I. will be reported later today (+1.8% on-year expected).

The Euro edged up 0.1% to $1.1034. The Z.E.W. German Current Situation Index dropped to -25.3 in October (-23.6 expected, -19.9 in September), the lowest level since April 2010. USD/JPY climbed 0.4% to 108.81.

Economic Events to Watch Today

Let’s took at these fundamentals.


XAU/USD– Daily Analysis

the safe-haven metal prices dropped despite the U.S.S. weak retail sales data and hinted the higher possibility of a rate cut from the Federal Reserve.

Data showed retail sales in the United States dropped by 0.3% during September, their highest decline since last November.

According to forecasting, investors are now expecting an 88.7% probability of a 25 basis-points rate cut at the Federal Reserve policy meeting at the end of the month.

Brexit progress still under the eyes. The report came from B.B.C. official that the United Kingdom and the European Union will not declare the deal on Brexit today. News from other sources said that the deal could still be announced at the end of this week.

Fresh U.S.-China tensions due to Hong Kong received some attention this week but failed to boost gold prices today.


Daily Support and Resistance    

S3 1457.17

S2 1471.83

S1 1481.27

Pivot Point 1486.49

R1 1495.93

R2 1501.15

R3 1515.81

XAU/USD– Trading Tips

The precious metal gold hasn’t improved much in the past several days since it succeeded in holding under 1,497 handle. Neutral sentiment appears sturdy enough to hold gold within 1,492 – 1,477 range. 

Traders may retain selling trades under 1,494 area today. In the case of a bullish violation of 1,492, the market may witness gold flying towards 1,497 area.


EUR/USD – Daily Analysis

The EUR/USD currency pair failed to cross the critical resistance level and still hold below the 1.1085/90 level, despite benefiting from the sluggish U.S. data and change in European Central Bank policy maker’s bias. As of writing, the currency pair is currently trading at 1.1077.

Meanwhile, the U.S. Dollar Index took further disappointment, in terms of September month Retail sales, that sent the pair down to fresh 7-week low on Wednesday.

On the other hand, the policymakers of the European Union continue to struggling to declare a final Brexit deal with the United Kingdom and extended the discussions to Thursday before holding the 2-day European Union summit. The British policymakers didn’t get the support of the Democratic Unionist Party (D.U.P.) so far in the wake of the deal that could be agreed with the European Union.

Risk sentiment in the market is downbeat due to the difficulties between the United States and China trade deal and Brexit uncertainty with the stocks and bonds in Asia.

Whereas the Brexit is the leading cause for the pair movement and the market right now, moreover, the 2nd data from the United States and Federal reserve coming talks will likely entertaining traders.


Daily Support and Resistance

S3 1.0934

S2 1.0998

S1 1.1036

Pivot Point 1.1061

R1 1.11

R2 1.1124

R3 1.1188

EUR/USD – Trading Tips

The EUR/USD continues trading in the sideways range of 1.1020 – 1.1070. Lately, the pair violated the horizontal resistance level of 1.1050, which is likely to push the EUR/USD pair towards 1.1100 today. 

Taking a look at the 4-hour chart, the EUR/USD is rising in an upward channel. The bullish channel is extending support at 1.100, but before this, the previously violated figure of 1.1050 can extend bullish rally until 1.1100. Consider staying bullish above 1.1061 today.


GBP/USD – Daily Analysis

The cable pair consolidating in the narrow range below five-months highs The GBP/USD currency pair hit the highest level of 1.2800 since May from the intraday declines of the 1.2655 area on Wednesday, mainly due to positive Brexit headlines. 

The British Pound was additionally depressed by the report in which said that the technical Brexit discussions have stuck in the obstacle, and the Brexit deal seems impossible until the United Kingdom moves. Meanwhile, the Wednesday disappointment from the new consumer numbers left a little impact on the pair intraday two-way price swings.

On the final notes, the statement came from the French President Macron, that Brexit deal was on the last track, provided substantial relief to the GBP buyers. Moreover, the German Chancellor Angela Market also said that the Brexit discussions are now at the end of the story and gave further support to the GBP.


Daily Support and Resistance

 S3 1.2341

S2 1.2563

S1 1.2691

Pivot Point 1.2785

R1 1.2913

R2 1.3006

R3 1.3228

GBP/USD – Trading Tips

The GBP/USD currency pair raised a little from the daily highs and now looks like that the pair entered in the phase of consolidation. That is seemingly caused by the investors avoiding from putting any further bullish bets due to the crucial European Council Summit, starting from today, which will finally decide the United Kingdom will leave the European Union with a deal or not on October 31.

The GBP/USD is testing the firm resistance market of 1.285 and also have formed bearish candles followed by a strong bullish trend. This can drive bearish movement in the market. Therefore, consider the trend bearish below1.2860 mark, and the GBP/USD can stay bearish until 1.2754 and 1.2736 areas.

All the best!  


Categories
Forex Market Analysis

Daily FX Brief, October 16 – Major Trade Setups – Brace for Price Action CPI & Retail Sales!

The ICE U.S. Dollar Index slipped 0.1% on the day to 98.31. Later today, the Federal Reserve will release its latest economic report, the Beige Book.

The British pound resumed its rally amid growing Brexit deal optimism, surging 1.2% to $1.2760, the highest level since May 16. It was reported that the U.K. and European Union negotiators would present a draft Brexit deal to national delegations later today. On the other hand, official data showed that U.K.’s jobless rate rose to 3.9% in the three months to August (3.8% expected). September CPI will be reported later today (+1.8% on-year expected).

The euro edged up 0.1% to $1.1034. The ZEW German Current Situation Index dropped to -25.3 in October (-23.6 expected, -19.9 in September), the lowest level since April 2010. USD/JPY climbed 0.4% to 108.81.

Economic Events to Watch Today

Let’s took at these fundamentals.


XAU/USD– Daily Analysis

The safe-haven metal prices flashing green as traders priced in the latest news regarding Brexit and Sino-US trade worries. The Sino-U.S. trade tensions once again escalated, as China now wants the United States to reduce tariff before singing the purchase of $50 billion of American agriculture products under the round one trade deal touted by the U.S. President Donald Trump.

Brexit negotiations between the United Kingdom and the European Union are reaching a decisive stage. Reports came that a deal between the two sides may be near, but it was still unclear if London could avoid delaying its departure, which is due on October 31.

The United States will not go ahead with the hike in tariffs on nearly $250 billion of Chinese products from 25% to 30%, which is often indicative. Trump and Xi are due to meet in the interests of the APEC conference next November. The mid-December tariff on approximately $160 billion of Chinese products, is what is presently a crucial decision for both nations. 


Daily Support and Resistance

    S3 1443.07

S2 1464.37

S1 1472.78

Pivot Point 1485.67

R1 1494.08

R2 1506.97

R3 1528.27

XAU/USD– Trading Tips

Gold continues to exhibit choppy trading in a small area of 1,487 – 1,477. A bullish breakout of 1,487 can extend buying until 1,494 level whereas, the bearish breakout of 1,477 level is likely to continue selling until 1,464 level. 


EUR/USD – Daily Analysis

The EUR/USD currency pair trading above the 50-day moving average for the 3rd consecutive day and failed to hit the critical level resistance level of 1.1075 despite Brexit optimism.

As of writing, the currency pair is currently trading near 1.1030, found on the bearish track on the day in the wake of U.S. monthly retail sales data. By the way, the 50-day Moving Average is now located at 1.1038.

The shared currency rose from 1.0991 on Tuesday, strengthening the bullish breakout. The bullish bias was hinted by Friday’s bullish breakout, a trendline connecting June 25 and August 13 highs. However, the pair took a buying trend, possibly due to the news of the United Kingdom, and the European Union is closing on a Brexit deal.

At the Brexit front, the Brititan Prime Minister Boris Johnson needs the excellent support of Democratic Unionist Parties to pass the Brexit agreement in Parliament.

However, the Democratic Unionist Party is playing rough. The party’s leader has dismissed the statement that it has agreed to support such agreement wherein Northern Ireland will stay in the United Kingdom customs area but adhere to the Europan Union customs rules on tariffs.

The United States retail sales data is scheduled to release at12:30 GMT, is expected to show the retail sales growth slowed to 0.3% in September from August’s reading of 0.4%. Sluggish data will support the dovish Federal Reserve expectations and probably will start the selling trend in the greenback.


Daily Support and Resistance

    S3 1.091

S2 1.0972

S1 1.1005

Pivot Point 1.1034

R1 1.1067

R2 1.1096

R3 1.1158

EUR/USD – Trading Tips

The EUR/USD trade in the restricted range of 1.1020 – 1.1060. The Euro has violated descending trend line resistance, making it weaker against the greenback since late June. That’s suggesting a correction higher is forthcoming.  

On the 4-hour chart above, the EUR/USD is mounting in a bullish channel, which is supporting the pair above 1.1000 level. The daily resistance stays at 1.1050. Consider staying bullish above 1.1030 level to target 1.1050 and 1.1070. On the flip side, the pair can remain bearish below 1.1030 until 1.0976 and 1.0856. 


GBP/USD – Daily Analysis

The GBP/USD currency pair has crossed the level above its 200-day Moving Average resistance for the first time since May 13. Probably, the pair will further increase if Britain’s Prime Minister Boris Johnson gets the support of the Democratic Unionist Party for the approval of the Brexit agreement in the Parliament.

Whereas the Europan Union (E.U.) and the United Kingdom are closing on Brexit agreement, the Democratic Unionist Party is still aggressive. Nevertheless, the Democratic Unionist Party is playing rough. The party’s leader Arlene Foster has dismissed the statement that it has agreed to support such agreement wherein Northern Ireland will stay in the United Kingdom customs area but adhere to the Europan Union customs rules on tariffs.

We all want to make this deal, but it must be a deal in which you have to consider the economic and legal integrity of the British, and that means the whole United Kingdom, included Northern Ireland.

It should also be noted that the Democratic Unionist Party ten lawmakers will play a key role in deciding that the Prime Minster Boris Johnson can pass any agreement in Parliament or not.

The GBP could come under pressure if Boris Johnson does not succeed in getting support from the Democratic Unionist Party. In consequence, the GBP/USD currency pair may drop to the level below the 200-day Moving Average, presently trading at 1.2710.

On the other hand, the cable pair may also take fresh hints from the United Kingdom Consumer Price Index, which is scheduled to release at 08:30 GMT.


Daily Support and Resistance


S3 1.199

S2 1.2289

S1 1.2469

Pivot Point 1.2588

R1 1.2768

R2 1.2887

R3 1.3185

GBP/USD – Trading Tips

Technically, the GBP/USD extends to trade upward on the back of a more solid Sterling. The pair have achieved a 38.2% Fibonacci level at 1.2692 and now trading over this level, scanning for a substantial fundamental reason to define the next movement.  

On the upper side, the GBP/USD is expected to meet resistance around 1.2800. Breakout 1.2800 can trigger more buying until 1.12849. Let’s keep an eye on 1.2695 now to take quick trade opportunities.

All the best!  

Categories
Forex Market Analysis Forex Signals

Gold Steady Below 50 EMA – Brace for a Breakout! 

Gold prices trade sideways in a narrow trading range of 1,495 – 1,490 as expectations of improvement in U.S-China trade discussions were moderated and ahead of a summit that will decide how Britain departs the European Union.

Technically, the precious metal gold is facing stiff resistance at 1,495. The 50 periods EMA and double top pattern are keeping the XAU/USD bearish below this level.


The formation of a series of Doji and Spinning Top candles is suggesting a weaker number of bulls in the market. Typically such pattern drives the bearish trends in the market.

The MACD and Stochastics are tossing in red and green territory, suggesting neutral bias among traders. Continuation of a bearish trend can trigger sell-off until 1,485.

Trade Setup 

Entry – Sell below 1,495

Take Profit – 1,484

Stop Loss – 1,498

All the best!

Categories
Forex Market Analysis

Daily FX Brief, October 15 – Major Trade Setups – Investors Back from Holiday! 

The U.S. dollar stabilized on Monday, with the ICE Dollar Index edging up 0.1% on the day to 98.46.

The euro slipped 0.1% to $1.1027, halting a three-day rally. Official data showed that the eurozone industrial production grew 0.4% on month in August (+0.3% expected). Later today, the ZEW German Current Situation Index for October will be reported (-23.6 expected, -19.9 in September).

The British Pound retreated 0.3% to $1.2609, following a surge of more than 3.0% in the prior two sessions. Finnish Prime Minister Antti Rinne told reporters that he does not think it would be possible for the European Union and the U.K. to agree on the terms of a Brexit deal in time for the summit of leaders starting Thursday. Meanwhile, U.K.’s jobless rate for the three-month to August will be released later today (steady at 3.8% expected).

Economic Events to Watch Today

Let’s took at these fundamentals.


XAU/USD– Daily Analysis

The safe-haven metal prices rose but still below the key level of $1500 due to fresh uncertainty between the United States and China trade talks. The U.S. gold futures for December delivery inched up 0.2% to $1,499.02 during the Asian session before taking a bearish turn ahead of the European session.

The gold prices recovered as China now wants to do more trade discussions before signing the critical phase one trade deal. The Chinese attitude appeared to contradict the U.S. President’s contention on Friday that both nations were very close to making a deal.

Besides, China wants Trump to finish the scheduled tariff hike in December. Treasury Secretary Steven Mnuchin announced CNBC in an interview that he anticipates that both nations couldn’t reach on the deal due to the December hike.


Daily Support and Resistance

S3 1430.45

S2 1459.63

S1 1474.37

Pivot Point 1488.82

R1 1503.56

R2 1518

R3 1547.19

XAU/USD– Trading Tips

Gold has also exhibited choppy trading in a narrow range of 1,497 – 1,489. A bullish breakout of 1,496 can extend buying until 1,502 level whereas, the bearish breakout of 1,489 level is likely to continue selling until 1,481 level and 1,474. Today 1,494 is a crucial level to focus, as gold can stay bearish below this and bullish above this level.


EUR/USD – Daily Analysis

The EUR/USD currency pair found on the Doji candlestick pattern which indicates traders’ indecision. The EUR/USD currency pair hit a high and low of 1.1043 and 1.1013, and the trading area remained the same as it was on Friday. The EUR/USD continues to maintain a sideways range of 1.1063 and 1.1001. 

At the German Zew Survey front, Economic Sentiment (Oct), which is scheduled to release at 09:00 GMT, is anticipated to print at -27.3 against-22.5 in September. Whereas, the current is expected to come in at -26, marking a deterioration from September’s -19.9 reading. 

Upbeat expectations may get a strong buying trend in the shared currency. However, a bullish daily close could remain elusive If the markets turn risk-averse due to the negative China producer price index data, which was released in the Asian trading hours.


Daily Support and Resistance


S3 1.091

S2 1.0972

S1 1.1005

Pivot Point 1.1034

R1 1.1067

R2 1.1096

R3 1.1158

EUR/USD – Trading Tips

The EUR/USD currency pair trading sideways in tight trading limits of 1.1043 and 1.1001. A close above 1.1043 would suggest a resumption of the rally from fresh lows around 1.0879. Conversely, a close below Monday’s low of 1.1043 would mean an end of the recovery rally.

An upward channel of the EUR/USD is still intact, and the major currency pair continues to trade within this range of 1.1043 and 1.1001. Consider taking buying positions over 1.100 level to target 1.1050 and 1.1070. On the flip side, bearish bias can be seen under 1.1000 until 1.0976 and 1.0856. 


GBP/USD – Daily Analysis

The GBP/USD currency pair got to the highest level since January 2018. The investors are expecting Brexit breakthrough and continuing bets to position for a rally in Pound.

As of writing, the GBP/USD currency pair is currently trading at 1.2618, found on the highest track on the day. 

One-month risk reversals (GBP1MRR), a gauge of calls to puts on the GBP, increased above zero on Friday and currently stands at 0.25, the highest level in 21 months.

The possibilities of Britain securing an orderly departure from the Europan Union have lost during this week due to the comments by the Finlands Prime Minister that time has finished.

However, the GBP currency could continue its bullish momentum as there are some renewed sentiments regarding anther Brexit summit, most probably at the end of this month.

Additionally, the British Pound may get buyings if the United Average Earnings (Aug) releases against past expectations. The data is scheduled to release at 08:30 GMT.

On the negative note, if the data release against the expectation and if any negative news comes concerning Brexit, then the GBP/USD currency pair could hit the bearish track sharply. 


Daily Support and Resistance


S3 1.199

S2 1.2289

S1 1.2469

Pivot Point 1.2588

R1 1.2768

R2 1.2887

R3 1.3185

GBP/USD – Trading Tips

Technically, the GBP/USD continues to trade bullish in the wake of a stronger Sterling. The pair has completed 38.2% Fibonacci level at 1.2592 and now holding above this level, looking for a solid fundamental reason to determine the next movement.  

On the upper side, the GBP/USD is likely to face strong double top resistance around 1.2700. Breakout 1.2700 can trigger further buying until 1.12759. Let’s keep an eye on 1.2588 now to take quick trade opportunities.

All the best!  
Categories
Forex Market Analysis

Gold Trades Ascending Triangle – Brace for a Breakout!

On Wednesday, the precious metal gold prices trade sideways in a narrow trading range of 1,512 – 1500 in the wake of mixed economic events. Moreover, the uncertainties encompassing the United States and China trade war and dark Brexit headlines depressed investors’ sentiment. The gold futures for December delivery gained 0.5% to $1,511.83 at the start of the European session.

A report came from South China that China stepped back from the high-level trade talks between the United States and China. The report said the Chinese delegation might enter in Washington a day earlier than scheduled.

China also gave warning that they would hit back after the United States blacklisted a list of Chinese tech companies in the wake of China treatment with Muslim minorities, which ultimately threats increased incoming talks between the United States and China.

On the Brexit front, German Chancellor Angela Merkel told Boris Johnson, U.K.’s Prime Minister, that Northern Ireland has to continue being part of the customs union in any deal, which Johnson said has paved the way for a no-deal Brexit.

Gold – Technical Outlook

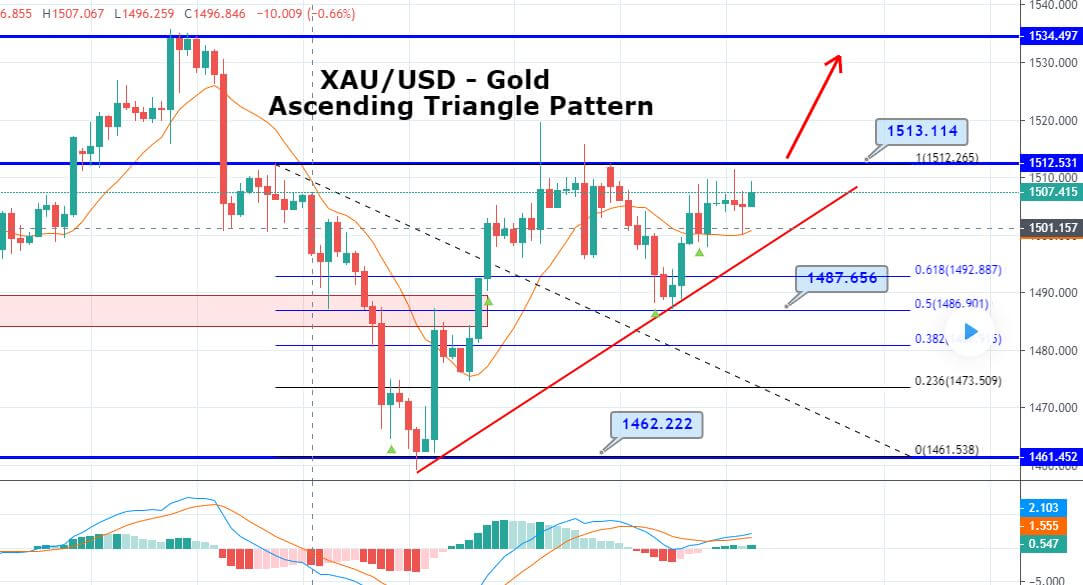
Technically, the XAU/USD has formed an ascending triangle pattern, which is keeping gold steady below 1,512 resistance level. The ascending triangle pattern is extending support at 1,500 level.
Typically, these ascending triangle patterns break out on the upper side and may extend bullish rally up to 1,534 in a medium run.

Daily Support and Resistance
S3 1459.04
S2 1480.2
S1 1492.88
Pivot Point 1501.36
R1 1514.04
R2 1522.52
R3 1543.68

Consider taking a buying position on the bullish breakout of 1,513 to target 1,525 and 1,530.

All the best!

Categories
Forex Market Analysis Forex Signals

Choppy Sessions in Gold – Brace for a Quick Breakout!

The safe-haven metal gold prices consolidate in the narrow range of $1,508.60 and $1,497 at the start of this week. The lack of volatility in the market was mostly due to the national holidays in China.  

However, the precious metal gold prices slipped later during the European session as the dollar rallied after a report stated China was unwilling to consent to a broad trade deal with Washington. The bullion traded in a tight range as investors adopted a wait-and-see strategy before U.S.-China discussions this week.

As we know, it was all about the United States employment data, which is disappointing, and jobless rate prints a low of 3.5% during September, from 3.7% in August. The United States and Chinese trades are ready to start again this week. However, the Sentiment regarding trade war negotiations is not right.

Looking ahead into the fundamentals, some other key events are under the spotlight, including Federal Reserve chairman Powell’s speech, the FOMC minutes, and the United States Consumer Prices Index.

On the technical side, the gold prices started a day with a Doji candlestick on the charts and having the prices ending above the $1500 psychological level again. 

The technical side of the market seems pretty clear as investor’s are consistently testing 1,497 support area. The violation of this level could extend the bearish trend until 1,492 and 1,487. 

At the same level, we got the 50 periods EMA, which is also extending support at 1,497 zones. 

The leading indicator, such as MACD and RSI, are holding staying in the neutral zone, suggesting indecision among traders today. 


Daily Support and Resistance

S3 1465.24

S2 1485.38

S1 1495.05

Pivot Point 1505.52

R1 1515.19

R2 1525.66

R3 1545.8

I would rather stay out of the market until we have clear direction about the market and clear path means either the bearish breakout of 1,497 or bullish candles closing above the same level.

Categories
Forex Market Analysis

July 2 – Daily Update on S&P500 & Gold – NFP Week Begins

On the first day of the 3rd quarter, the financial markets remained heavily volatile in the wake of trade war sentiments. For instance, gold slid more than 1% to its lowest ahead of the U.S. holiday, as the dollar recovered. Whereas, the indices inducing SPX, DAX and Nikkei plunged due to ongoing U.S.-European Union trade war. In addition to this, the July 6 trade war tensions have helped the risk sentiment to stay off.  


Later this week, we have another series of high impact economic events coming out of the market. Let’s take a quick look.


Top Economic Events to Trade

AUD – Building Approvals m/m – 1:30 (GMT)

AUD – RBA Rate Statement – 4:30 (GMT)

AUD – Cash Rate – 4:30 (GMT)

GBP – Construction PMI – 8:30 (GMT)


Gold – XAU/USD – Daily Outlook

The precious metal gold is trading at 1242, down 11.60 points and 0.92% on Monday. One of the main reasons behind the bearish trend is the stronger dollar.


The greenback continued its ascent as traders boosted their bets that the U.S. administration would prove better in a trade war as compared to some of its trading rivals. The U.S. tariffs on $34 billion worth of Chinese imported goods are due for July 6.


Support     Resistance 

1240.83    1247.17

1238.87    1249.13

1235.7    1252.3

Key Trading Level:    1244


SPX  – S&P500-  Technical Outlook

SPX is trading bullish at 2727, up 5.75 points and 0.21%. On the 4- hour chart, the bullish trendline is extending a support near 2679. While the resistance predominates at 2732 and 2745 today. The main trend is up as per the daily swing chart. But, momentum is trending lower. A trade through 2679.25 will convert the main trend (bullish) into the bearish bias.


Overall, the main trading range of SPX is 2595 to 2796. The index is currently testing the upper or 50% level of this range at 2795.75.


Support     Resistance 

2705.72    2719.32

2701.52    2723.52

2694.72    2730.32

Key Trading Level:    2712.52
Categories
Forex Market Analysis

June 29 – Technical Update on S&P500 & Gold – U.S. GDP Disappoints

The financial markets remained heavily volatile due to a series of market-moving economic events like the German CPI and U.S. Final GDP.  Well, the game isn’t over yet. We have another series of high impact economic events coming out of the market on Friday. Let’s take a quick look.


Top Economic Events to Trade

  • EUR – German Retail Sales m/m – 6:00 (GMT)
  • GBP – Current Account – 8:30 (GMT)
  • GBP – Final GDP q/q – 8:30 (GMT)
  • EUR – CPI Flash Estimate y/y – 9:00 (GMT)    
  • CAD – GDP m/m – 12:30 (GMT)
  • USD –  Chicago PMI – 13:45 (GMT)


Although there are lot more economic events due to be released, these are the most important ones and may help you capture a nice amount of pips.     


Gold – XAU/USD – Daily Outlook

On Thursday, gold plunged to its weakest level in six months to trade at $1,247. Most of the selling came in response to escalating pressure from the trade war and the sentiments of higher U.S. interest rates which continues to weigh on gold. Nevertheless, we can expect a modest reversal in the near term. Price action is expected to retrace the decays back to 1263, the same level which earlier served as support.


Support     Resistance 

1252.5    1259.76

1250.26    1262

1246.63    1265.63

Key Trading Level:    1256.13


SPX – S&P 500 – Technical Outlook

SPX is trading bullish near 2718 after gaining support above 2694. On the 4- hour chart, the upward trendline is also extending support near 2679. While the resistance prevails at 2732 and 2745 today, the main trend is up as per the daily swing chart, but, momentum is trending lower. A trade through 2679.25 will convert the main trend (bullish) into the bearish bias.


Overall, the main trading range of SPX is 2595 to 2796. The index is currently testing the upper or 50% level of this range at 2795.75.


Support     Resistance 

2697.19    2732.87

2686.16    2743.9

2668.32    2761.74

Key Trading Level:    2715.03


Categories
Forex Market Analysis

June 28 – Technical Update on S&P500 & Gold – Trade War Tension Eased

It was quite a busy day with series of economic events from global economies. The greenback advanced as trade-related tensions eased after the U.S. administration relaxed its approach to Chinese investment. Most of its buying came on the Euro and the Swiss Franc. Whereas, gold prices hovered on top of 6 months lows as traders continuing to shun the yellow-metal despite signs of a reversal in risk sentiment. The robust greenback continues to keep a lid on the precious metals bullish trend.


S&P 500 – Daily Outlook

The New York stock market index  SPX is trading at 2706, down -22.75 points and -0.82%. S&P500 is facing a strong support near 2700, a double bottom level. The violation of 2700 can lead SPX towards 2679. The moving averages are suggesting a bearish bias of investors. The RSI and Stochastics have entered the oversold zone. Let’s see if SPX gets a chance to pull back above 2700.


Support     Resistance 

2706        2735.56

2696.86     2744.7

2682.08     2759.48

Key Trading Level:    2720.78


Gold – XAU/USD – Daily Outlook


Gold traded in a tight range of 1252 – 1261, troubled to manoeuvre off session lows because the greenback remained supported despite a small reversal in intraday risk sentiment, helping safe-haven currencies trim their losses against the dollar.


Technical indicators signal gold will continue to drop. For instance, gold has already violated the 1252 support level which is likely to work as a resistance now. Moreover, the moving averages also suggest a bearish bias of traders.


Support     Resistance 

1256.9    1266.84

1253.84    1269.9

1248.87    1274.87

Key Trading Level:    1261.87


Investors are advised to monitor the U.S. Final GDP q/q in order to capture further movements in the dollar index, gold, and the U.S. stocks.

Categories
Forex Market Analysis

June 25 – Quick Technical Update on S&P500 & Gold

The U.S. stocks sank during a broad sell-off on Monday, with the S&P 500 dropping over 1.5 %. In particular, the technology companies bearing the strength of an escalating trade dispute between the U.S.  and different leading economies.


The U.S. Treasury was drafting curbs that may block companies with a minimum of 25% Chinese possession from purchasing  U.S. technology companies. In response, the dollar plunged to a two-week low against the yen as a rise in the global trade worries depressed investor risk appetites and turned down U.S. yields.


S&P 500 – Daily Outlook

The U.S. stock market index SPX is trading at 2709.02, down 45.25 points and 1.67%. S&P500 is facing a strong support near 2700 after falling 1.59% today. We can expect a pullback above 2700, whereas the violation of this level will lead SPX -1.66% towards 2685.


S&P500- Intraday Support & Resistance Levels 

Support     Resistance 

2745.54      2769.84

2738.04      2777.34

2725.89      2789.49

Key Trading Level:    2757.69


Gold – XAU/USD – Daily Outlook

The precious metal gold is trading bearish at 1267.57, down -0.17% on Monday. Technically, Gold is trading sideways with a lower range of 1264 – 1271. The breakout of this range will define the further trend of gold. The breakout above 1271 can lead gold prices towards 1275 while a breakout below 1265 will open further room for buying until 1261.


Gold- Intraday Support & Resistance Levels 

Support     Resistance 

1271.5     1273.64

1270.84    1274.3

1269.77    1275.37

Key Trading Level:    1272.57

That’s pretty much it for now. Investors are advised to monitor the U.S. CB Consumer Confidence in order to capture further movements in the dollar index, gold, and the U.S. stocks.