Categories
Forex Assets

What Should You Know About AUD/USD Forex Pair

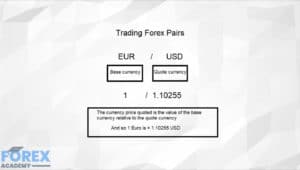
Firstly, the abbreviation of the AUDUSD currency pair is the Australian dollar and the US dollar. AUDUSD is a major currency pair. It is considered a major pair because it is AUD is paired with the US dollar, and also, this is one of the pairs where a huge volume of trading takes place. In AUDUSD, AUD is the base currency, and USD is the quote currency.

Understanding AUD/USD

The exchange value of AUDUSD represents the units of USD equivalent to one unit of AUD. In technical terms, it is the value of AUD against USD. For example, if the current market price of AUDUSD is 0.6960, then it means that it takes 0.6960 US dollars to buy 1 Australian dollar. Trading the AUDUSD currency pair is basically trading the Aussie (Australian dollar).

AUD/USD Specification
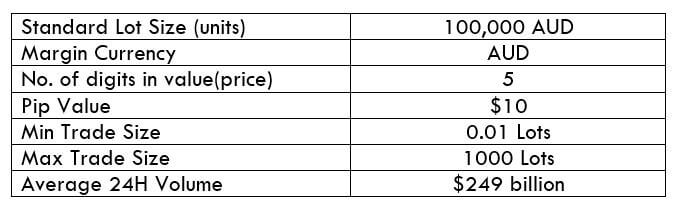
Spread

Spread is the difference between the bid price and the ask price. The spread usually varies based on account type. The spread on an ECN account and an STP account is as follows:

ECN: 0.7 | STP: 1.4

Fee

There is charged by brokers for every trade a trader takes. However, this depends on the type of forex account. Typically there is a fee in ECN accounts and zero-fee in STP accounts. Also, there is no exact value of fee on a single trade, as it differs from broker to broker.

Slippage

Slippage is the difference between the trader’s requested price and the real executed price. Slippage happens when the volatility of the market is quite high. It happens for market orders. Slippage can be in favor of the trader or against him. If entering and closing of the trade is done by market execution, then slippage happens twice. The slippage is usually between 0.5 and 3 pips. However, it depends on the broker’s execution speed as well.

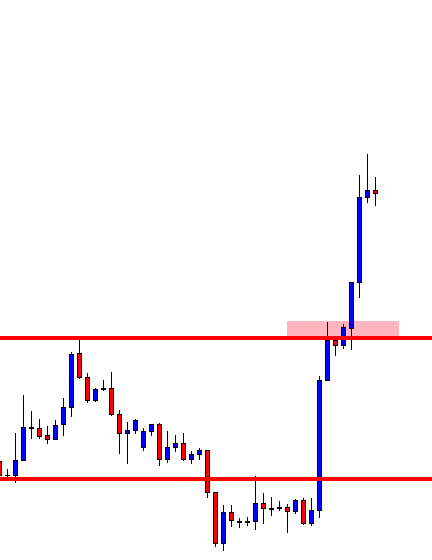
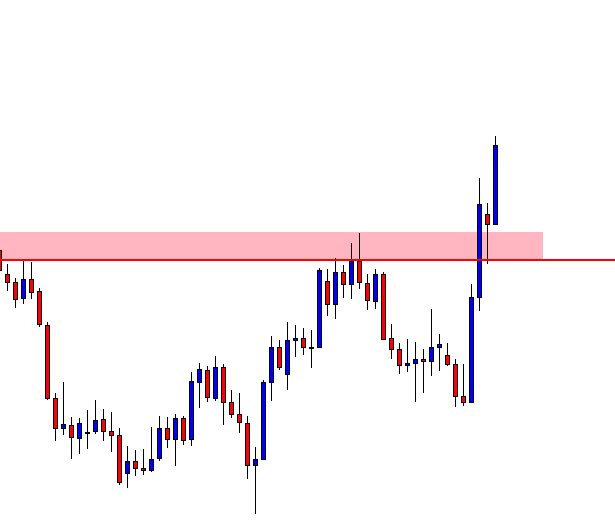
Trading Range in AUD/USD

There are several timeframes to trade this currency pair. A day trader may pick the 1H, 4H, or the 1D timeframe, while a positional trader may opt for the weekly or the monthly. Apart from analyzing these timeframes, it is also necessary to know the volatility range in each of the timeframes. Knowing the pip movement range in each timeframe, one can assess their risk involved in each trade.

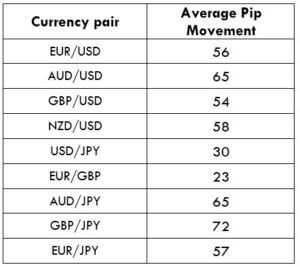
Below is the table, which represents the minimum, average, and maximum pip movement in each timeframe.

Note: The below values are an approximation from the Average True Range (ATR) indicator.

AUD/USD PIP RANGES 

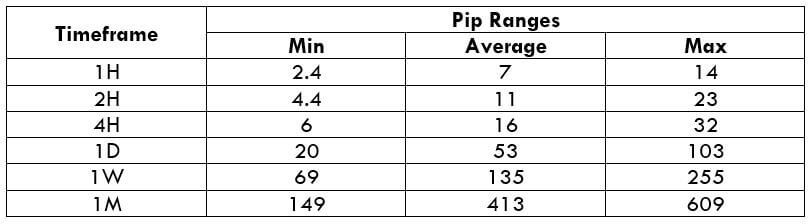
Procedure to assess Pip Ranges

  1. Add the ATR indicator to your chart
  2. Set the period to 1
  3. Add a 200-period SMA to this indicator
  4. Shrink the chart so you can assess a large time period
  5. Select your desired timeframe
  6. Measure the floor level and set this value as the min
  7. Measure the level of the 200-period SMA and set this as the average
  8. Measure the peak levels and set this as Max.
GBP/USD Cost as a Percent of the Trading Range

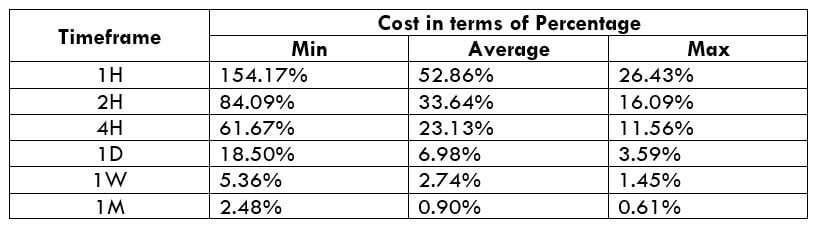
This is where the above values are put into play. By considering the volatility range in each timeframe, the cost (fee) for a single trade is measured in terms of a percentage for every mentioned timeframe. The basic idea to this is that the higher the percentage value, the higher is the cost of the trade.

The cost is calculated by considering three variables, namely, slippage, spread, and trading fee. And the sum of these values gives the total cost of each trade.

As mentioned earlier, the cost varies from the type of trading account. So, there will be variation in cost percentages as well.

ECN Model Account

Spread = 0.7 | Slippage = 2 | Trading fee = 1

Total fee = Spread + Slippage + Trading fee = 0.7 + 2 + 1

Total cost = 3.7 (pips)
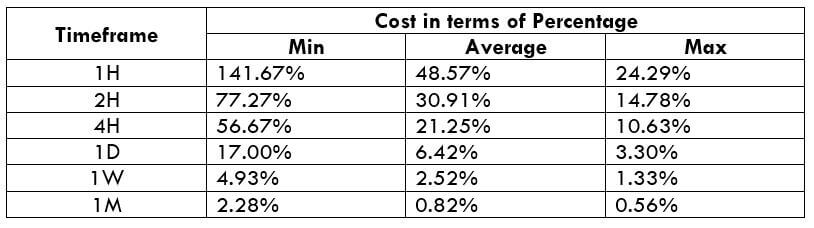
STP Model Account

Spread = 1.4 | Slippage = 2 | Trading fee = 0

Total cost = Slippage + Spread + Trading Fee = 2 + 1.4 + 0

Total cost = 3.4

The Ideal Timeframe to Trade GBP/USD

The first observation that can be made from the above percentage values is that the minimum column has the highest percentages compared to other columns. This means that the cost is pretty high when the volatility of the market is too low irrespective of the timeframe. Contrarily, the costs are significantly less when the volatility of the market is high (max column). However, it is quite risky to trade when the market volatility is high though the fee is less. So, it is ideal during those times of the day when the market volatility is above average.

Note that volatility is not only one which decides on which is the best timeframe and time of the day to trade. The slippage value equally plays an important role, as well. For instance, if the slippage is made nil and the percentages are calculated, it is seen that the ranges drop down considerably. Hence, it is recommended to enter and exit trades using limit orders and not market orders.

Categories
Forex Course

33. Understanding Leverage & Its Relationship With Margin

Leverage

There is a close relationship between the Leverage and Margin. That is, both go hand in hand. In simple terms, the margin is used to create leverage. The meaning of leverage is similar to the margin. It is a facility provided by brokers, which allows a trader to take larger positions by investing a lesser amount than required.

Margin is expressed in percentage, while Leverage is expressed as a ratio

Leverage is the ratio between the capital a trader has in their account to the amount of capital he/she can trade. And this ratio is expressed in the form “X:1,” where X is the amount of leverage.

Expressing Margin in terms of Leverage

If a trader wishes to purchase one mini lot of a currency, they don’t need $1,000 in their account balance. Instead, they will need only a small percentage of the position size. And this percentage is referred to as Margin Requirement.

This same percentage in terms of a ratio is termed as Leverage.

For example, let’s say John wants to buy 100,000 units of USD/CAD. If the Margin Requirement is 1%, John will require only $1,000 to take this trade. That is, the Leverage for this trade would be 100:1.

Calculating the Leverage

Leverage is calculated using the below formula

Leverage = 1 / Margin Requirement

Considering the above the example,

Leverage = 1 / 0.01

Leverage = 100

Hence, the leverage will be 100:1.

Similarly, if the Margin Requirement is 2%, the Leverage will be 50:1.

Conversely, using Leverage, we can obtain the Margin Requirement as well.

Margin Requirement = 1 / Leverage 

For example, if the Leverage is 500:1, the Margin Requirement  = 1 / 500 = 0.002

Hence, the Margin Requirement when Leverage is 500:1 will be 0.002 or 0.2%.

Mostly, Margin and Leverage have an inverse relationship.

Forex Margin and Stock Margin

Forex margin and Stock (Securities) margin are two completely different terms, though both are from the same trading industry.

In the Stock market, the margin is the amount a trader borrows from their broker to purchase a stock. Basically, it is like borrowing funds as a loan from their broker.

Whereas in the Forex market, the meaning of margin is different. Here, as we know, it is the amount of money a trader will have to keep aside with the broker as a deposit to open a margin position.

Hence, to sum it up, we can consider margin either as a loan provided by the brokers or as collateral collected by the respective brokerage firm.

[wp_quiz id=”52027″]
Categories
Forex Psychology

Having the Mindset to Deal with a Frustrating Situation

Patience is one of the most essential components of Forex traders. Traders are to keep patience in every single second. Before triggering an entry, a trader is to find out a trend, key levels, momentum, news events, etc. After all this hard work, he may not be able to take the entry. It is frustrating, but for Forex traders, it is a usual thing. A trader must accept it simply. In today’s lesson, we are going to demonstrate an example of that.

The price heads towards the South; it consolidates and heads towards the North. The price breaches a level of resistance, which the buyers are to keep an eye at for a bullish reversal. Let us proceed to find out how the next chart looks.

The buyers were waiting for the red-marked level to hold the price and produce a bullish reversal. If the level had held the price and pushed the price towards the North breaching the highest high, the buyers would have taken a long entry. They must have waited eagerly, but all went in vain.

The price headed towards the South further and found its support. After finding the support, it heads towards the North again. On its way, it makes a breakout at the highest high of the last bearish wave. The buyers are to keep an eye on this pair again to find a long entry. To take the long entry, the price is to come back at the breakout level, to produce a bullish reversal candle, and to breach the highest high of the last wave.

This time it looks good. A candle closes within the level of support. The buyers are to keep an eye to get a bullish reversal candle first. This means they have to be patient again. Let us proceed to find out what happens next.

The level produced a bullish reversal candle, but it did not breach the highest high. It instead came down and breached the support level. In a word, all efforts have gone in vain. What wastage of time!

                   The Bottom Line

If you want to take trading seriously as a business or a consistent source of income, you must not think that it is a wastage of your time. It is an investment. Traders must be patient and not be frustrated when opportunities are lost or do not come as per expectation. They must deal with it professionally.

The bad thing is it does not come with practice or experience. The good thing is it is all about mindset. Even a beginner may have a mindset to deal with a situation like this, whereas it might frustrate a trader with five years of experience. We must remember that if it frustrates too much, it hurts trading performance.


Categories
Forex Basics Forex Daily Topic

Attributes of the Signal Candle Not to be Ignored

After choosing a pair to trade, traders wait for the signal candle at the desired zone/level to take an entry. The attributes of the signal candle are important. Ideally, a signal candle is to be a Marubozu candle, barely having an upper or lower shadow, and longer than other candles around. In today’s lesson, we are going to show an example of how attributes of a signal candle affect the market. Let us proceed.

The price after being bearish finds its support. A long consolidation suggests that a breakout towards either side makes the chart lively again. An upside breakout and the confirmation offer good risk-reward considering the last swing high. A downside breakout seems even more rewarding. Let us find out which way the breakout takes place.

It is an upside breakout. The breakout candle looks fantastic. Buyers are to wait for consolidation and breakout at the highest high to go long on the pair. However, buyers shall calculate that the last swing high is not too far away now.

The price continues its bullish journey towards the last swing high, and it consolidates. Flipped support is to be adjusted here considering the Inside bar. However, an upper shadow at the previous swing high holds the price as well up to the Inside bar. The last candle comes out from the zone, though. Look at its attributes

  • It is a bullish engulfing candle
  • It breaches the resistance zone
  • It is a Bullish Marubozu candle

Many of us may trigger an entry here by setting Stop Loss below the lowest low of the candle. Let us find out what happens next.

The price comes down again. It may have swept away many Stop Losses. Thus, the last entry gets the buyers loss. What do you think about the last candle?

  • It is a bullish engulfing candle
  • It breaches the resistance zone
  • It is a Bullish Marubozu candle and
  • It breaches the last swing high


Traders may want to trigger an entry here. Let us go to the next chart to see how it goes.

This time it works excellently well. A question may arise here: what the difference is between these two candles?. The only difference that can be observed is, “It breaches the last swing high.”

The Bottom Line

We have demonstrated an example today and learned a lesson. Traders are to be immaculate in making a decision, and they have to calculate every single aspect that is related to the trading decision.


Categories
Forex Videos

Types Of Forex Markets Part 1 – Mastering Your Understanding

Types of Markets Part 1

The foreign exchange market has a daily turnover of over $5 trillion, and which has the largest amount of market participants than any other asset class. The forex market has seen continual growth over the years. But it started evolving into what we have now after the advent of the Bretton Woods system, which was a monetary policy where countries agreed to peg their currencies to the US dollar, and where the United States agreed to redeem all dollars for gold. This system collapsed in 1971, which led to the free-floating of currencies on the free market that we see today.


Forex trading platforms began to emerge in the 1990s. However, it wasn’t until the development of the internet, trading software, and the emergence of forex brokers who offered trading on margin, which started the growth of retail trading in the Forex arena.

Foreign or international currency exchange rates display how much one unit of a currency can be exchanged for another currency. Typically, exchange rates float up or down and where the value of one currency against another is traded based on a multitude of factors, including the strength or weakness of an economy, interest rates, gross domestic product, and political factors, including war. Currencies can also be fixed to another, in which case they still float. However, they move in tandem with the currency to which they are pegged.

All currencies are traded in pairs, and where traders simply look for the strength of one currency against the weakness of another in order to make profitable trades. While this is not the easiest thing to achieve in such a volatile market as foreign exchange, software trading platforms that offer great technical analysis tools, where the study of recurring chart patterns on screens, has completely changed the dynamics of trading within this asset class. And so, technical analysis trading has driven the exponential growth of the Forex market.
The types of people who trade the forex market are hedge funds, asset managers, central banks, sovereign wealth funds, financial institutions including currency speculators, and retail traders who all try to make potential profits from currency fluctuations relating to the global economy.

Example A


In the example ‘A,’ we can see how the Euro is quoted first against the USD because one Euro has a greater value than one US dollar, in which case it is quoted as the base currency against the quote currency. The same applies for all currencies.

Although it is common sense to believe that, for example, a country such as the United States, with all its wealth and power, has a much greater financial foothold over countries such as New Zealand, or Australia and Japan, there is almost an unquantifiable amount of economic variables that formulate the value of one currency against another. And this is why you’ll find one of the idiosyncrasies in the Forex marketplace, where holders of United States dollars might quickly sell those in order to buy the Yen, Australian and New Zealand dollars, simply based on rumors, speculation, and chart patterns. It is because of this that the forex is the most volatile of all asset classes with constant price movement.

Example B


Example ‘B’ is a market watch price board showing many currency pairs and where the fluctuating exchange rates are expressed as bid and ask. If a trailer believes a particular pair is going to go, they will

accept the bid price and execute that rate on their trading terminal, and if they think that the value of the exchange rate is going to go down, or depreciate, they will accept the price as quoted on the ask section of their trading platform

Example C


Example ‘C’ is a screen chart of the USDCAD pair on a four-hour time frame. Traders look for patterns on their screens, such as swing highs and swing lows, in order to try and gauge the strength of one currency against another. And therefore in this chart, we can see that after a swing low the US dollar began strengthening against the Canadian dollar, all the way up to the swing high, where it met some resistance, and then the Canadian dollar began to strengthen against the US dollar as price retreated away from the swing high.

When trading in the currency markets, traders buy one currency and sell the other. In our example, traders began buying the US dollar and selling the Canadian dollar when price moved up and away from the swing low and where this continued all the way up to the swing high.

Traders choose the forex market because there is so much activity. There are many currency pairs, and because the market is often extremely volatile, it presents many trading opportunities. And because of the continual change in the economic circumstances of countries, and the continual newsflow pertaining to economic data, this market has become the most liquid of all asset classes. And because of tight spreads and cheap execution relating to trading within the forex market and the small outlays in capital, which is needed to fund a trading account, it makes absolute sense to consider Forex trading as a great business opportunity.

Categories
Forex Psychology

A Lesson from a Failed Entry

In today’s lesson, we are going to demonstrate an example of a failed entry. We usually explain winning trade setups in our lessons. It teaches us how to win a trade on a setup like that and gives us more confidence as well. We are going to talk about a failed entry, which may hurt our confidence. However, the lesson that it teaches that may help us be a batter trader.

The price heads towards the North with good bullish momentum. Ideally, we shall look for long opportunities here upon consolidation and at a breakout at resistance. Let us find out what happens next.

The price consolidates, but it does not make any breakout. The last candle looks very bearish. The door is open for both the bull and the bear. Traders shall go long on an upside breakout and go short on a downside breakout. Let us find out which way it makes its next breakout.


The price heads towards the downside after making a breakout at support. It is a different ball game now. Traders are to look for short opportunities upon consolidation and downside breakout. Let us proceed to the next chart to find out what happens next.

Here comes the corrective candle. It is an Inside Bar. Thus, to sum up, the whole equation, the price consolidates after being bullish, makes a breakout at the support, the trend continues, produces a corrective candle (an Inside Bar). A bearish engulfing candle closing below the lowest low is the signal to go short here.

This is what I have meant. A bearish engulfing candle forms right after the corrective candle. The candle closes below the support, where the price reacted three times recently. If we consider the momentum of the last bearish candle, that gets ten on ten as well. Let us trigger a short entry.

Oh! The price goes another way round than our expectations. It hits the Stop Loss. We are to encounter a loss here. The first thing we shall do after a losing trade, we shall write all the details about the trade in our journal. If there is anything that we have missed from our trading strategy, we must find that out and write it in our journal.

As far as I am concerned, there is not anything wrong with the entry. It is an entry; I would take ten times out of ten opportunities. I have been working with the strategy for a long time. Thus, I can assure you I would win at least six entries out of those 10. This is the faith that a trader needs to have. A trader must not lose his faith in his proven strategy.

The Bottom Line

Never lose your faith in yourself and in your proven strategy. Do not let a losing trade hurt you psychologically.

Categories
Forex Basics Forex Daily Topic

Stop Loss: An Art to be Learned Well by Traders

Setting Take Profit and Stop loss in the right areas are essential factors in trading. A trader does not survive in the market by placing Stop Loss and Take Profit at the wrong places. In today’s lesson, we are going to demonstrate an example of an entry with the level of Stop Loss and Take Profit.

This is a daily chart. The price heads towards the North with good bullish momentum. The buyers are to look for long opportunities at the pullback. Let us wait for the price to make a pullback.

The price starts having a downside correction with an Inside Bar. It produces two more candles that are bearish. After that, it forms a Spinning Top right at a flipped support. This is a bullish reversal candle but not a strong one. A breakout at the top of the Spinning Top attracts the minor charts’ buyers to go long on the pair. However, major charts’ traders may want to wait for a stronger daily bullish reversal candle.

The next candle comes out as an Engulfing candle. This reversal candle attracts more traders to look for long opportunities here. Since it has not made an upside breakout, thus, to take an entry, traders shall flip over to the H4 chart.

This is the H4 chart. The price has a rejection at the red marked level on the daily chart. Thus, this is the level where the price may find its resistance on the H4 chart. This shall be the level to count in setting Take Profit. The H4 chart shows that the price starts having a pullback. Things are getting better for the buyers.

Let us draw the resistance. If the price consolidates and makes a breakout at the black marked level, a long entry may be triggered. However, the buyers must wait to get the level of support.

Here it comes. A bullish reversal candle forms at a flipped support followed by a breakout candle. A long entry shall be triggered right after the last candle closes. Stop Loss may be placed right below the support where the price forms the bullish reversal candle. Many traders set their stop loss right below the breakout candle. In my experience, this offers a better risk-reward, but it often brings more losing trades.

Have you noticed that the price came back and then headed towards the North? If we had set our Stop Loss right below the breakout candle, our Stop Loss would have been hit. Rather than making some profit, we would make a loss here.

The Bottom Line

Setting Take Profit is important, but setting Stop Loss is more important. In my opinion, it is an art. It needs a lot of practice to be well acquainted with the art of setting Stop Loss as immaculate as it can get.

Categories
Forex Chart Basics

Why Mark Support/Resistance Zone Along with Line?

Most traders use a horizontal line on their trading chart to mark support/resistance levels. Support and Resistance lines are the most basic trading tools, which traders use to make a trading decision. However, traders often find that the price does not react right at the drawn level.  It is because of candles’ wicks and candles’ bodies. We may see that sometimes the price reacts at the level where the candles’ bodies are, and sometimes the price reacts where the wicks are. Thus, it is a good practice that we mark the support/resistance zone instead of marking the level only.

Let us demonstrate an example of that.

The price is being bullish after producing a Pin Bar. We know that a bullish Pin Bar has a long lower shadow. This means it reacts from a zone not only from a particular horizontal line.

The price is on the correction. Look at those Spinning Tops with long upper and lower wicks. Do you notice that one of the flipped support holds the bodies of the candles? However, those shadows often play an essential role, especially when the price is to confirm a breakout. We will reveal that soon.

The flipped support does not hold the price at last. The price comes towards the South further to find its support. The last bullish candle suggests it finds one strong support for sure. Do you notice that this is where the price has bounced earlier and produced spikes?

This time we have marked out the resistance zone. A bullish candle breaches the zone. The buyers need to wait for consolidation. The question is which level to hold the price as the level of support. Is it the level where the wicks are or where the bodies close or both?

Both levels hold the price as support. On this chart, the level, which is drawn on the wicks, holds the price as the support. On its smaller time frames, the level that is drawn on candles’ bodies holds the price as support. If we draw just one level here, we may get confused. Thus, we must mark out the support/resistance zone. Since the buyers are waiting for a bullish reversal candle to go long, it may be produced where the price is now. The price may as well come down at the lower level of the support zone and create a buy signal. Both are valid signals. Let us find out where the signal is produced.

The buyers may want to trigger a long entry right after the last candle closes. Assume only the red line was drawn here. Some buyers would have been confused that the signal did not come from the right level. Thus, drawing the support/resistance zone comes out handy for the traders. Support/Resistance zone helps traders take a better trading decision.

Categories
Forex Course

15. All About Trading The Tokyo Session!

Introduction

Japan’s capital Tokyo, is the most majorly traded market in the Asian continent. That is, in Asia, the highest volume comes from the Tokyo market. In fact, it is considered the financial capital of Asia. Moreover, it is the third-largest trading center in the world.

The Tokyo session, also referred to as the Asia session, opens at 8:00 PM EST and is traded until 5:00 AM EST. In terms of Japan’s local time, the trading happens between 9:00 AM to 6:00 PM. As ‘Yen’ is the currency of Japan, 16.50% of all the Yen transactions take place during this time. And as far as all currency transactions are concerned, the value lies at 21%.

The one that matters the most during any session is the pip movement in different pairs. Below is a table which represents the average pip movement for some of the major currency pair.

Now, the average of the above currency pairs turns out to be around 53 pips. This number is less when compared to the New York session and the London session.

Some facts about trading the Tokyo session

During this session, the market is seen to fade away its momentum. That is, the market is seen to be quite flat. In technical terms, the market usually goes through a consolidation state. This session might not be the ideal session for the ones looking for large pip movement. However, this session can be great for scalpers.

Tokyo market typically is known to correct the overbuying and selling in the New York session. The market makes drastic moves during the NY session and comes to slows down its pace during the Tokyo session. Therefore, the liquidity during this session is quite feeble.

It is not just the central banks and hedge funds that move the market. Since Japan is the largest exporter in the world, a large number of transactions come from the exporters as well.

Also, the Bank of Japan is an active participant in the forex market during the Tokyo session. This is because it intervenes the curb appreciation in the Yen regularly.

Which currency pairs should you focus on?

The market conditions and situations tend to change from time to time, so it becomes uncertain to predict the exact movement of pairs. However, if we were to consider the average rates, we can keep an eye on the news from countries like Australia, New Zealand, China, and Japan. The news from these countries comes during the Tokyo session or just before its open. And the news usually pumps up the volatility and liquidity of the market. Hence, one can have a focus on AUD, NZD, and JPY pairs.

When the Tokyo session comes to an end, the London markets open, which causes overlap between the two sessions. So, to be part of the significant movements, keep an eye on GBP, EUR, and CHF along with AUD, NZD, JPY, and USD.

This is a brief review of the Tokyo session. We shall discuss the other sessions as well in the upcoming lessons. Take the below quiz to know if you have learned the concepts right.

[wp_quiz id=”46800″]