Introduction
NZDCHF is a cross-currency pair in the Forex market. It is an abbreviation for the New Zealand dollar and the Swiss franc. Here, NZD is the base currency, and CHF is the quote currency.
Understanding NZD/CHF
The value of NZDCHF simply represents the units of CHF equivalent to one unit of NZD. It is quoted as 1 NZD per X CHF. For example, in the market, if the price of NZDCHF is 0.64535, then it requires those many units of CHF to buy one NZD.
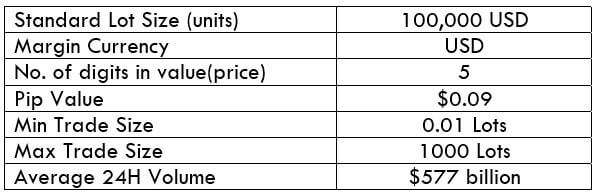
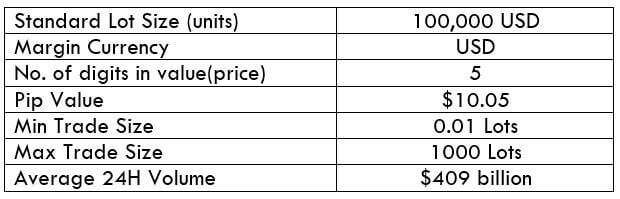
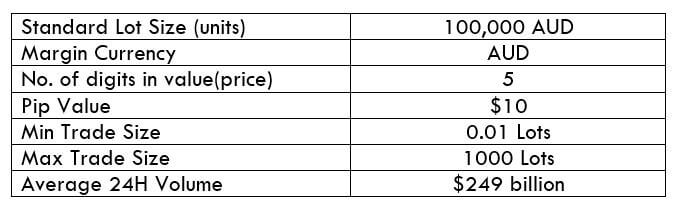
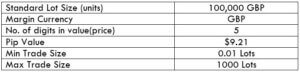
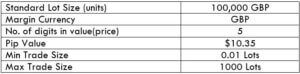
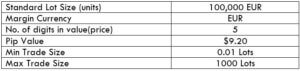
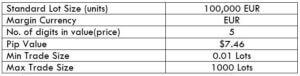
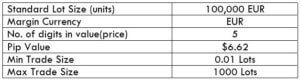
NZD/CHF Specification
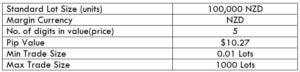
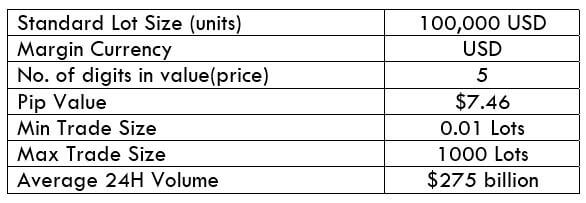
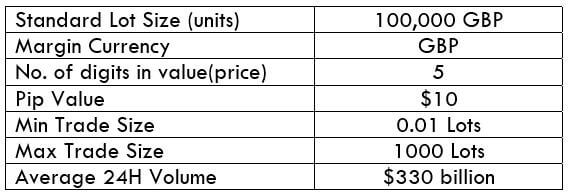
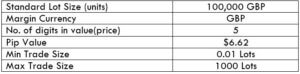
Spread
The bid price and ask price in the market is typically not the same. The difference between these two prices is referred to as the spread. And this difference amount is used by the broker. It varies from the type of account model.
ECN: 1.1 | STP: 1.9
Fees
The fee is basically the commission that has to be paid on each trade you take. It varies from broker to broker and their execution type. Typically, there is no fee on STP accounts, but a few pips on ECN accounts.
Slippage
Another type of fee traders have to bear is the slippage. It is the difference between the trader’s requested price and the broker’s executed price. Slippage always is changing due to the ups and downs in market volatility and the broker’s execution speed.
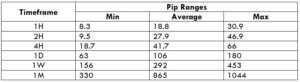
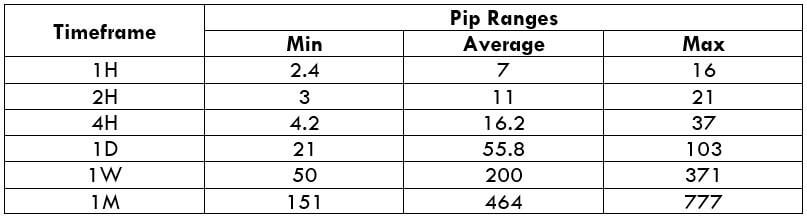
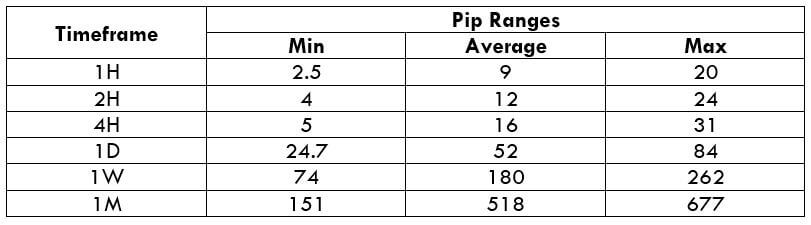
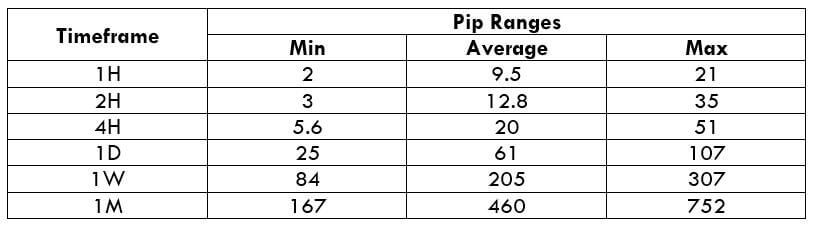
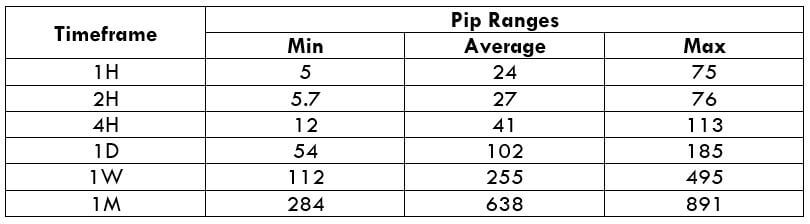
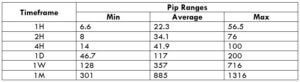
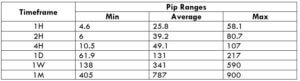
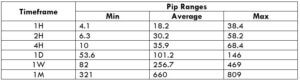
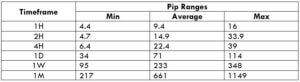
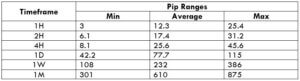
Trading Range in NZD/CHF
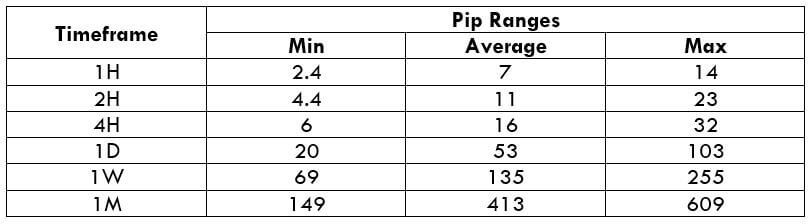
Many novice traders randomly take trades without determining the amount they’re going to risk. The trading range is that representation, which indirectly illustrates the risk and profit area in a trade, in a given time frame. For example, if the average pip movement on NZDCAD on the 4H timeframe is 20 pips, then the trader will be risking $205.4 in an hour on an average.
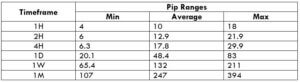
Procedure to assess Pip Ranges
- Add the ATR indicator to your chart
- Set the period to 1
- Add a 200-period SMA to this indicator
- Shrink the chart so you can assess a large time period
- Select your desired timeframe
- Measure the floor level and set this value as the min
- Measure the level of the 200-period SMA and set this as the average
- Measure the peak levels and set this as Max.
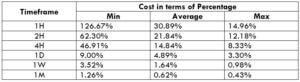
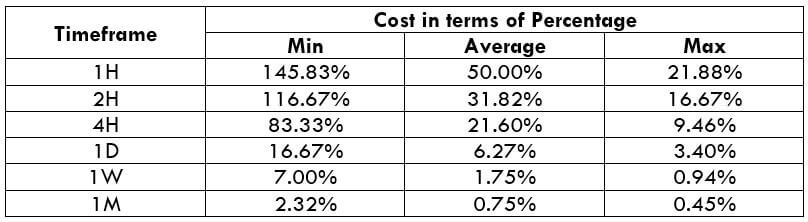
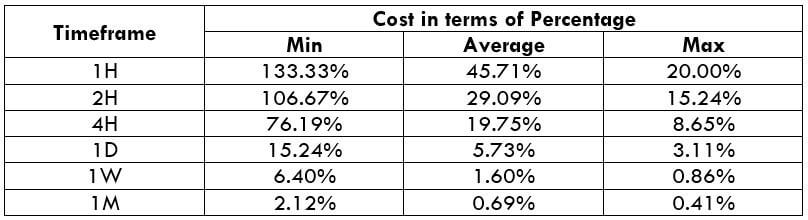
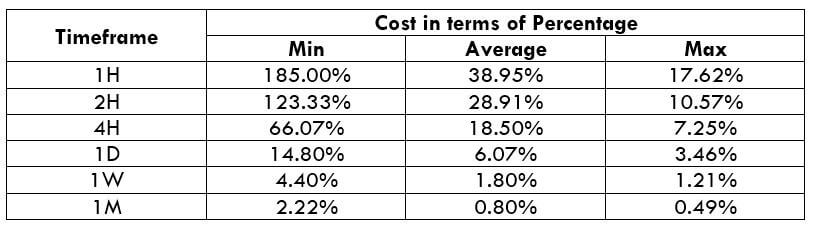
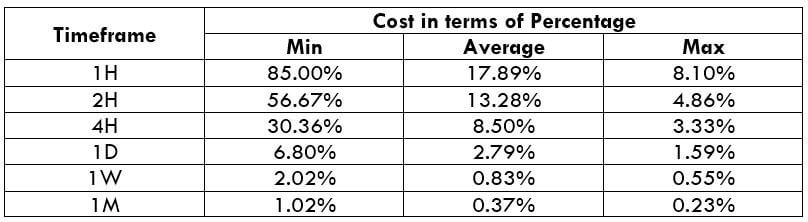
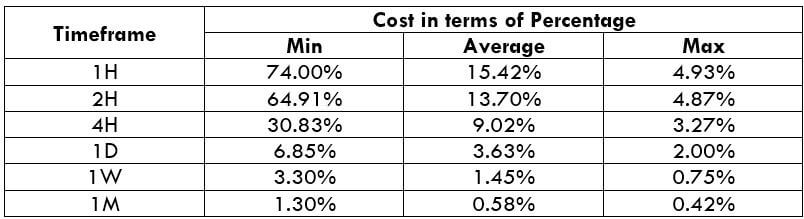
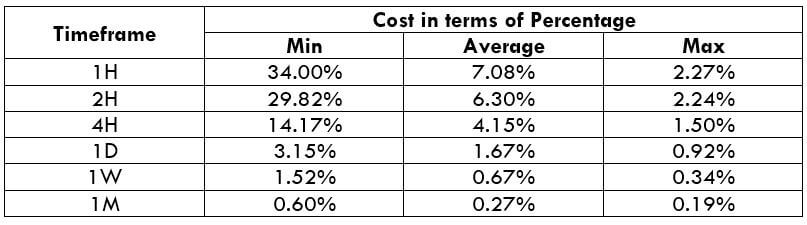
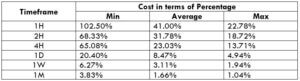
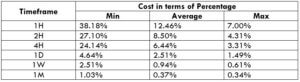
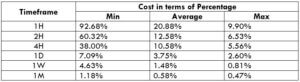
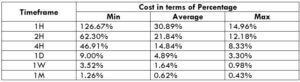
NZD/CHF Cost as a Percent of the Trading Range
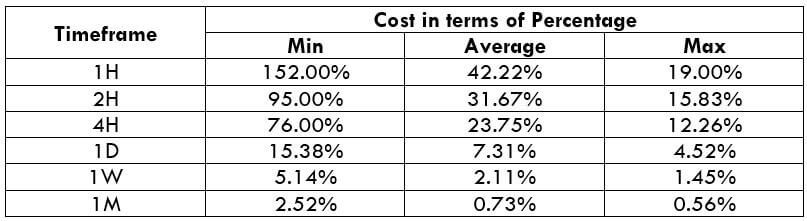
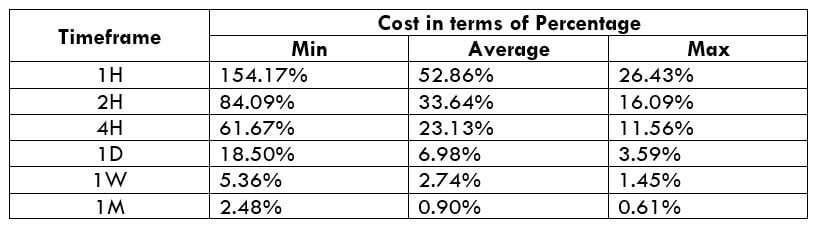
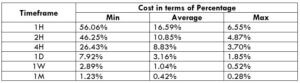
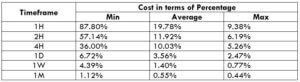
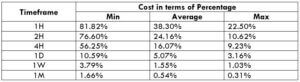
Apart from knowing the profit/loss that can be made from a trade in a given time, it is also necessary to know the cost variation in different volatilities and timeframes. Below is a table representing the cost as a percentage that is obtained by considering the volatility, timeframe, and the total cost on a trade.
ECN Model Account
Spread = 1.1 | Slippage = 2 |Trading fee = 1
Total cost = Slippage + Spread + Trading Fee = 2 + 1.1 + 1 = 4.1
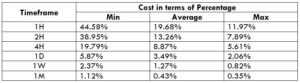
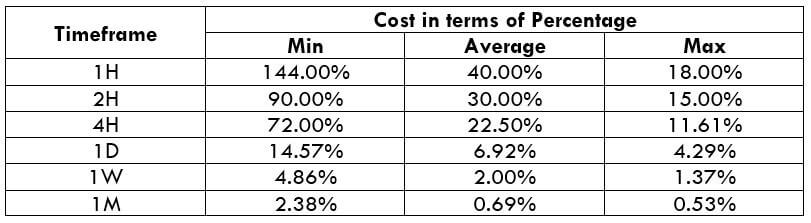
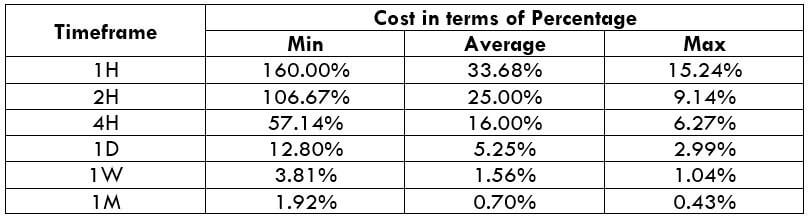
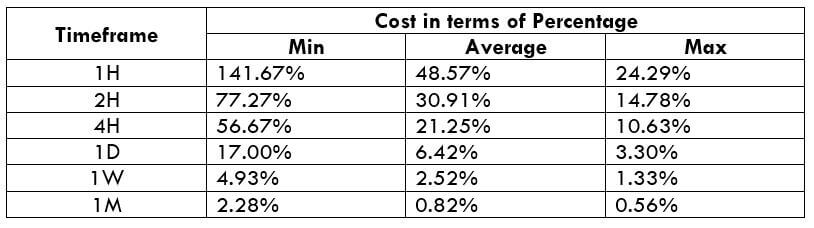
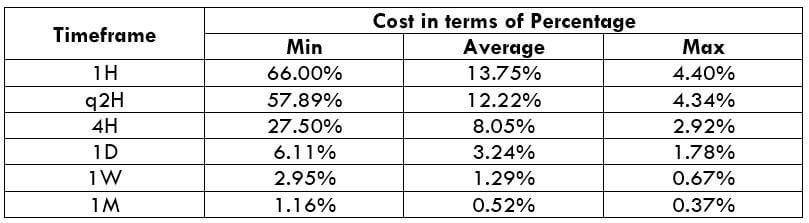
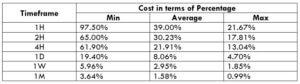
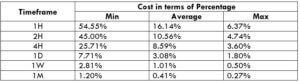
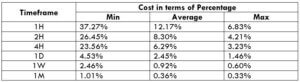
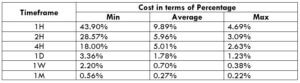
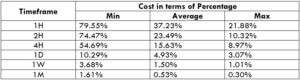
STP Model Account
Spread = 1.9 | Slippage = 2 | Trading fee = 0
Total cost = Slippage + Spread + Trading Fee = 2 + 1.9 + 0 = 3.9
The Ideal way to trade the NZD/CHF
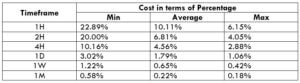
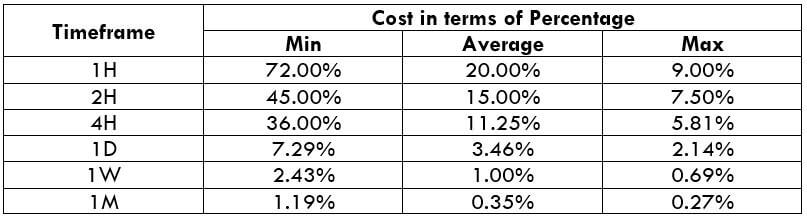
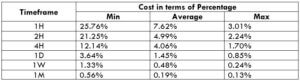
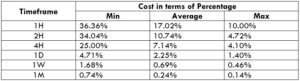
Trading on any timeframe and during any volatility is not an efficient way of trading. There are specific times in the market when you must enter/exit. This can be determined from the above two tables. Firstly, the higher the magnitude of the percentage, the higher is the cost of a trade for that particular timeframe and volatility. It can be ascertained from the table that the costs are low for high volatilities and high for low volatilities. And neither of the two states is ideal to trade. To keep your cost affordable and volatility moderate, it is ideal to trade when the volatility is nearby the average values.
Furthermore, it is recommended to have strategies that enable the use of limit orders. Because trading with limit orders will completely cut off the slippage on the trade Nullifying it, the total cost will significantly reduce, which, in turn, will reduce the cost percentage as well. For example, it was observed that cost percentages were reduced by about 50% when the slippage was removed.

 The Ideal way to trade the GBP/NZD


 Spread