Categories
Forex Elliott Wave Forex Market Analysis

EURNZD Consolidates after Bouncing from its Recent Lows

The EURNZD cross is seen consolidating near the extreme bearish sentiment zone backed by the strength of the New Zealand dollar. This consolidation suggests a pause of the downward sequence that began on August 20th and ended heavily oversold after its latest decline that drove it to 1.69472.

Technical Overview

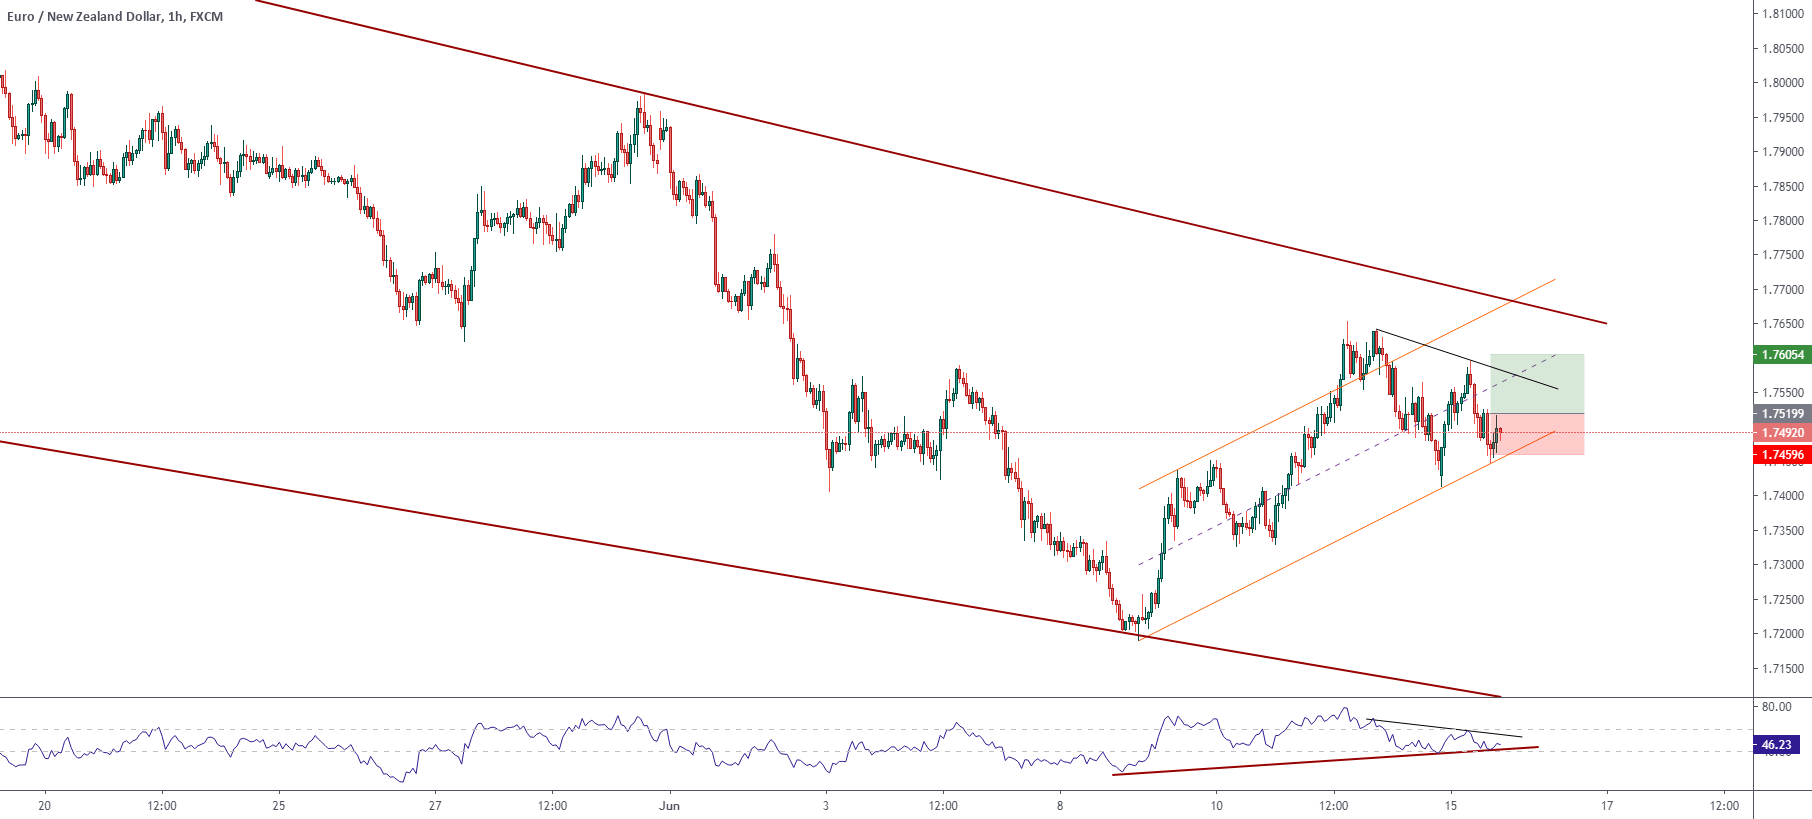
The following 12-hour chart illustrates the short-term markets participants’ sentiment bounded by the 90 high and low range, which shows the price consolidating in the extreme bearish sentiment zone after the cross found support on 1.69472 on November 24th.

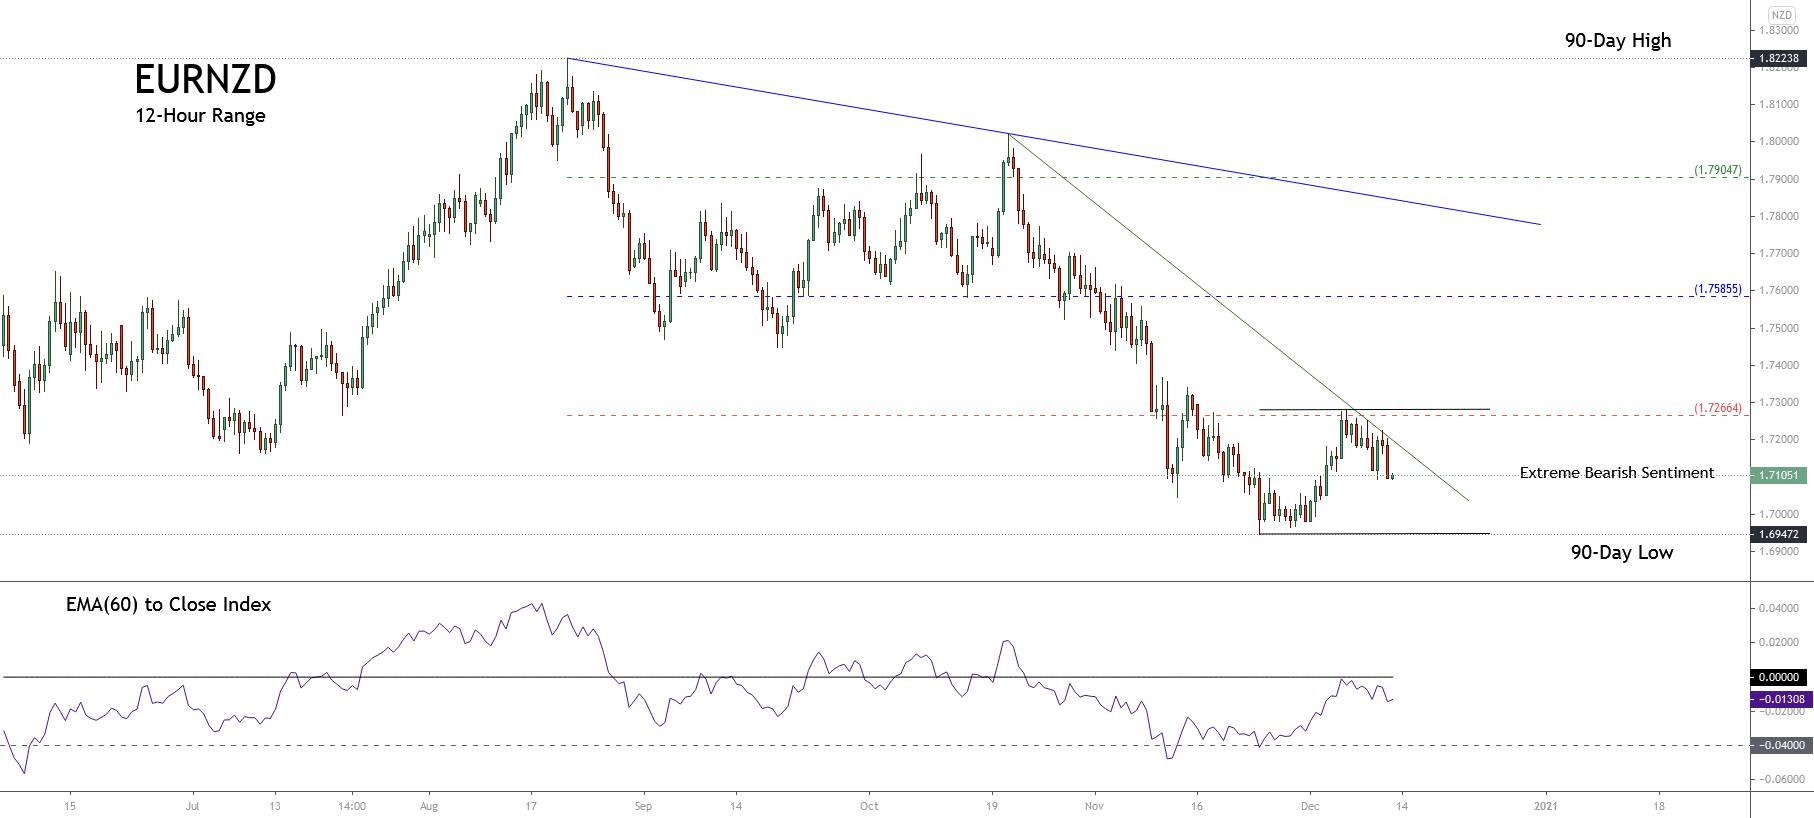
Furthermore, the previous chart shows the primary trend outlined a blue trend-line that tells the bias remains mostly bearish. Likewise, the secondary trend represented with the green trend-line exposes the downward acceleration, and, shows also its consolidation range between the levels of 1.69472 and 1.72664.

Finally, as long as the EURNZD cross keeps moving below level 1.72664, the bias will remain bearish, so we could expect further drops, likely below 1.69472. Whereas, the breakout of the extreme bearish zone of 1.72664 to the upside could indicate the start of a recovery.

Short-term Technical Outlook

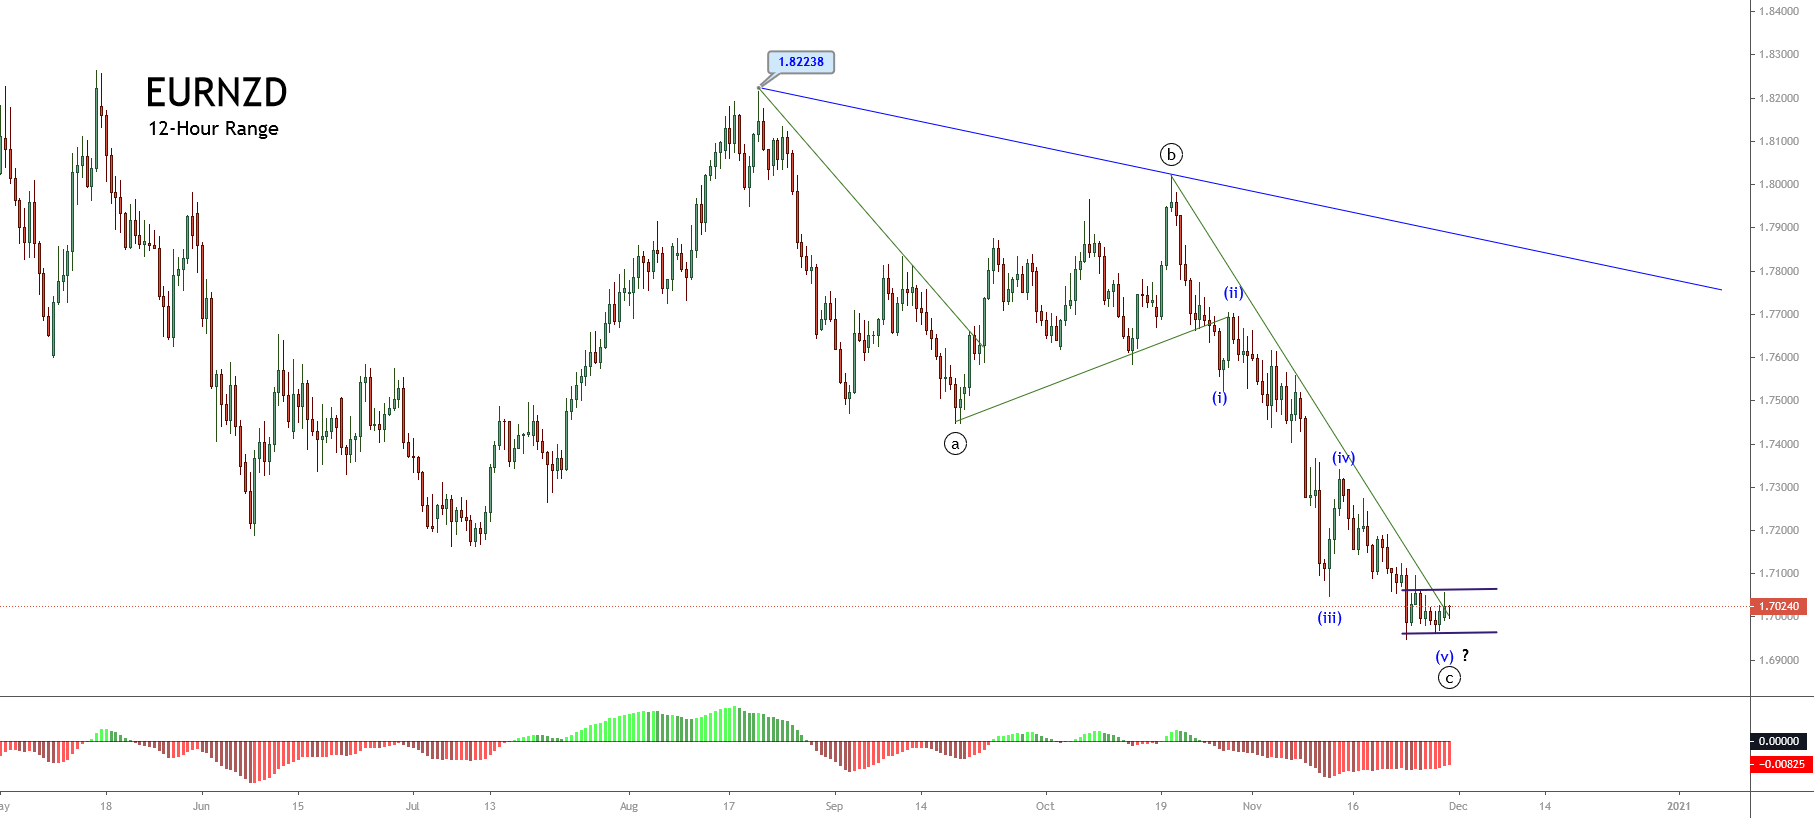
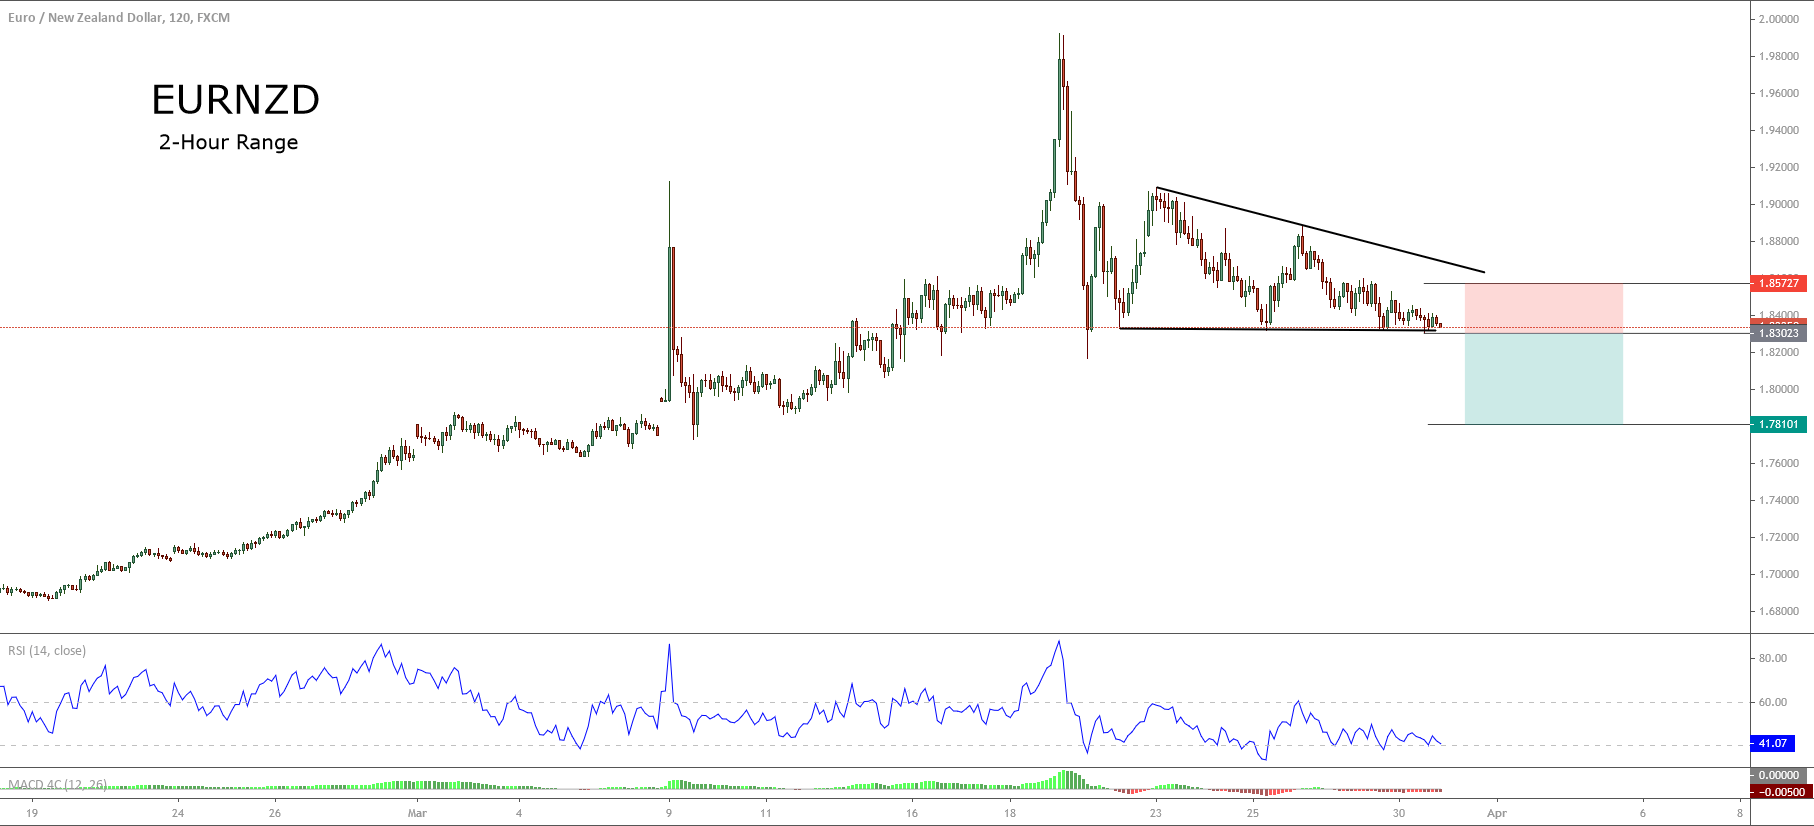
The short-term outlook for the EURNZD cross under the Elliott Wave perspective is shown in the next 2-hour chart and seen moving in an incomplete downward sequence. The current leg in which is moving corresponds to the wave ((c)) of Minute degree labeled in black.  Within that wave ((c)), the price is advancing in its fourth wave of Minuette degree identified in blue.


We see all that the wave ((c)) of Minute degree labeled in black came after the completion of the wave ((b)), which ends on 1.80212 where the cross found fresh sellers dragging it in an accelerated bearish movement. In this context, the current wave ((c)) should develop an internal structure of five waves.

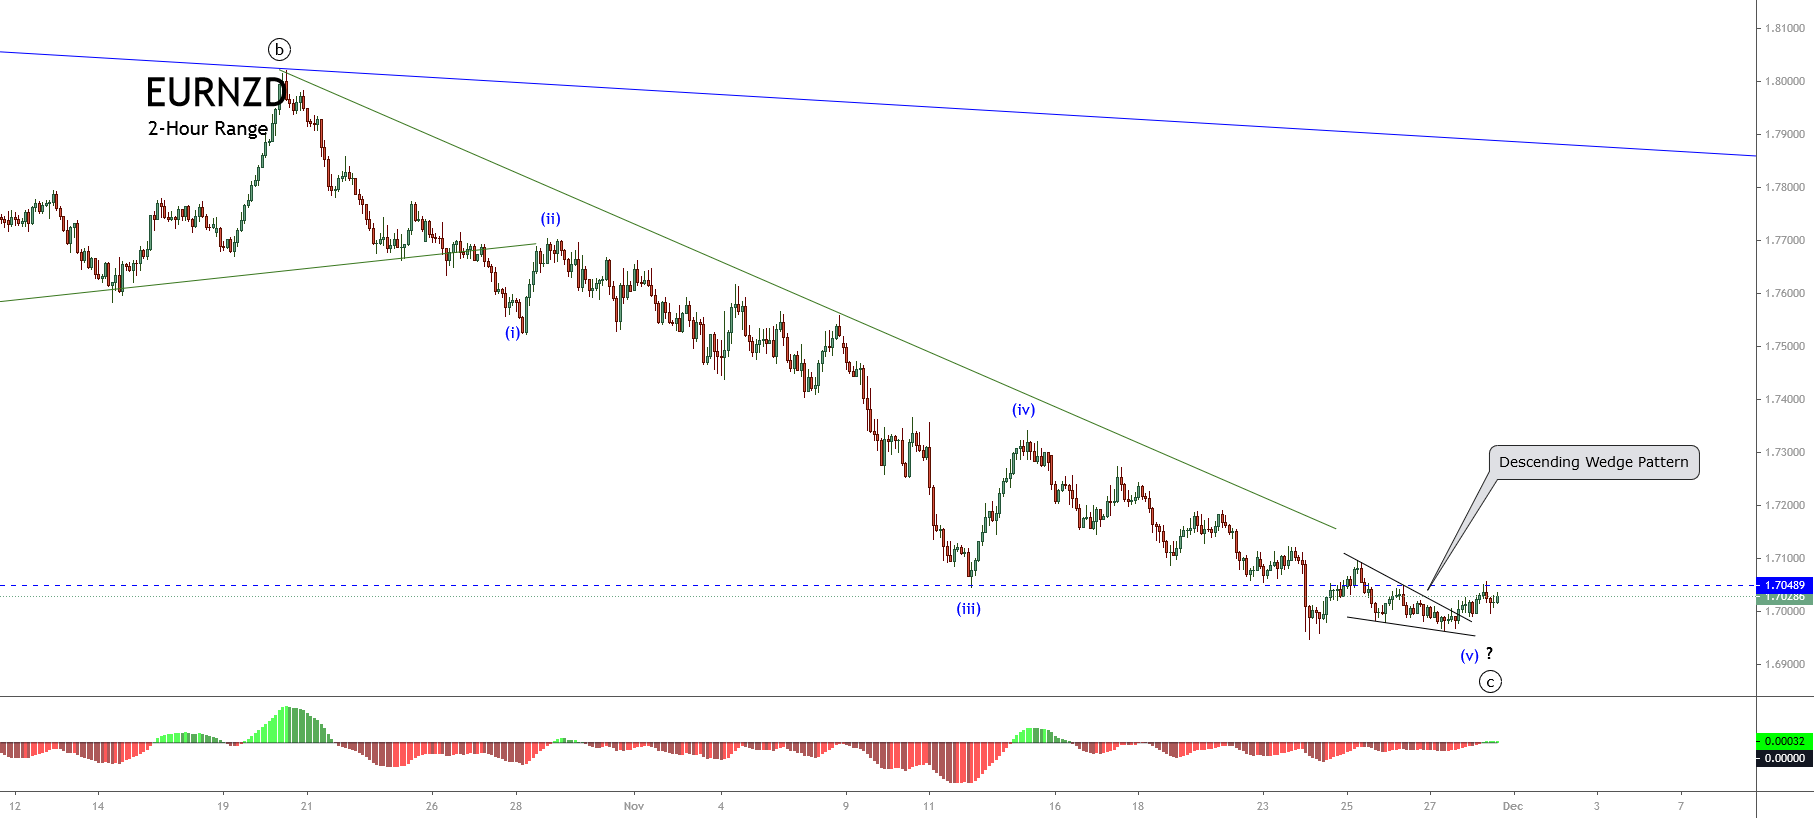
Right now, the chart shows the action is happening in its fourth wave, in blue, which could be advancing in its internal wave b of Subminuette degree identified in green. This leg could possibly test November’s lows. Likewise, considering that the third wave, in blue, looks like an extended wave, the fourth wave should be complex in price, time, or both. Therefore, the current corrective wave could continue evlving likely until early 2021.

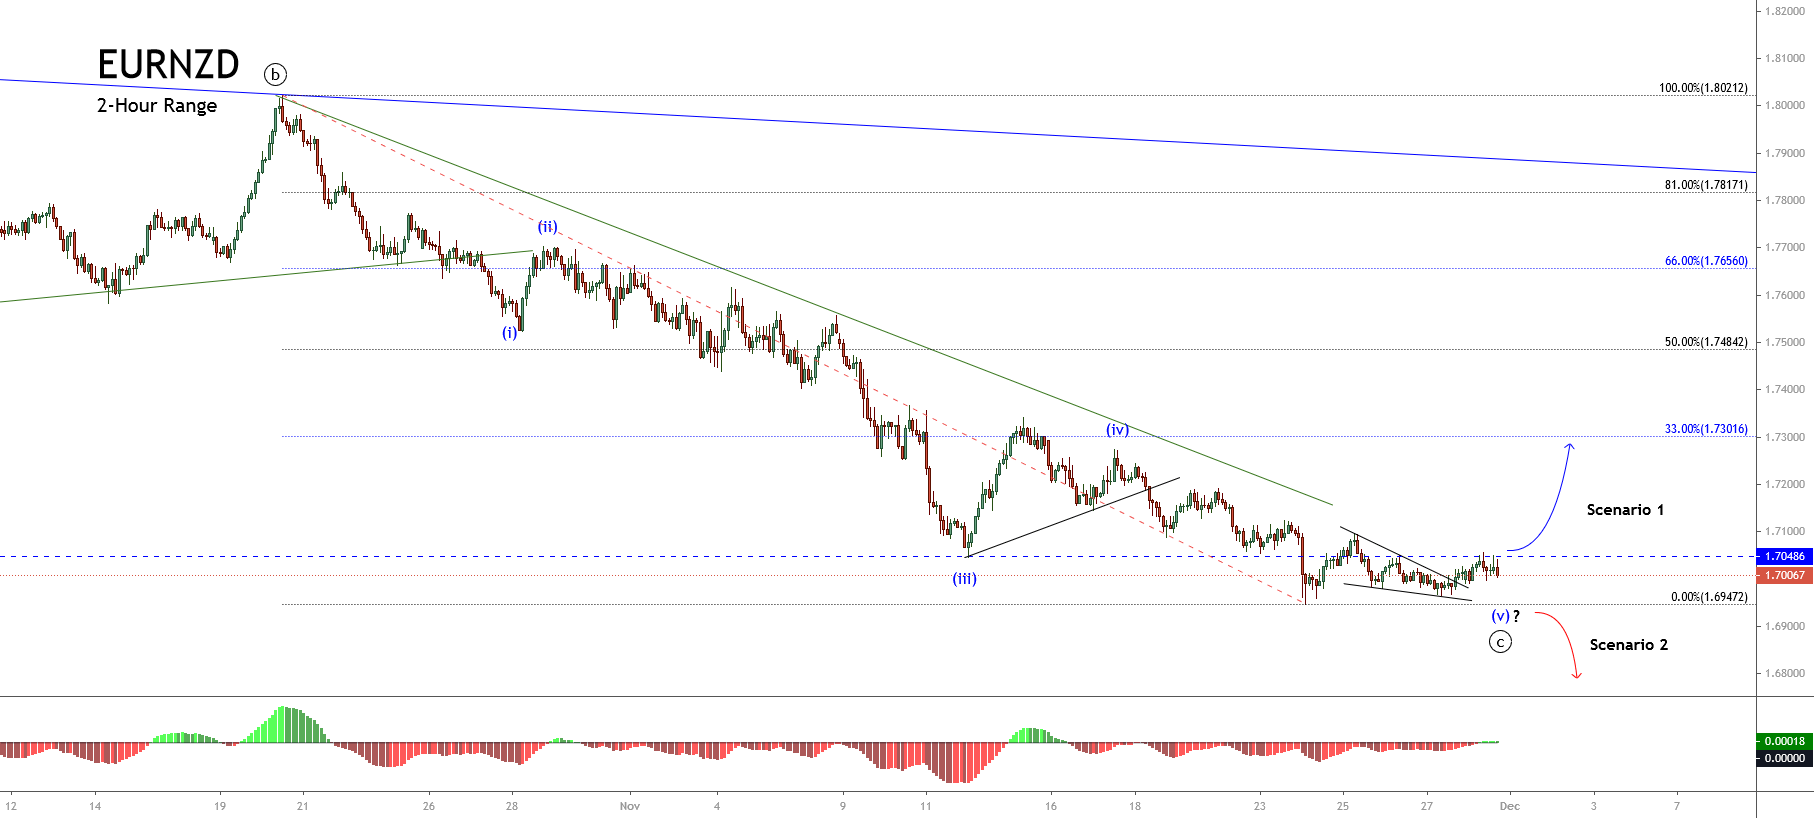
Concerning the fifth wave, in blue, and considering that the third one of the same degree was the extended movement, there are two potential scenarios for the cross:

  • First scenario: the cross fails in its downward sequence finding fresh buyers above the end of the third wave, in blue, at 1.69472.
  • Second scenario: the cross penetrates below 1.69472, creating a new lower low. In this case, this new leg down could continue until the psychological barrier of 1.68.

In summary, the EURNZD cross currently moves in a corrective formation in the extreme bearish sentiment zone. In this context, our principal bias remains neutral until the completion of the fourth wave in blue. Once the cross ends the current consolidation, we could seek short positions following the direction of the fifth wave. Finally, the invalidation level of the bearish scenario locates at 1.73606.
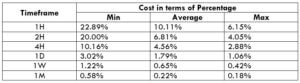
Categories
Forex Elliott Wave Forex Market Analysis Forex Signals

Is EURNZD Developing a Terminal Formation?

The EURNZD cross presents a downward sequence in its 12-hour chart that began on August 20th when the price found fresh sellers at 1.82238. This sequence formed three internal segments and, recently, is likely forming a reversal movement in the following trading sessions.

Technical Overview

The previous chart illustrates the bearish primary trend identified with the descending trendline, drawn in blue. Moreover, the secondary trend, plotted in green, reveals an aggressive decline that is happening since October 20th when the cross found resistance at 1.80212. But we see all that the EURNZD price seems to have found support on November 23rd on 1.69472. Currently, the price action appears consolidating in a narrow range between 1.69622 and 1.70645.

In Elliott Wave theory terms, the cross is advancing in an incomplete downward corrective sequence of Minute degree identified in black, which currently is drawing its wave ((c)). Likewise, its internal structure suggests the progress in the fifth wave of Minuette degree labeled in blue.

The following 2-hour chart reveals the EURNZD cross is moving mostly sideways following a descending wedge breakout, or in terms of the Elliott Wave theory, an ending diagonal breakout. 

Nevertheless, the bullish reversal is still unconfirmed as long as the cross keeps moving below the level of 1.70486.

Short-term Technical Outlook

The EURNZD cross shown in its 2-hour chart below presents a sideways movement below the pivot level of 1.70486, which could correspond to the fifth wave of Minuette degree, labeled in blue. 

Considering that the cross remains in a consolidation structure, there are two potential scenarios:

  • The first scenario occurs if the price action breaks and closes above the 1.70486 pivot level. In this case, the EURNZD could develop an upward movement. According to the Dow Theory, the cross should make an upward motion to the area between 1.73016 and 1.76560. Likewise, the invalidation level for this reversal scenario is seen on 1.69472, which corresponds to the low made on November 24th.
  • The second scenario calls for the price to drop and close below the 1.69472 level. If that happens, the cross could continue its decline toward the lows zone made in January, near the 1.6650 level. The price could find support and complete the wave ((c)) of Minute degree labeled in black. In this scenario, the invalidation level would be located above the last relevant swing high of 1.70961.

However, let’s remember that as long as the price doesn’t confirm any breakout, bullish, or bearish, the bias should be kept neutral.

Categories
Forex Signals

EUR/NZD: Heading towards the South


EUR/NZD has been in a bearish correction on the daily chart. However, the H4 chart shows that the price has been heading towards the South upon finding its resistance around 1.73200. The price consolidated within 1.71900-1.71390. The H4 chart has produced a bearish inside bar at 1.71900. Thus, if the price heads towards the South and makes a breakout at today’s lowest low, it may head towards the South by offering a short entry. The price may find its next support around 1.70500, where it had a bounce earlier. If the price makes an H4 breakout at the level of 1.70500, the pair may remain bearish in the coming days.

Trade Summary:

Entry: 1.71262

Stop Loss: 1.71882

Take Profit: 1.70582

The risk of the trade per standard lot is $ 899.06, $ 89.906 for a mini-lot, and $ 8.99 for each micro-lot. The risk-reward is 1:1.10. Thus, the reward per standard lot is $ $ 988.96, for Mini lot $ 98.89, and for Micro lot $ 9.88.

Categories
Forex Signals

EURNZD Breakout Retest BUY

Location Assessment

  • Price has reacted at the higher low (HL) area which coincided with where there were previously sharp buyers in the L to HH swing in the first picture

Flow Assessment

  • On the H1, price is showing the first signs of bullish market structure, having made a higher high (HH) and signs of buyers defending a HL level
  • Hence we are interested to join the buyers

Momentum Assessment

  • Currently, price is at an area where previous sharp rejections have occurred by the sellers however we note 2 points:
    • Those seller reactions failed to achieve an equal low. The fact that the buyers defended a HL level shows that the sellers do not have much power at this area of 1.7532
    • On the M5, price is holding at this key level for the first time, not showing immediate sharp reactions. This indicates that a breakout to the upside is building up.
Categories
Forex Signals

EURNZD Moves in an Expanding Triangle

Description

The EURNZD cross in its 2-hour range illustrates the advance in a broadening triangle pattern, from where the price action looks testing the baseline of the expanding formation. This test suggests the probability of a new upward movement, which should develop in the coming trading sessions.

From the chart, we distinguish the baseline test by the third time. Furthermore, the baseline’s piercing suggests that the current bearish move could be in an exhaustion stage. This price action context indicates the potential bullish reversal in the EURNZD cross.

The current zone’s long-side positioning could drive the price toward the level 1.76 level as the next potential intraday profit target. The invalidation level of our bullish scenario locates below 1.74895.

An alternative scenario considers the bullish reversal’s extension toward the last significative swing of the current bearish leg that locates at 1.77702, where the price could find the next resistance.

Chart

Trading Plan Summary

  • Entry Level: 1.75295
  • Protective Stop: 1.74895
  • Profit Target: 1.75895
  • Risk/Reward Ratio: 1.50
  • Position Size: 0.01 lot per $1,000 in trading account.


Check out the latest trading signals on the Forex Academy App for your mobile phone from the Android and iOS App Store.


Categories
Forex Signals

EURNZD Swing Failure BUY

Categories
Forex Signals

EURNZD Breakout Retest BUY

Categories
Forex Signals

EURNZD Moves in a Short-Term Ascending Channel

Description

The EURNZD cross in its hourly chart exposes a short-term ascending channel that looks following the price action since the June 09th low at 1.71896, from where the cross started to develop a higher high and lower high sequence.

The June 11th high at 1.76530, which surpassed the previous swing high at 1.75890 from June 04th, the short-term picture changed the bias from bearish to bullish.

The RSI oscillator, which supports the change in our market sentiment, found support in the zone of level 40, which lead us to weight the bullish bias for the potential next move.

A bullish position will activate if the price soars above the last intraday swing at 1.7520, from where we expect an upside until the round level at 1.7605. However, we don’t foresee a rally over the upper long-term descending trendline in brown.

Our bullish scenario will be invalid if the price drops below 1.7475

Chart

Trading Plan Summary

Categories
Forex Signals

EURNZD – Watch this Breakdown

Description

The EURNZD cross in its 2-hour chart shows the progress as a triangle pattern. The corrective structure suggests the possibility of bearish continuation.

On the other hand, the RSI oscillator that moves near to level 40 makes us foresee that the bias remains in the bearish side. In consequence, a breakdown and close under the previous lows would confirm the sell setup.

A sell position will activate if the price breaks and closes below level 1.83023. In our conservative scenario, we expect a potential decline target at 1.78101. The level that invalidates our downward scenario locates at 1.85727.

Chart


Trading Plan Summary

Categories
Forex Assets

Asset Analysis – EUR/NZD Forex Currency Pair

Introduction

EURNZD is the abbreviation for the Euro area’s euro and the New Zealand dollar. It is classified under the minor/cross currency pairs. In EURNZD, EUR is the base currency pair, and NZD is the quote currency. As a matter of fact, in all currency pairs with euro in it, EUR is the base currency.

Understanding EUR/NZD

The value of this pair defines the New Zealand dollars required to purchase one euro. It is quoted as 1 EUR per X NZD. For example, if the value of value in the market is 1.6650, it implies that to buy one euro, the trader has to pay 1.6650 New Zealand dollars for it.

EUR/NZD Specification

Spread

Spread is a very popular term in the forex industry. This is the way through which the broker makes revenue. Spread is simply the difference between the bid price and the ask price. It differs from the type of account model. The spread on ECN and STP is given below.

ECN: 0.9 | STP: 1.7

Fees

For every position that a trader opens, there is some fee associated with it. And it depends on the type of account model. It is seen that there is no fee on STP accounts and a few pips on ECN accounts.

Slippage

Slippage is the difference between the price the trader had demanded and the actual price the trade was executed. Slippage happens when trades are taken using market orders. Slippage has a significant load on the total cost of the trade. More on this shall be discussed towards the end of this article.

Trading Range in EUR/NZD

A part of the analysis in trading is knowing the volatility of the market. Volatiltiy will give an close idea on the number of pips the currency pair will move in a given timeframe. The trading range depicts the minimum, average, and maximum pip movement in a specified time frame. Below are the values for EUNZD.

Procedure to assess Pip Ranges

  1. Add the ATR indicator to your chart
  2. Set the period to 1
  3. Add a 200-period SMA to this indicator
  4. Shrink the chart so you can assess a large time period
  5. Select your desired timeframe
  6. Measure the floor level and set this value as the min
  7. Measure the level of the 200-period SMA and set this as the average
  8. Measure the peak levels and set this as Max.

EUR/NZD Cost as a Percent of the Trading Range

Cost as a percent of the trading range represents the cost percentage that a trader is bearable for each trade they take. The percentage is obtained by finding the ratio between the total cost and volatility. With these percentage values, we come into the conclusion of the best time to enter and exit the market with minimal costs.

ECN Model Account 

Spread = 0.9 | Slippage = 2 | Trading fee = 1

Total cost = Slippage + Spread + Trading Fee = 2 + 0.9 + 1 = 3.9

STP Model Account

Spread = 1.7 | Slippage = 2 | Trading fee = 0

Total cost = Slippage + Spread + Trading Fee = 2 + 1.7 + 0 = 3.7

The Ideal way to trade the EUR/NZD

By analyzing the percentages obtained above, we can find ways to reduce risk and cost on every trade of EURNZD. Firstly, the percentage tells the cost variation for different volatilities in different timeframes. The values are large in the first (Min) column. Meaning, the costs are high in the min column. Also, since this column represents low volatility, it implies that costs are high when the volatility is low and vice versa. In the average column, the costs are neither too high nor too low. And the volatility is under balance as well. Hence, this turns out to be the ideal time to trade in the market.

Moreover, another feasible technique to reduce cost is by placing limit orders. By the use of limit orders, a trader will eradicate the existence of slippage on the trade, and, in turn, reduce the total cost on the trade considerably. An example of the same is given below.

Comparing this table with the previous table, it is evident that the percentages have almost halved. Hence, entering and exiting trades using limit orders can prove to be very advantageous to reduce costs on trade.

Categories
Forex Market Analysis

Forex and Indices – Daily Update – 06.08.18


Fundamental Overview


The U.S. Dollar leads the market sentiment.

Monday’s trading session starts with the US Dollar Index gaining 0.21 per cent against the main currencies. The Aussie Dollar dips 0.19 per cent expecting for the Reserve Bank of Australia (RBA) interest rate decision which will take place in the overnight session. The analysts’ consensus does not expect changes in the monetary policy decision which should remain at 1.5 per cent, this despite the inflation (YoY) reached the 2.1 per cent, beating the 2 per cent RBA’s target.

source: tradingeconomics.com


Technical Analysis


EURUSD


The EURUSD pair in the 1-hour chart is moving bearish, below the first daily support located at 1.1547 and the second daily support at 1.1528. For long positions, the price should close above the breakdown candle at 1.1566, with a potential profit target in the first daily resistance at 1.1597. In the short position case, the second daily support breakdown could drive to the confluence between the third daily support and the first weekly support at  1.15015. Consider that this level could act as a potential reversal level.


GBPUSD

The Cable is moving bearish and is the worst performer of the session falling more than 0.5 per cent. The GBPUSD pair is testing the first weekly support at 1.2924. The bearish movement continuation could send the price to the third daily support at 1.28999, consider this level as a potential reversal zone. For bullish positions, the price should break above the breakdown candle at 1.2968 level, with a potential profit target in the daily pivot level at 1.30055.


USDCHF


The Swiss currency, from the past week, has moved bullish in five clear moves, currently is testing the confluence zone between the first weekly resistance and the second daily resistance on the 0.9986 area. A breakout of this level could carry to the price to reach the third daily resistance located at 1.0007 level. In the opposite case, the reversal move from the current zone could drive to fall to the weekly pivot level situated at 0.99238.


EURCAD

After the Friday 03 breakdown candle, the EURCAD cross consolidates between the daily pivot at 1.50490 and near to the first daily support at 1.50113. A breakdown below 1.50113 as a bearish continuation, could pull the price to touch the second daily support located at 1.4967 level. For the contrary, the breakout and close above 1.50490, could lead to the EURCAD to re-test the previous high at 1.51009 level.


EURNZD

EURNZD cross is running slightly bullish inside of an upper degree sideways structure. The price is testing the zone between the weekly pivot and the daily pivot on the range between 1.7166 and 1.7170. For long positions, the price should break and close above 1.7170, with a potential target in the first weekly support at 1.7210. For short positions, the breakdown and close below 1.7133 should drag the price to the second weekly support at 1.70546 level.


FTSE 100

FTSE 100 in the first trading session of the week, is moving in a limited range between 7,635 and 7,679 pts., which could be characterised by the stational August lower volatility. For long positions the price should break above 7,679 pts., and could push to the British index to the HHL level at 7,740 pts. For the contrarian, the selling side should be valued if the price breaks under 7,635 pts., with a potential target in the first daily support located at 7,601 pts.


DAX 30

In the last four hours, DAX 30 is moving below the weekly pivot level, in a range between the 12,541 and 12,615 pts. After the DAX made the “V-Turn” in the first hours of the Monday session, testing the low of the Tuesday 02 session at 12,706 pts., we foresee that this level will be relevant short-term so we need to stalk it. Long positions should be considered as long as the price breaks and close above 12,615, with a potential target on the first weekly resistance at 12,653 pts. For short positions, the German index should breaks under the low of the day at 12,541, with a potential target on the first weekly support at 12,452 pts.


Categories
Forex Market Analysis

Forex and Indices Daily Update – 16.07.18


Forex Fundamental Analysis


New Zealand CPI (YoY) increase 1.5 per cent in June.

The yearly inflation change in New Zealand increased by 1.5 per cent, below the 1.6 per cent foreseen by analysts and advance from the 1.1 per cent reported in April. Housing and household utilities advanced 3.1 per cent, followed by rentals which were up 2.5. The climb in oil prices, almost 10 per cent, boosted the transport sector to increase the CPI (YoY) 2.0 per cent.


source: tradingeconomics.com


 Technical Market Analysis


EURUSD

In the last session, EURUSD surpassed the Short-term Pivot Level at 1.1690. Now we expect a consolidation structure as a flag pattern before it continues increasing the bullish momentum to the target area at 1.19067. Invalidation level is 1.15080.


GBPUSD

The GBPUSD pair is still moving sideways in the 2-hour chart, testing the Short-term Pivot Level at 1.3275. The breakout of this level should activate the bullish continuation with a target placed in the 1.3475 zone. Invalidation level of the new bullish cycle is 1.30494.


USDCHF

The bearish move after the bull trap looks like a first bearish impulse. From now we should expect a retrace in three waves, probably to the 1.0009 area before it continues with another decline. In the long term, the USDCHF is bullish, in consequence, we will maintain neutral for this pair expecting opportunities to go long with the main trend.


EURNZD

The EURNZD cross in the 2-hour chart has broken down the ascending short-term trendline at 1.7248 with a bearish high momentum candle. We expect more drops with a target placed at the psychological level of 1.70. Invalidation level is at 1.73782.


GBPNZD

The GBPNZD cross in the 2-hour chart has broken down the ascending trendline as the same way that the EURNZD has. This suggests that we should see more strength in the NZD group against the other currencies. The first target is at 1.92393 from where we could see an exhaustion of the bearish cycle. Invalidation level is at 1.95802.


FTSE 100

The FTSE 100 in the 2-hour chart continues to consolidate, developing a complex corrective structure. In terms of the traditional Technical Analysis, the structure could be a Diamond Pattern, if this is correct, we should see declines to the 7,400 area, if the falls extend, the next bearish target area could be 7,100 pts zone. We prefer to maintain neutral expecting for long positions.


DAX 30

DAX 30 in the 2-hour chart still is moving below the 12,600 pivot level. We can consider two scenarios: the first one is after the 12,600 level breakout to expect more climbs to the area between 12,695 to 12,742. The second one is if the price breaks down, the bearish target could be 12,040 pts. In the same way that in the FTSE, our position changes from bullish to neutral expecting long positions.


Categories
Forex Market Analysis

Good News Expected for RBNZ Decision – Forex and Indices – Daily Update – 27.06.18


Fundamental Overview


Good News Expected for RBNZ Interest Rate Decision.

During the overnight session, Stats NZ released the Trade Balance data from New Zealand, which shows an improvement in the commercial situation in June. Exports of meat grew by 17% reaching $817M. While the meat exported increased by 12 per cent reported Stats NZ, the destination of the main export was China, which rose by 27 per cent reaching $1.2B in June. The European Union exports also increased rising by 17 per cent ($664M).

On the other hand, vehicles, parts, and accessories led imports by 25 per cent, climbing to $924M. Whereas, Oil imports were reduced by 30 per cent, falling to $455M in May.

rbnz interest rate decision

Source: Forex.Academy Collection.


Technical Analysis


EURUSD

EURUSD is making the retracement of the first impulsive move testing the blue box from where the euro could start the continuation of the previous movement. RSI is testing support above the 40 level, which makes us suspect that the EURUSD pair could be testing support. Our mid-term vision is that the common currency could beat 1.1853, even reaching the target placed at 1.19467. Invalidation level is at 1.1508.


GBPUSD

The GBPUSD pair is still consolidating the previous impulsive move in the descending long-term trendline. The price is moving in the Potential Reversal Zone (Blue Box) from where we expect the bullish reaction as a continuation of the previous movement. We foresee fresh highs with the target at 1.3443. Invalidation level is at 1.31020.


USDCHF

USDCHF is moving slightly bullish consolidating in the long-term ascending trendline. Our main vision for USDCHF is the formation of a flag pattern reaching the 0.99277 level before continuing with the previous bearish move with a target placed on the area between 0.97225 and 0.96495. Invalidation level of this scenario is at 0.99909.


EURNZD

EURNZD continued developing a bullish impulsive move. As we forecasted in a previous Daily Update (June 20th, 2018), the cross is moving near to the target area at 1.7064. Still, we foresee a more upside to the 1.7148 level. Invalidation level is 1.6572.


GBPNZD

GBPNZD still is moving in an ascending channel to the Potential Reversal Zone proposed in our Daily Update for June 20th. The price could reach the target between 1.944 and 1.958 area, from where the cross should complete a bullish cycle. Invalidation level is 1.8909.


FTSE 100

The FTSE 100 index bounced from the sell-off performed on the Monday 25th trading session; despite this bounce, we expect more dips. FTSE should reach at least the 7,468.3 level before it completes the short-term bearish cycle. From this zone, we could build a new bullish connector. If the index breaks down, the Control Level is likely to reach from the 7,182 level to 7,073 area. Watch out for the RSI which is moving sideways between the 40 and 60 level; this coincides with the consolidation pattern that still is running. Invalidation level of the bearish scenario is 7,793.5.


DAX 30

DAX 30 is testing support on the PRZ forecasted at 12,238 pts. The RSI level at 26 makes us foresee that the German index is developing a wave three. In consequence, more downsides are pending; likely DAX 30 plunge below 12,100 pts. Invalidation level of the bearish cycle is at 13,170 pts.


Categories
Forex Market Analysis

Economists Expect Lower Growth in New Zealand – Forex and Daily Update 20.06.18


Fundamental Overview


Economists expect lower growth in New Zealand.

Lower growth could reach New Zealand for the first quarter of 2018. Amongst the reasons for the lower GDP is the cooling in the housing market, as well as the low prices of dairy products.

Analysts polled expect the quarterly growth to be only 0.5%, being lower than the 0.7% of the previous quarter, this would result in an increase of 2.7% annually, compared to the 2.9% reported in the last quarter of 2017. This deceleration would force the RBNZ to maintain the interest rate at the next monetary policy decision meeting.


FOREX DAILY ANALYSIS


EURUSD

EURUSD is still testing the bottom line consolidating below 1.16 as a relevant resistance level. We expect a new lower low between 1.1520 and 1.1425. Invalidation level of the mid-term bearish cycle is 1.1852.


GBPUSD

GBPUSD is moving bearish, and still, we expect that the price complete the bearish cycle in the key support at 1.3109, creating a bullish connector. Short-term resistance level is 1.3298.


USDCHF

USDCHF still is moving bullish seeking the parity making a flag pattern. We still maintain our vision for the Swiss currency that could make a new bearish leg with a mid-term target on 0.98 level testing the bullish long-term trendline.


EURNZD

EURNZD is developing a bullish impulsive move. We foresee that the cross should to make a retrace as a flag pattern from where EURNZD could bring a new opportunity to incorporate us into the bullish trend with a profit target at least at 1.7064. Invalidation level is 1.6572.


GBPNZD

GBPNZD is running upward building an ascending channel. Our vision is that every dip is an opportunity to go long with a target between 1.944 and 1.958, from where the cross should complete a bullish cycle. Invalidation level is 1.8909.


FTSE 100

The FTSE 100 bounced and broke the bearish short-term trendline, but this move could be as a Dead Cat Bounce Pattern. The British index could complete a new bearish leg to the 7,400 area, from where FTSE should build a new bullish connector.


DAX 30

DAX 30 is moving with a bearish bias, the bounce of the current trading session could be a Dead Cat Bounce Pattern, which could drive us to see new lows below the short-term support at 12,547.6, it could even fall to the 12,300 area, from where we foresee that the German index should start a new bullish sequence.


Categories
Forex Market Analysis

Forex and Indices – Daily Update – June 06th, 2018

Hot Topics:

  • US Trade Balance Falls.
  • Euro raises supported by ending bonds debate.
  • European Indices Move Sideways.

US Trade Balance Falls

The US Trade Balance deficit falls in April to the lowest level for seven months, boosted by the shipments of industrial materials and soybeans.

GBPUSD continues moving higher, aided by the weakness in the Dollar Index. For the coming sessions, we expect that the price makes a bearish connector, probably in the 1.348 zone before it sees new higher highs. Invalidation level is at 1.3254.

Today Forex Market Analysis


The USDCHF pair still moves sideways above the bullish long-term trendline. If the price breaks down the trendline, we expect more dips. In the first instance to the target should be 0.9783; in the second instance, the next support is 0.9725. Invalidation Level is 0.9983.


Euro Raises Supported by Ending Bonds Debate

In the next week, the ECB could start to debate the end of their bonds buying said Peter Praet, the ECB chief economist. This is not the first signal of the QE ending, on May 29th, the ECB member Sabine Lautenschlaeger noted that “June might be the month to decide once and for all to gradually end net asset purchases by the end of this year.”

EURUSD continued rising after the flag breakout and supported by the macroeconomic data. The next resistance levels are 1.1889, 1.19635 and 1.2102. Invalidation level is updated to 1.1616.


EURJPY continues its rally that started on May 29th when it tested the support 124.621. The first corrective structure it developed was brief, this move makes us suspect that the rally continuation could lead to the 132 to 133 area. In the short-term, the cross could see the 130.270 level for bringing steps to a consolidation structure before it continues the bullish cycle. Invalidation level is 126.330.


EURNZD is making a bullish connector inside a bearish major degree structure. Our vision is that the price could visit the area between the 38.2% to 50% of Fibonacci Retracement before it continues its downtrend. In the short-term, the price made a breakout of the 1.6713 level; this move could lead the price to areas between 1.6866 as first resistance and 1.6947 as the second resistance. Invalidation level is below 1.66.


European Indices Move Sideways

The FTSE 100 is moving in a range between 7,680 and 7,720, expecting more volatility. The price could make a limited high completing an A-B-C pattern before it continues the bearish cycle.


The DAX 30 is running sidelong but could complete three waves move in the zone between 12,946 to 13,014 pts before it continues the bearish sequence started on May 23rd, with the bearish target in the 12,528 pts area. If the price plunges below 12,386, the DAX could complete the bearish cycle near to the 12,000 pts. Invalidation level is updated to 13,102.7 pts. In case that price breaks above this level, the next bullish target is 13,250 pts.