
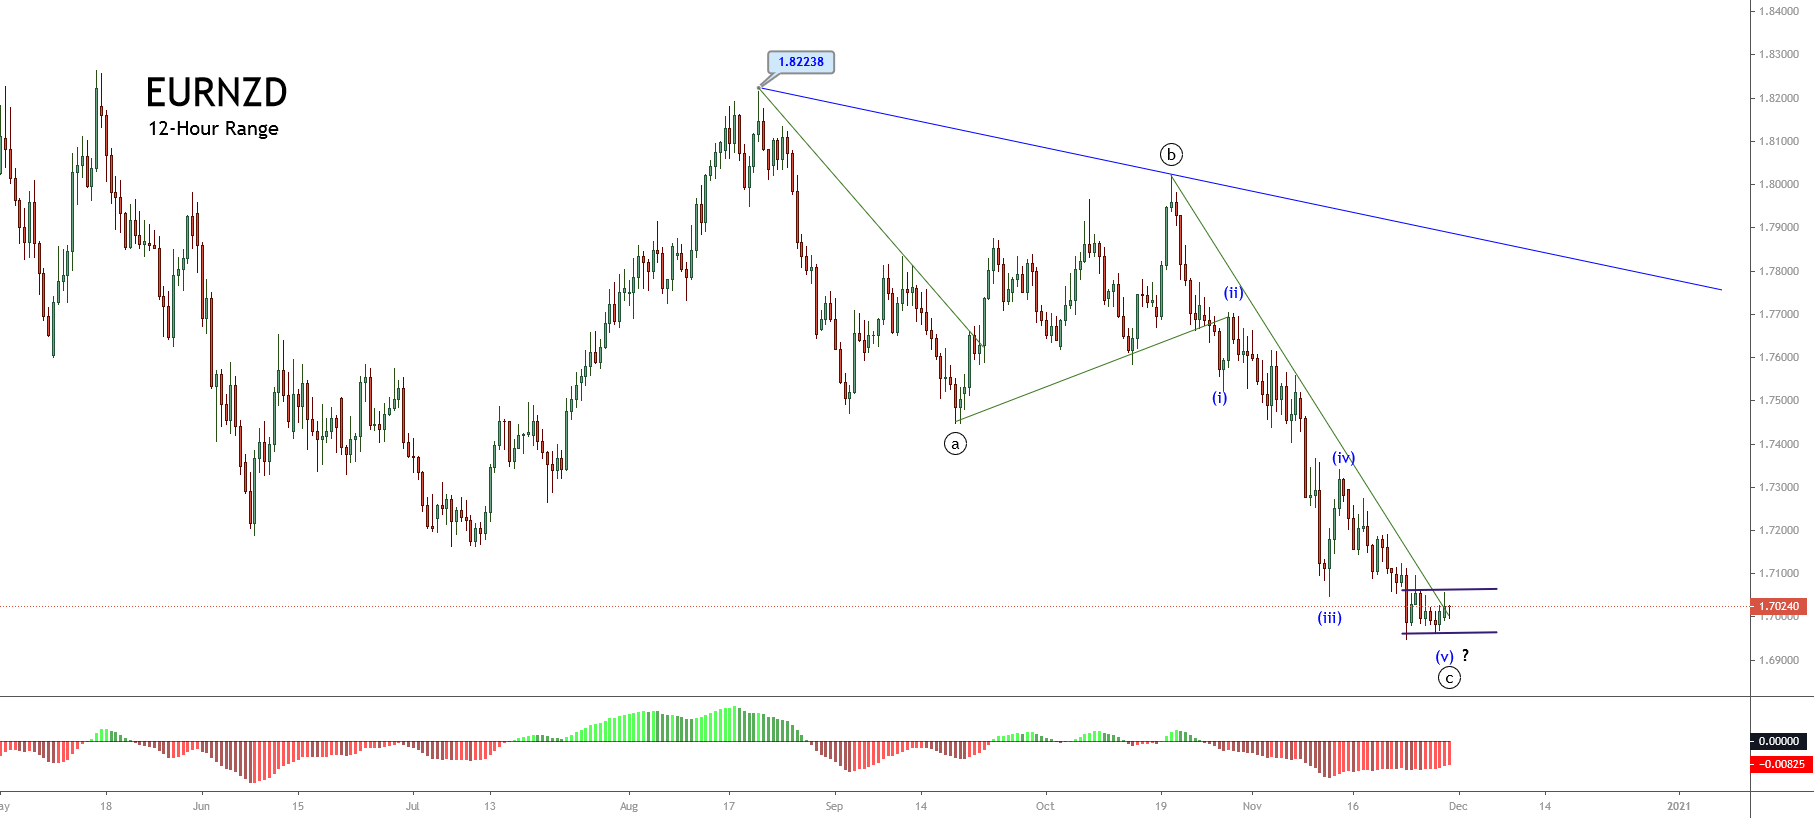
The EURNZD cross presents a downward sequence in its 12-hour chart that began on August 20th when the price found fresh sellers at 1.82238. This sequence formed three internal segments and, recently, is likely forming a reversal movement in the following trading sessions.

Technical Overview
The previous chart illustrates the bearish primary trend identified with the descending trendline, drawn in blue. Moreover, the secondary trend, plotted in green, reveals an aggressive decline that is happening since October 20th when the cross found resistance at 1.80212. But we see all that the EURNZD price seems to have found support on November 23rd on 1.69472. Currently, the price action appears consolidating in a narrow range between 1.69622 and 1.70645.
In Elliott Wave theory terms, the cross is advancing in an incomplete downward corrective sequence of Minute degree identified in black, which currently is drawing its wave ((c)). Likewise, its internal structure suggests the progress in the fifth wave of Minuette degree labeled in blue.
The following 2-hour chart reveals the EURNZD cross is moving mostly sideways following a descending wedge breakout, or in terms of the Elliott Wave theory, an ending diagonal breakout.
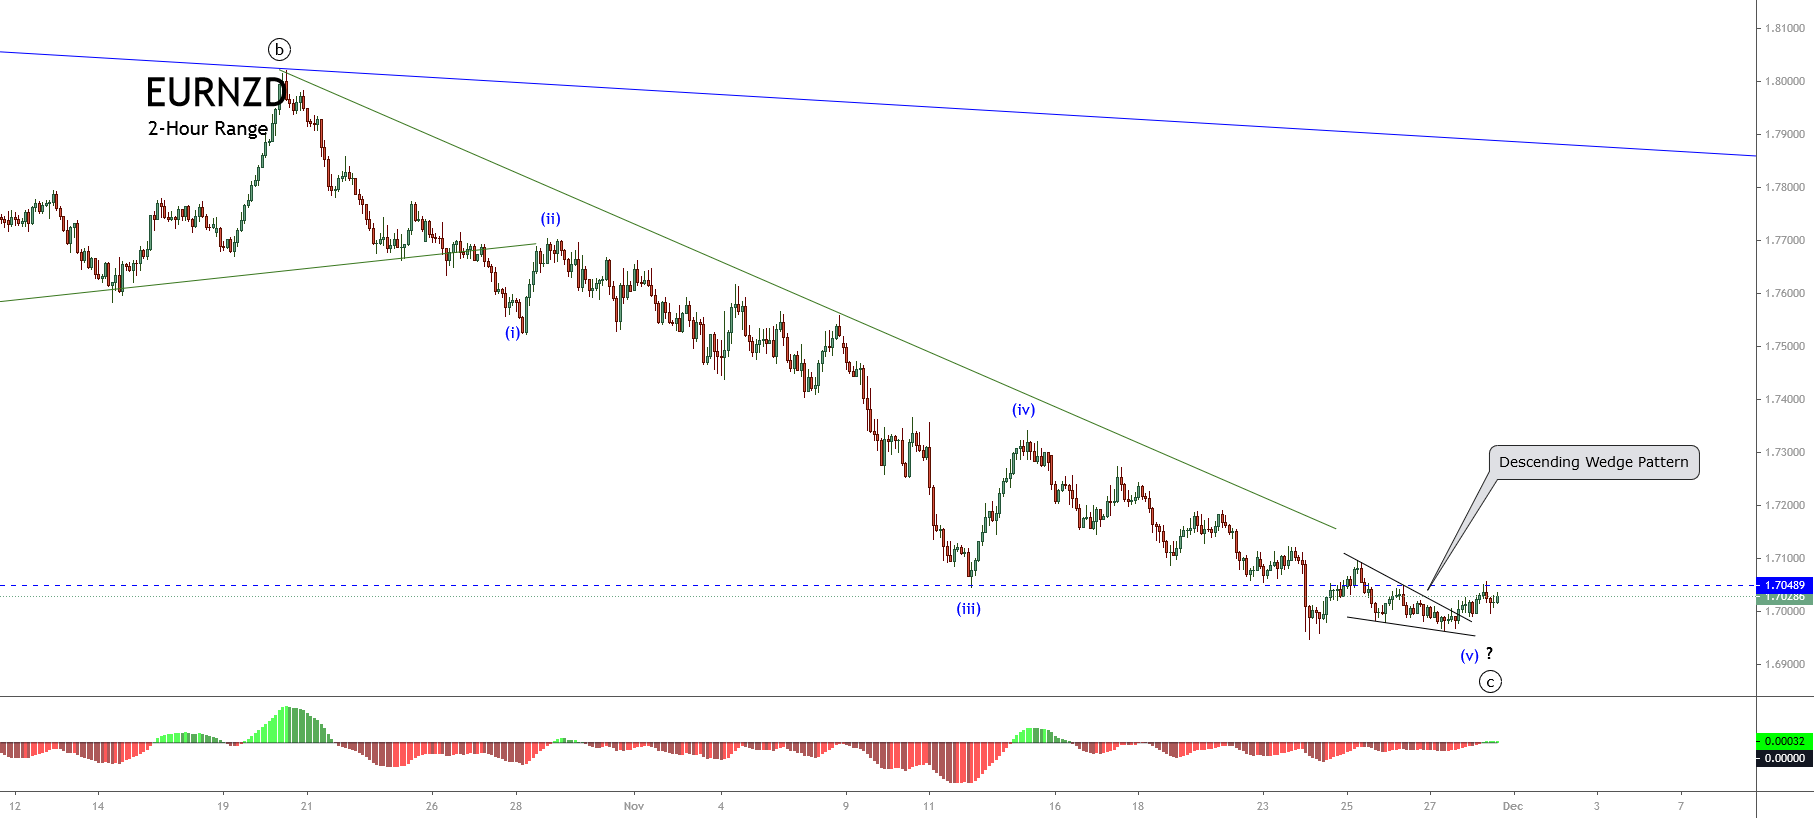 Nevertheless, the bullish reversal is still unconfirmed as long as the cross keeps moving below the level of 1.70486.
Short-term Technical Outlook
The EURNZD cross shown in its 2-hour chart below presents a sideways movement below the pivot level of 1.70486, which could correspond to the fifth wave of Minuette degree, labeled in blue.
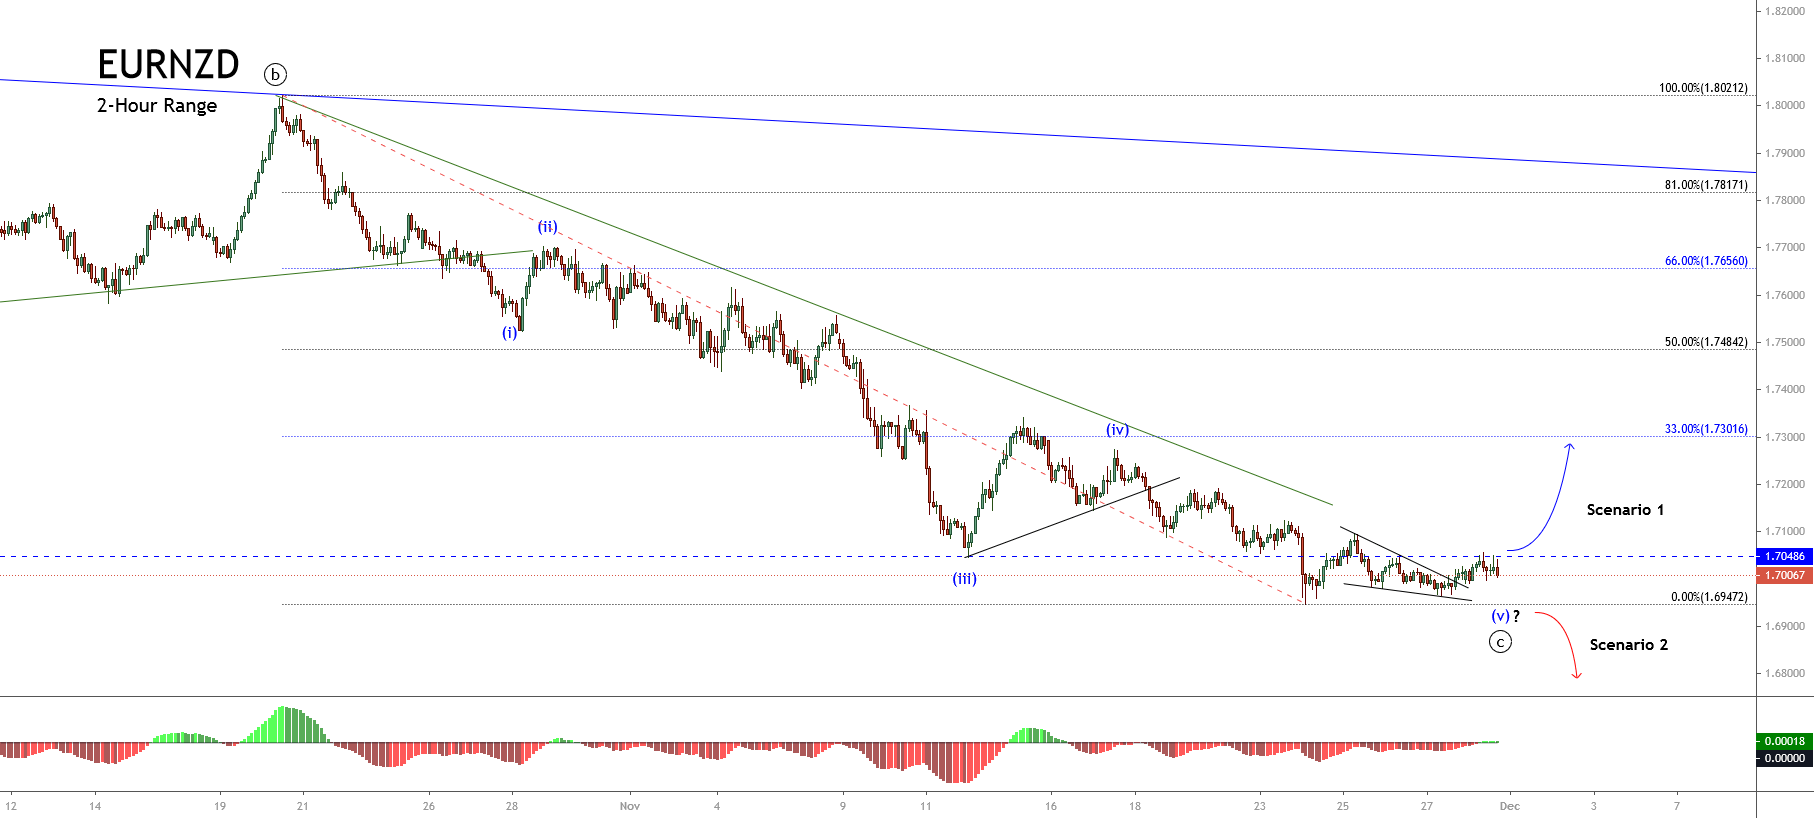
Considering that the cross remains in a consolidation structure, there are two potential scenarios:
- The first scenario occurs if the price action breaks and closes above the 1.70486 pivot level. In this case, the EURNZD could develop an upward movement. According to the Dow Theory, the cross should make an upward motion to the area between 1.73016 and 1.76560. Likewise, the invalidation level for this reversal scenario is seen on 1.69472, which corresponds to the low made on November 24th.
- The second scenario calls for the price to drop and close below the 1.69472 level. If that happens, the cross could continue its decline toward the lows zone made in January, near the 1.6650 level. The price could find support and complete the wave ((c)) of Minute degree labeled in black. In this scenario, the invalidation level would be located above the last relevant swing high of 1.70961.
However, let’s remember that as long as the price doesn’t confirm any breakout, bullish, or bearish, the bias should be kept neutral.