Categories
Forex Signals

EURNZD Moves in an Expanding Triangle

Description

The EURNZD cross in its 2-hour range illustrates the advance in a broadening triangle pattern, from where the price action looks testing the baseline of the expanding formation. This test suggests the probability of a new upward movement, which should develop in the coming trading sessions.

From the chart, we distinguish the baseline test by the third time. Furthermore, the baseline’s piercing suggests that the current bearish move could be in an exhaustion stage. This price action context indicates the potential bullish reversal in the EURNZD cross.

The current zone’s long-side positioning could drive the price toward the level 1.76 level as the next potential intraday profit target. The invalidation level of our bullish scenario locates below 1.74895.

An alternative scenario considers the bullish reversal’s extension toward the last significative swing of the current bearish leg that locates at 1.77702, where the price could find the next resistance.

Chart

Trading Plan Summary

  • Entry Level: 1.75295
  • Protective Stop: 1.74895
  • Profit Target: 1.75895
  • Risk/Reward Ratio: 1.50
  • Position Size: 0.01 lot per $1,000 in trading account.


Check out the latest trading signals on the Forex Academy App for your mobile phone from the Android and iOS App Store.


Categories
Forex Signals

GBPAUD Moves in an Expanding Triangle

Description

The GBPAUD price in its hourly chart exposes the progress in an ascending expanding triangle, which began on the low of June 05th at 1.8060 when the cross found fresh buyers.

The overlapped upward sequence boosted until 1.8452 reached on June 12th when the cross found resistance at the zone of previous June 02nd high reacting mostly bearish starting a corrective movement in a three-wave sequence.

The end of the three-wave corrective sequence found support on June 16th at 1.8148 from where the price action revealed the bullish incorporation of institutional participants, which on Wednesday trading session dragged the price to the zone of 1.8176 in where the price started to show bullish incorporations.

Considering the Elliott wave theory’s alternation principle, we expect a rally that should boost the price to fresh higher highs in the following trading sessions.

A buy-side position will activate at 1.8200 as psychological support; our short-term target locates at 1.8380, this level coincides with the previous high of June 16th, representing an intraday resistance. If the bullish momentum surpasses this resistance, we will expect further raises. The invalidation level of the scenario locates at 1.8110.

Chart

Trading Plan Summary

Categories
Forex Signals

EURUSD Could Visit the 1.10 Level Again

Description

EURUSD, in its 2-hour chart, illustrates an expanding triangle in progress that began in early April and could develop a limited decline before rallies. 

The current bearish leg in progress shows an aggressive decline supported by an extreme oversold revealed on the RSI oscillator. However, the price action remains its bearish momentum.

For the coming trading sessions, we foresee a consolidation structure, which should move up the RSI oscillator. After this move, the EURUSD should decline modestly, creating a bullish divergence, for then unveiling a bullish divergence.

Likely the NFP data release on Friday could provide the necessary volatility to activate the upward scenario as the result of a false decline.

The buy-side position will activate if the common currency touches and closes above level 1.0782. Our conservative scenario foresees an upside to 1.10 as a psychological level

The bullish scenario will be invalid if EURUSD violates the 1.0636, which corresponds to March 22nd low.

Chart

Trading Plan Summary


Categories
Forex Daily Topic Forex Elliott Wave

Analysis and Trading with Triangles

In our previous article, we discussed how we could simplify the zigzag and flat pattern by the chartist figure known as a flag. In this educational article, we will see how triangles can be used in wave analysis.

The Background

Within the Elliott wave theory, triangles represent one of the three basic corrective formations. Similarly, in traditional technical analysis, triangles represent consolidation and continuation formations of the trend.

Elliott defined triangles as a formation that have an internal structure subdivided into five waves following a 3-3-3-3-3 sequence. At its time, Elliott identified two triangle variations, which are classified as expansive or contractive.

In general terms, triangles represent the market indecision or the balance between the buying and selling forces.

The following chart shows the model of the triangles in their contractive and expansive variants, under the Elliott Waves theory and Traditional Technical Analysis perspective.

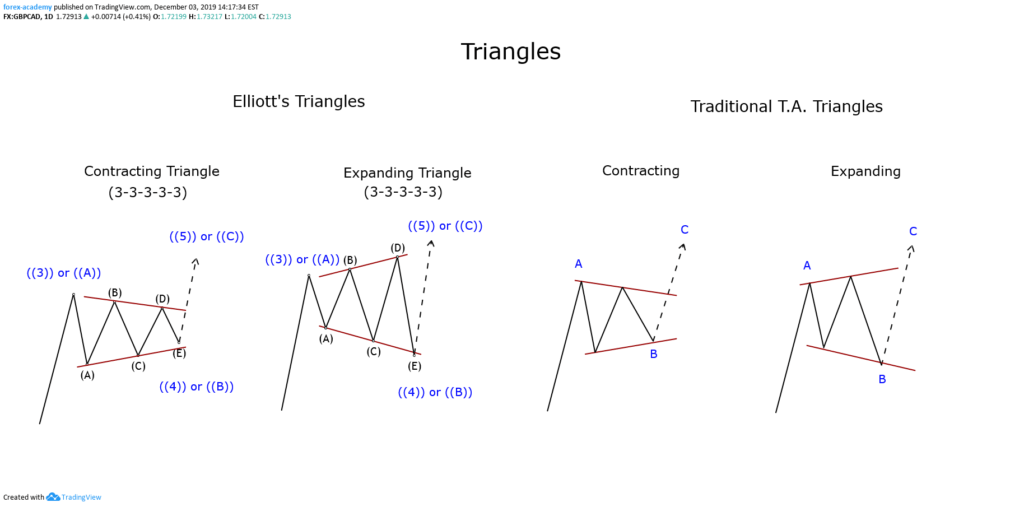
According to the point of view of the traditional technical analysis, we can observe that the triangle pattern is not forced to have five internal segments, as in Elliott’s wave theory. In consequence, a truncated zigzag or truncated flat structure could be simplified by a triangle pattern.

The Trading Setup

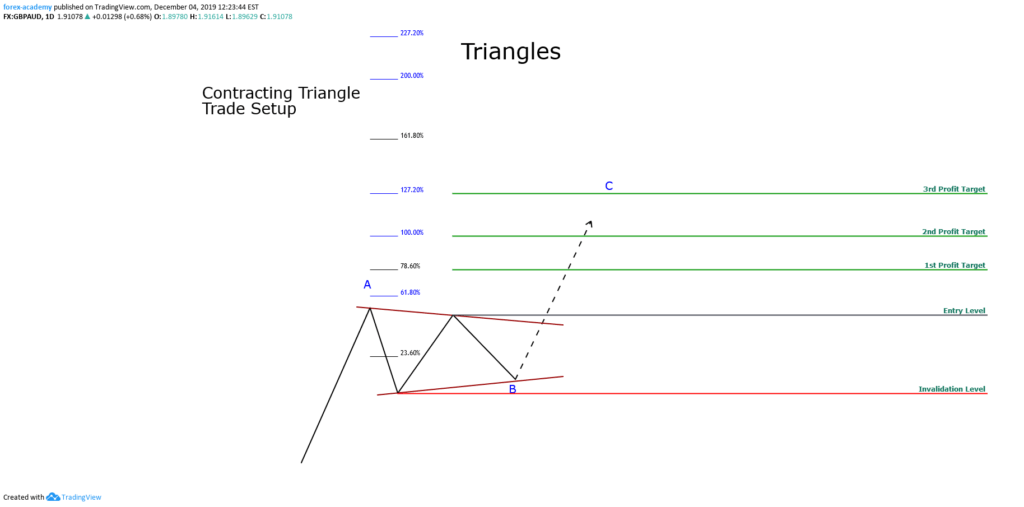
The trade configuration of a contracting triangle pattern has the following characteristics:

  • Entry Level: A buying (or selling) position will be activated if the price exceeds and closes above the swing of the previous top.
  • Profit Target: The first profit target level will take place at 78.6% of the Fibonacci expansion, while the second will be at 100%, and finally, the third profit target level will be at 127.2%.
  • Protective Stop: The invalidation level of the trade setup will be located below the lowest swing of the triangle pattern.

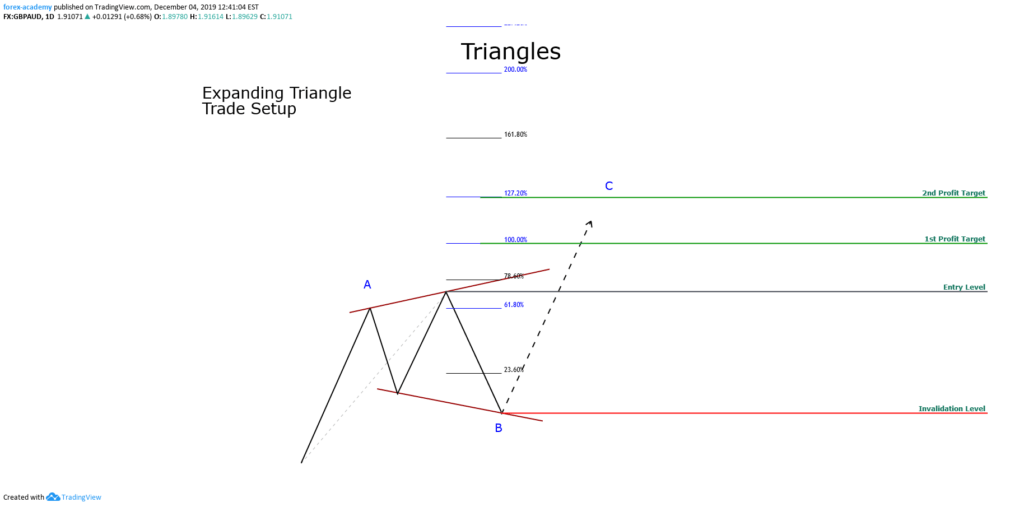
The trade configuration of an expansive triangle pattern has the following properties:

  • Entry Level: The trade will be activated if the price exceeds the height of the expanding triangle.
  • Profit Target: The first profit target level will be at 100% of the Fibonacci expansion. The second profit target level will be at 127.2%.
  • Protective Stop: The level of invalidation will be located below the lowest low of the expansive triangle pattern.

Examples

The following chart corresponds to the AUDUSD pair in its 12-hour timeframe. We can observe that the price action developed an expanding triangle formation, which began from mid-May 2019 and culminated in mid-July 2019.

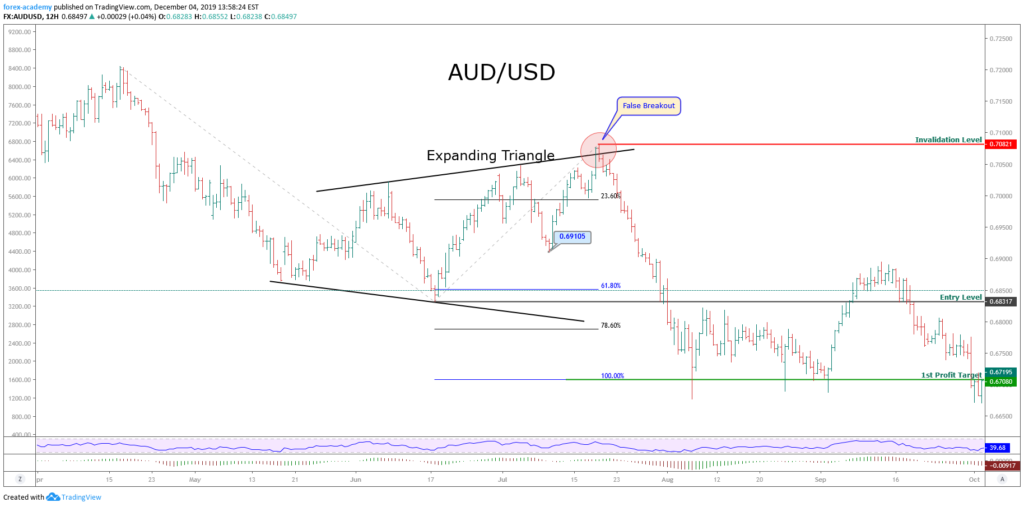
From the chart, we detect that the expanding triangle reached its highest level at 0.70821, which corresponded to a false breakout. Subsequently, the price action resolved the next movement with a drop that took it to plunge until 0.66771.

The sell-side entry was activated once the price closed below the lowest level of the expanding triangle at 0.68317. Once activated the sales position, the price reached the first target at 0.67080.

Another possibility of entry that could be considered would be the closing below the last relevant swing, that is, the closing below 0.69105. This option could provide the trader with a higher profit compared to the risk taken compared to the original entry setup.

The next example corresponds to Silver in its daily chart. From the figure, we observe that the price made a record high early July 2016, reaching $21,225 per ounce, after this, the price action performed a corrective movement, once its found support, Silver built a tight contractive triangle.

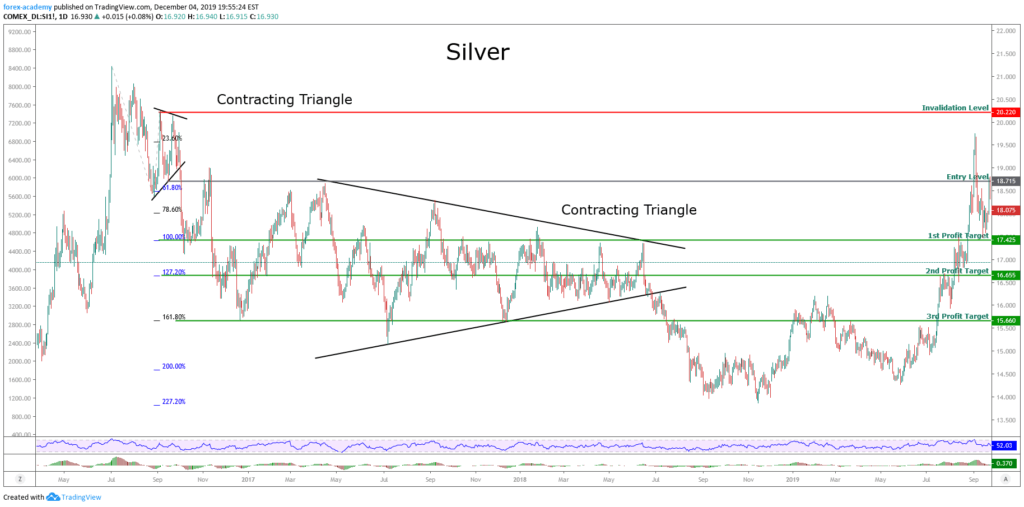
After breaking below $18,715, Silver activated a bearish scenario that drove the price to fall to the third bearish target at $15.66 per ounce.

After having fulfilled the third bearish target, the price fell and reached $18.435 on April 17, 2017, where Silver began to build a contractive triangular structure that lasted until the end of June 2018.

Once the downward break of the long-lasting triangle occurred, we see that the price made a limited downward movement, which did not yield below $14 per ounce.

Conclusion

Based on the discussion of this article, we can conclude that regardless of the corrective structures that have three or five internal waves, these can be simplified as triangular patterns. Also, we can observe that a corrective wave or a short-range narrow triangle is likely to have an extended move that, in terms of Elliott’s wave theory, could correspond to an extended wave.

On the other hand, extensive triangular formations, or of a wide range, could lead the price to move in a range not as broad as in the previous case.

Finally, in the last example, we recognize how the alternation principle works in Elliott’s wave theory. Just as the first observed triangle is simple, and has a short duration, and the second corrective formation is extensive and complex.

Categories
Forex Elliott Wave

The USDJPY and its 3-Year Triangle

The triangle is one of the three basic corrective patterns along with the Flat structure, with more variations within Elliott’s Wave Theory. In this educational article, we will review the basic concepts of the triangle pattern and then apply it to the USDJPY pair.

The Fundamentals

Triangles are one of the three basic corrective formations described by R.N. Elliott. Five internal segments characterize them. The inner legs overlap and follow an internal sequence as 3-3-3-3-3.

The following figure shows the different types of triangles. By simplification, we omitted the internal structure of each segment that composes the triangle pattern.

We should consider the nature of the triangle, a balance between the buying and selling forces. In this context, and under a conservative approach to trading, it is not desirable to trade within this internal structure. However, the breakout of price action across the wave (D) can provide a reliable entry to the market with reduced risk.

The 3-Year Triangle of USDJPY

The following chart corresponds to the USDJPY pair in its weekly timeframe, using a log scale. We observe the price action on the Japanese currency developing a Contracting Triangle structure that began at the end of 2016.

The next chart shows the USDJPY moving in a 12-hour timeframe. The pair shows the last internal segment corresponding to a wave (E) of Intermediate degree labeled in black.

At the same time, in the last figure, we can distinguish the price action developing an Expanding Triangle formation in a wave C of Minor degree labeled in blue. However, the RSI oscillator reveals in its progress the shape of a contractive triangle pattern.

It should be noted that when the price action develops an Expansive Triangle in a wave C, the pattern should correspond to an Expansive Diagonal formation. Remember that a diagonal pattern has five internal waves overlapped one with another. At the same time, each inner leg holds three segments.

Trading the USDJPY Triangle

The USDJPY pair in its 12-hour chart shows an incomplete expansive diagonal. Consequently, positioning on the long-side could still have endeavored with a short-term objective placed in the upper trendline of the diagonal. A likely target area would be between 109,716 and 110,551.

Considering that the invalidation level of the bullish segment is the bottom of the wave ((iv)) in green at 108,242, the breakdown and close of the price below this level could give us the first bearish scenario with a target at the end of the wave B labeled in blue located at 106,625.

Now, if the USDJPY price continues extending its falls below the end of wave C in blue and (D) in black located at 104,446, a major-degree bearish scenario would be activated. Under this context, the pair could see the psychological support of 100 yen per dollar.

Conclusions

Depending on the trader’s style and its risk aversion, the internal structure of the triangle pattern could be traded one timeframe shorter than the time frame in which the triangle has been identified.

We must remember that the internal structure of the triangle follows a sequence 3-3-3-3-3. Under this context, a three-wave corrective structure can be a Flat pattern (which has a subdivision 3-3-5); or it can also be a zigzag pattern (5-3-5). Therefore, an internal wave C could give a trading opportunity. However, knowing the nature of the triangle pattern, and considering it is formed by the struggle between buyers and sellers, the targets of the movements anticipated should be limited by the triangle formation.