Description
EURUSD, in its 2-hour chart, illustrates an expanding triangle in progress that began in early April and could develop a limited decline before rallies.

The current bearish leg in progress shows an aggressive decline supported by an extreme oversold revealed on the RSI oscillator. However, the price action remains its bearish momentum.
For the coming trading sessions, we foresee a consolidation structure, which should move up the RSI oscillator. After this move, the EURUSD should decline modestly, creating a bullish divergence, for then unveiling a bullish divergence.
Likely the NFP data release on Friday could provide the necessary volatility to activate the upward scenario as the result of a false decline.
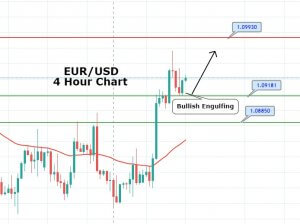
The buy-side position will activate if the common currency touches and closes above level 1.0782. Our conservative scenario foresees an upside to 1.10 as a psychological level.
The bullish scenario will be invalid if EURUSD violates the 1.0636, which corresponds to March 22nd low.
Chart
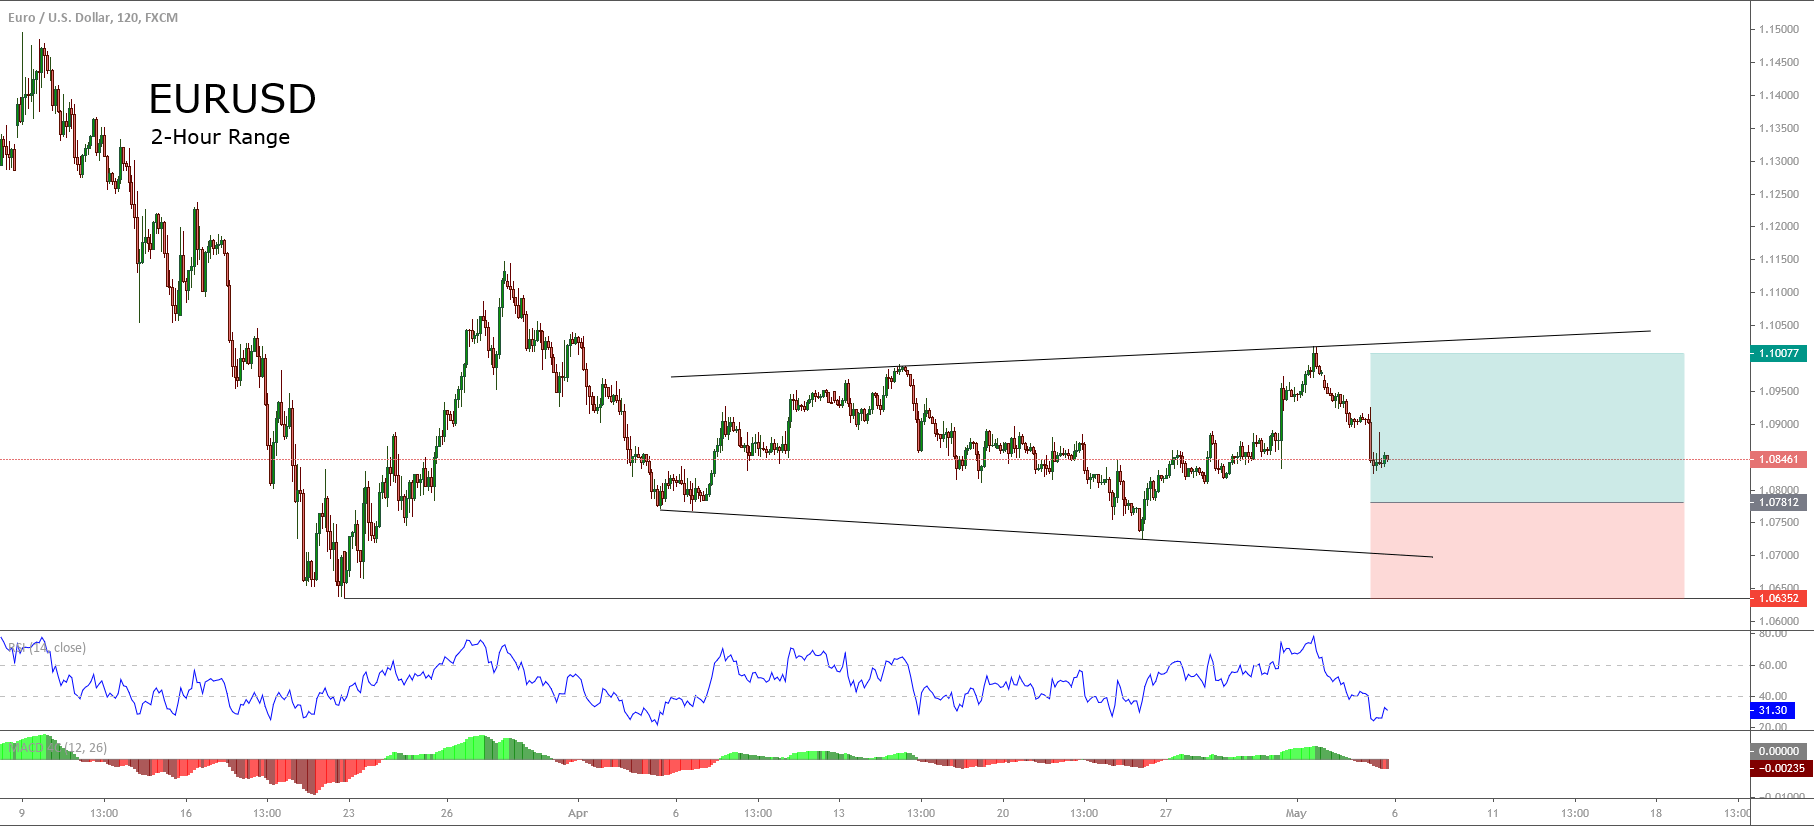
Trading Plan Summary
- Entry Level: 1.0782
- Protective Stop: 1.0636
- Profit Target: 1.1008
- Risk/Reward Ratio: 1.55
- Position Size: 0.01 lot per $1,000 in trading account.