
The triangle is one of the three basic corrective patterns along with the Flat structure, with more variations within Elliott’s Wave Theory. In this educational article, we will review the basic concepts of the triangle pattern and then apply it to the USDJPY pair.
The Fundamentals
Triangles are one of the three basic corrective formations described by R.N. Elliott. Five internal segments characterize them. The inner legs overlap and follow an internal sequence as 3-3-3-3-3.
The following figure shows the different types of triangles. By simplification, we omitted the internal structure of each segment that composes the triangle pattern.

We should consider the nature of the triangle, a balance between the buying and selling forces. In this context, and under a conservative approach to trading, it is not desirable to trade within this internal structure. However, the breakout of price action across the wave (D) can provide a reliable entry to the market with reduced risk.

The 3-Year Triangle of USDJPY
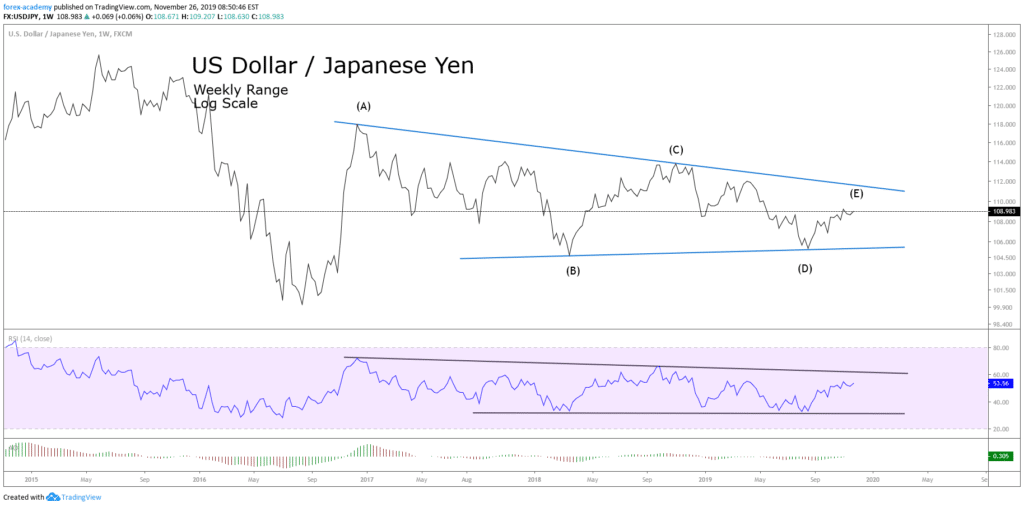
The following chart corresponds to the USDJPY pair in its weekly timeframe, using a log scale. We observe the price action on the Japanese currency developing a Contracting Triangle structure that began at the end of 2016.
The next chart shows the USDJPY moving in a 12-hour timeframe. The pair shows the last internal segment corresponding to a wave (E) of Intermediate degree labeled in black.
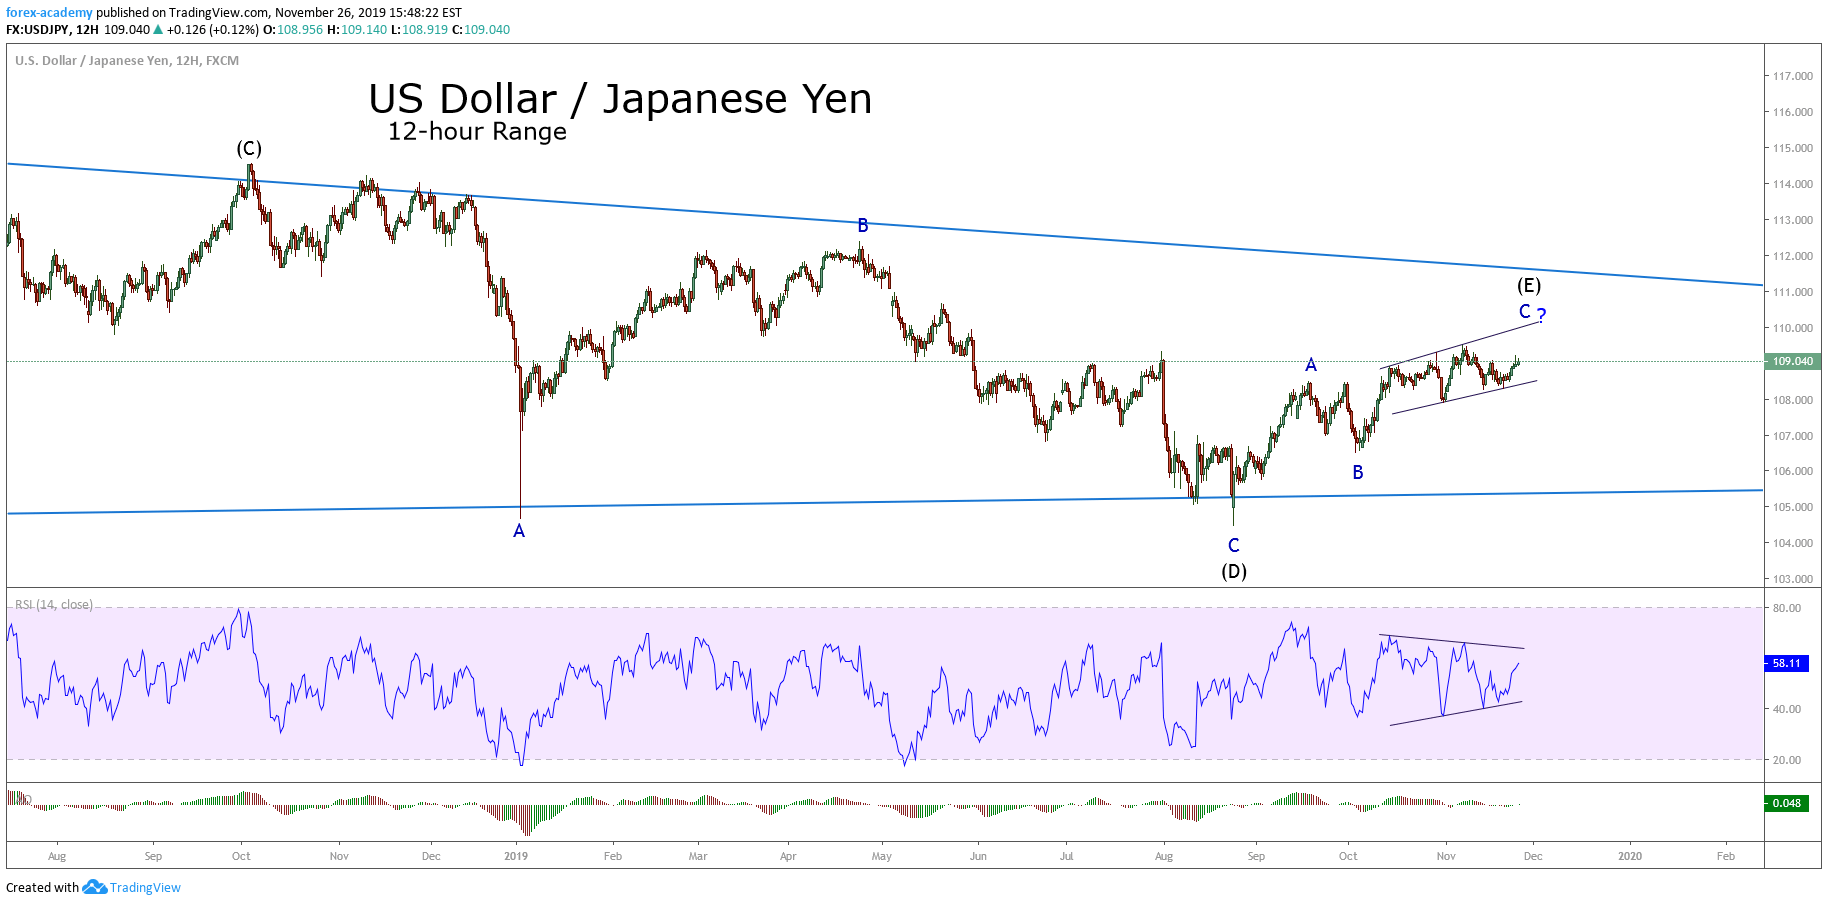
At the same time, in the last figure, we can distinguish the price action developing an Expanding Triangle formation in a wave C of Minor degree labeled in blue. However, the RSI oscillator reveals in its progress the shape of a contractive triangle pattern.
It should be noted that when the price action develops an Expansive Triangle in a wave C, the pattern should correspond to an Expansive Diagonal formation. Remember that a diagonal pattern has five internal waves overlapped one with another. At the same time, each inner leg holds three segments.
Trading the USDJPY Triangle
The USDJPY pair in its 12-hour chart shows an incomplete expansive diagonal. Consequently, positioning on the long-side could still have endeavored with a short-term objective placed in the upper trendline of the diagonal. A likely target area would be between 109,716 and 110,551.
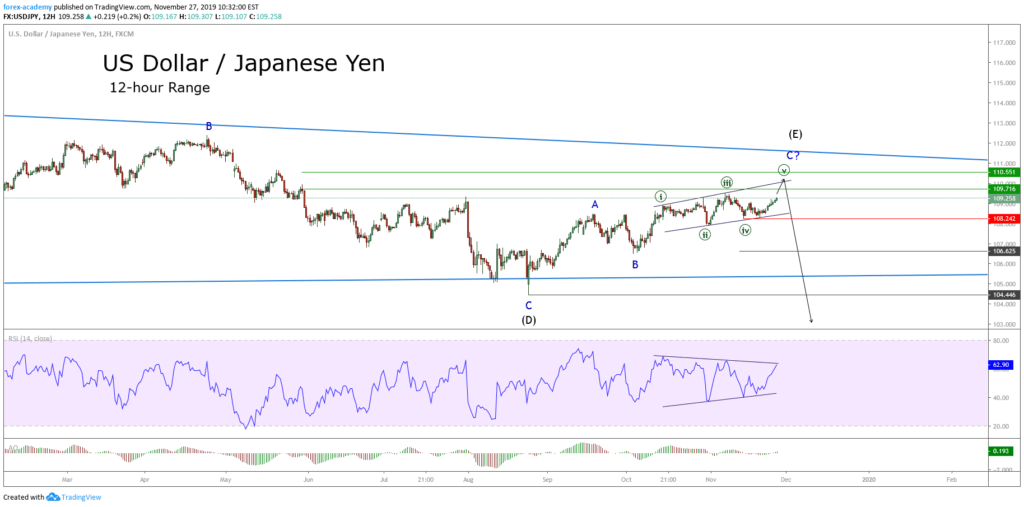
Considering that the invalidation level of the bullish segment is the bottom of the wave ((iv)) in green at 108,242, the breakdown and close of the price below this level could give us the first bearish scenario with a target at the end of the wave B labeled in blue located at 106,625.
Now, if the USDJPY price continues extending its falls below the end of wave C in blue and (D) in black located at 104,446, a major-degree bearish scenario would be activated. Under this context, the pair could see the psychological support of 100 yen per dollar.
Conclusions
Depending on the trader’s style and its risk aversion, the internal structure of the triangle pattern could be traded one timeframe shorter than the time frame in which the triangle has been identified.
We must remember that the internal structure of the triangle follows a sequence 3-3-3-3-3. Under this context, a three-wave corrective structure can be a Flat pattern (which has a subdivision 3-3-5); or it can also be a zigzag pattern (5-3-5). Therefore, an internal wave C could give a trading opportunity. However, knowing the nature of the triangle pattern, and considering it is formed by the struggle between buyers and sellers, the targets of the movements anticipated should be limited by the triangle formation.