Categories
Forex Elliott Wave

Advanced Applications in Wave Analysis – Part 3 of 4

Introduction

The triangle pattern is the third basic model of the corrective structures defined by R.N. Elliott. The triangle contains five internal segments and tends to appear in waves 4 and B. 

Glenn Neely, in his work “Mastering Elliott Wave,” expands the definitions of contracting and expanding triangle introduced by Elliott proposing two subcategories identified as non-restricting and restricting. 

In this educational article, corresponding to the third of four parts, we’ll present the triangle pattern variations and its implications in the wave analysis. In particular, we’ll discuss the contracting triangle pattern and its restrictive subcategory.

Contracting Triangles

This type of triangle is the most frequently identified in the real market. In this group, there are two types of triangles, restrictive and non-restrictive contracting triangles.

Restrictive Contracting Triangle

All contracting triangles have a similar shape in its construction. The main characteristic is that wave E ends before the apex of the triangle. The apex tends to occur in a range of 20% to 40% of the total triangle time extension. 

Concerning the thrust, in restrictive contracting triangles, it is limited by the most extended segment of the triangle (25% approx.) This type of triangles corresponds to the formations described by Elliott in his Treatise. Moreover, these patterns tend to appear in waves 4 and B.
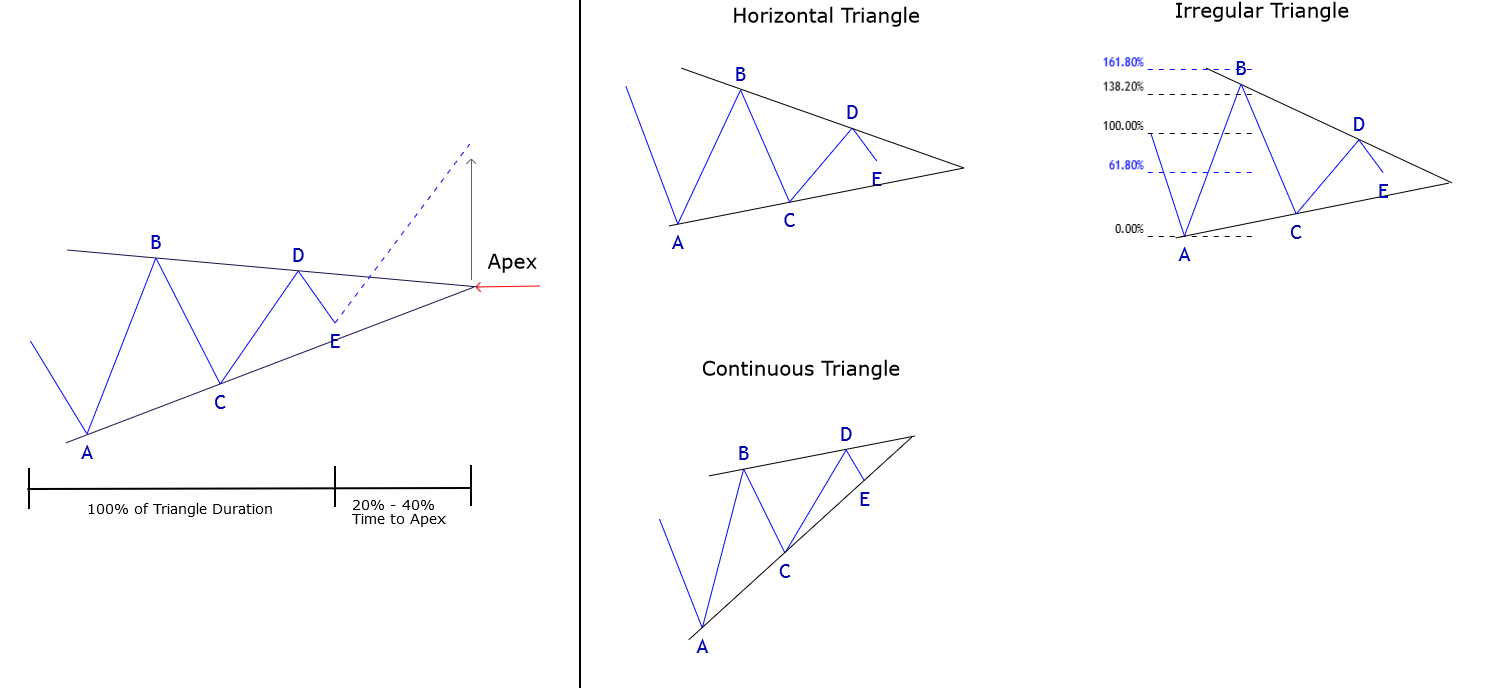
  • Horizontal Contracting Triangle. Each segment must measure at least 38.2% of the previous segment, except for wave E. Wave B can’t be more than 261.8% of A, wave C can’t extend more than 161.8% of B. Wave D must be shorter than wave C, and wave E must be shorter than wave D.
    1. Wave A. This wave will not necessarily be the largest in terms of the price of the triangle. Likewise, it will not be the shortest wave of the pattern.
    2. Wave B. In this case, if wave B is shorter than wave A, then the rest will be shorter. If the wave is longer than wave A, there are a few possibilities that wave C will be longer than wave B, and the triangle formation corresponds to a contracting triangle. If wave C is longer than wave B, then the structure corresponds to an expanding triangle
    3. Wave C. Under a few circumstances, wave C could get longer than wave B. If this scenario occurs, then the base-line should be traced connecting waves C and E.
    4. Wave D. This wave must be shorter than wave C, although it could last longer than wave C.
    5. Wave E. This one must be the shortest wave of the triangle pattern.
  • Irregular Contracting Triangle. This variation is characterized by wave B being the most extended of the structure.
    1. Wave A. In this case, wave A will tend to be shorter in terms of time than wave B. The extension of wave B should be longer than 161.8 of wave A. Wave A could be any corrective pattern except for a triple zigzag or an extended flat.
    2. Wave B. This wave should be the largest wave of the entire formation, extending until 161.8% of wave A, but never beyond 261.8%. Wave B tends to be a zigzag or a double zigzag.
    3. Wave C. This wave will be shorter than wave B and should retrace at least 38.2% of wave B. Wave C could be a zigzag, flat, or an extended flat.
    4. Wave D. This wave will be shorter than wave C and should retrace at least 38.3% of wave C. Wave D could be any corrective pattern that alternates with wave C.
    5. Wave E. This wave will be the shortest wave of the triangle pattern in terms of price. Generally, wave E will tend to be a triangle pattern.
  • Continuous Contracting Triangle. This pattern is detected through the advance of waves B and D. Wave B will be larger than wave A, and simultaneously, wave D will be larger than wave C. The thrust of this pattern would be at least 161.8% respect to the largest segment of the triangle.
    1. Wave A. This wave should not be lower than 38.2% of wave B. Wave A could be a flat or a zigzag, but never a triangle or a double or triple zigzag. Most of the time, wave A will be a flat pattern.
    2. Wave B. This wave must be the largest segment of the complete formation. Its formation could correspond to a zigzag, double zigzag, or rarely a triple zigzag.
    3. Wave C. This segment must be shorter than wave B, and can’t be more complex than wave B.
    4. Wave D. This segment must be larger than wave C in terms of price and could be any type of corrective pattern except a triple zigzag.
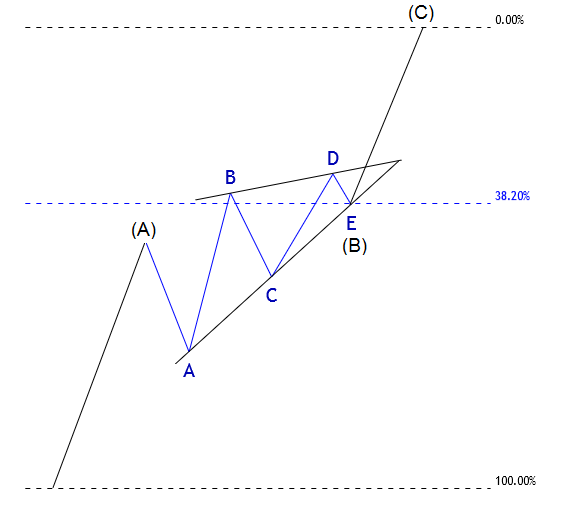
    5. Wave E. This segment must be the shortest wave of the triangle. If the continuous triangle moves in wave B, this wave will frequently end at 61.8% or 38.2% of the entire movement.
Conclusions

In this educational article, corresponding to the third part of the four-part series, we presented the contracting triangle pattern under the restrictive subcategory.

The contracting triangle tends to be the most common corrective pattern in waves 4 and B. As said by R.N. Elliott in his Treatise, the knowledge of the corrective formations and its implications provides to wave analyst an advantage of the potential next move of the market.

In the next article, we’ll end this four-part present the non-restrictive contracting triangles and the expanding triangles.

Suggested Readings

  • Neely, G.; Mastering Elliott Wave: Presenting the Neely Method; Windsor Books; 2nd Edition (1990).


Categories
Forex Daily Topic Forex Elliott Wave

Analysis and Trading with Triangles

In our previous article, we discussed how we could simplify the zigzag and flat pattern by the chartist figure known as a flag. In this educational article, we will see how triangles can be used in wave analysis.

The Background

Within the Elliott wave theory, triangles represent one of the three basic corrective formations. Similarly, in traditional technical analysis, triangles represent consolidation and continuation formations of the trend.

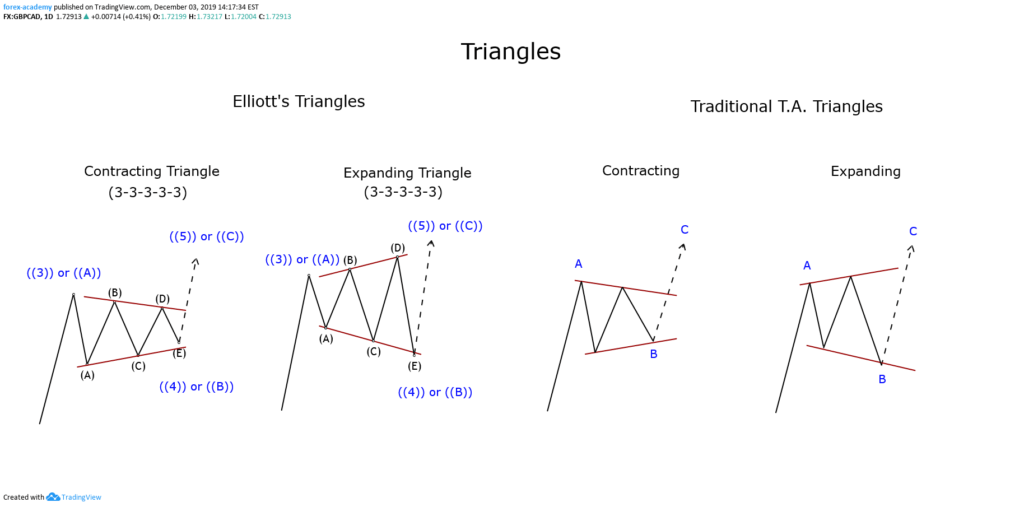
Elliott defined triangles as a formation that have an internal structure subdivided into five waves following a 3-3-3-3-3 sequence. At its time, Elliott identified two triangle variations, which are classified as expansive or contractive.

In general terms, triangles represent the market indecision or the balance between the buying and selling forces.

The following chart shows the model of the triangles in their contractive and expansive variants, under the Elliott Waves theory and Traditional Technical Analysis perspective.

According to the point of view of the traditional technical analysis, we can observe that the triangle pattern is not forced to have five internal segments, as in Elliott’s wave theory. In consequence, a truncated zigzag or truncated flat structure could be simplified by a triangle pattern.

The Trading Setup

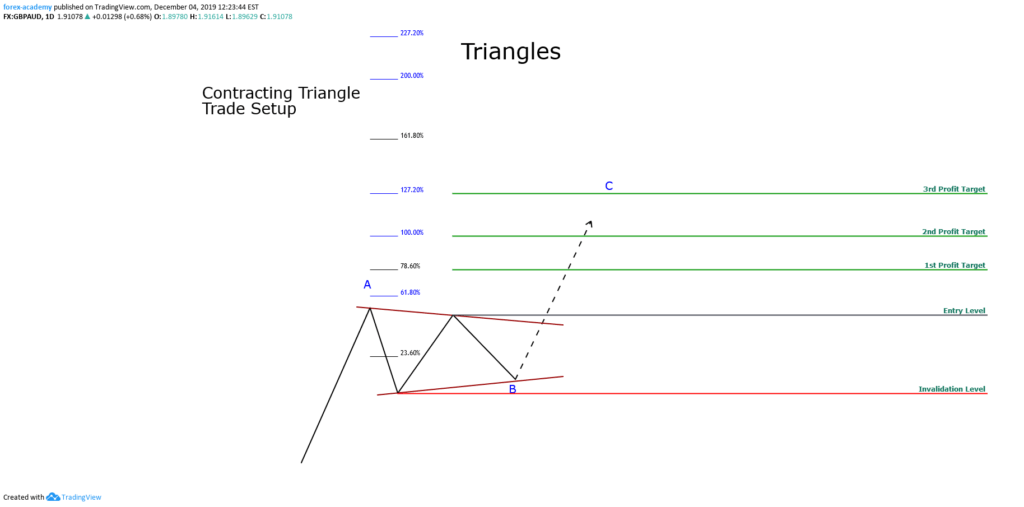
The trade configuration of a contracting triangle pattern has the following characteristics:

  • Entry Level: A buying (or selling) position will be activated if the price exceeds and closes above the swing of the previous top.
  • Profit Target: The first profit target level will take place at 78.6% of the Fibonacci expansion, while the second will be at 100%, and finally, the third profit target level will be at 127.2%.
  • Protective Stop: The invalidation level of the trade setup will be located below the lowest swing of the triangle pattern.

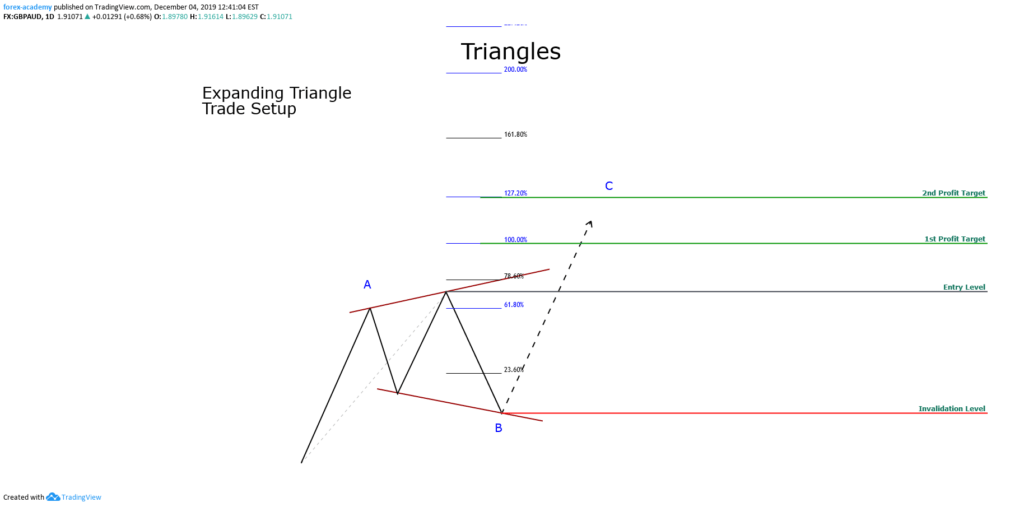
The trade configuration of an expansive triangle pattern has the following properties:

  • Entry Level: The trade will be activated if the price exceeds the height of the expanding triangle.
  • Profit Target: The first profit target level will be at 100% of the Fibonacci expansion. The second profit target level will be at 127.2%.
  • Protective Stop: The level of invalidation will be located below the lowest low of the expansive triangle pattern.

Examples

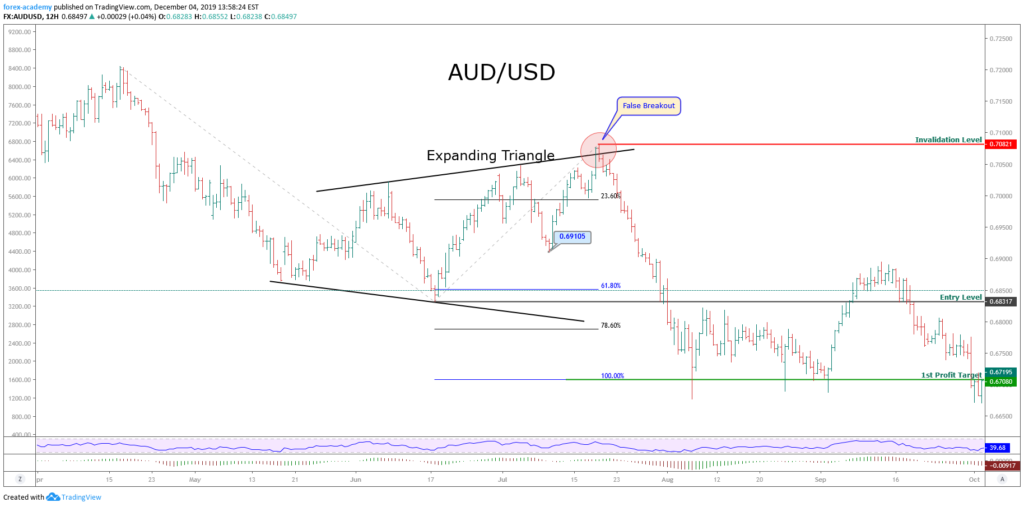
The following chart corresponds to the AUDUSD pair in its 12-hour timeframe. We can observe that the price action developed an expanding triangle formation, which began from mid-May 2019 and culminated in mid-July 2019.

From the chart, we detect that the expanding triangle reached its highest level at 0.70821, which corresponded to a false breakout. Subsequently, the price action resolved the next movement with a drop that took it to plunge until 0.66771.

The sell-side entry was activated once the price closed below the lowest level of the expanding triangle at 0.68317. Once activated the sales position, the price reached the first target at 0.67080.

Another possibility of entry that could be considered would be the closing below the last relevant swing, that is, the closing below 0.69105. This option could provide the trader with a higher profit compared to the risk taken compared to the original entry setup.

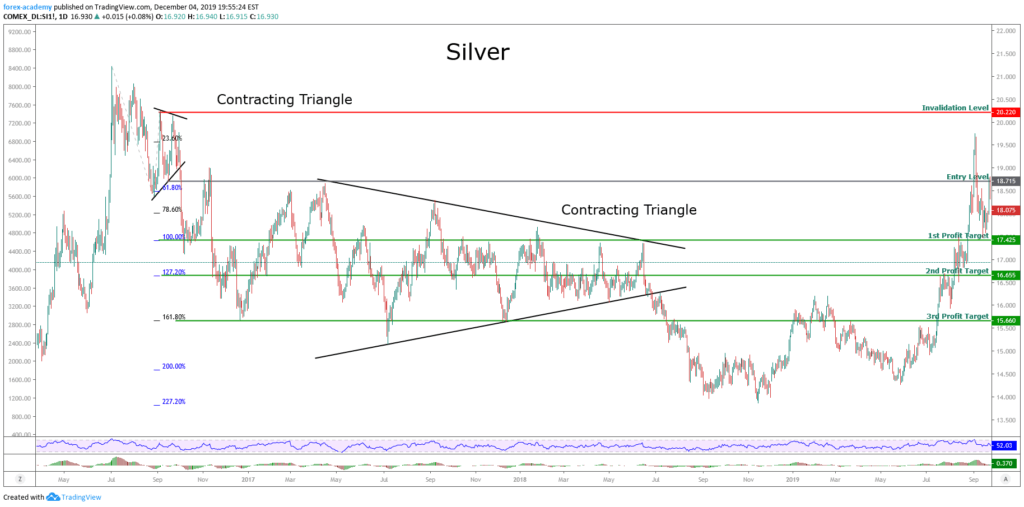
The next example corresponds to Silver in its daily chart. From the figure, we observe that the price made a record high early July 2016, reaching $21,225 per ounce, after this, the price action performed a corrective movement, once its found support, Silver built a tight contractive triangle.

After breaking below $18,715, Silver activated a bearish scenario that drove the price to fall to the third bearish target at $15.66 per ounce.

After having fulfilled the third bearish target, the price fell and reached $18.435 on April 17, 2017, where Silver began to build a contractive triangular structure that lasted until the end of June 2018.

Once the downward break of the long-lasting triangle occurred, we see that the price made a limited downward movement, which did not yield below $14 per ounce.

Conclusion

Based on the discussion of this article, we can conclude that regardless of the corrective structures that have three or five internal waves, these can be simplified as triangular patterns. Also, we can observe that a corrective wave or a short-range narrow triangle is likely to have an extended move that, in terms of Elliott’s wave theory, could correspond to an extended wave.

On the other hand, extensive triangular formations, or of a wide range, could lead the price to move in a range not as broad as in the previous case.

Finally, in the last example, we recognize how the alternation principle works in Elliott’s wave theory. Just as the first observed triangle is simple, and has a short duration, and the second corrective formation is extensive and complex.

Categories
Forex Harmonic

The Gartley Pattern

Harmonic Pattern: Bearish Gartley

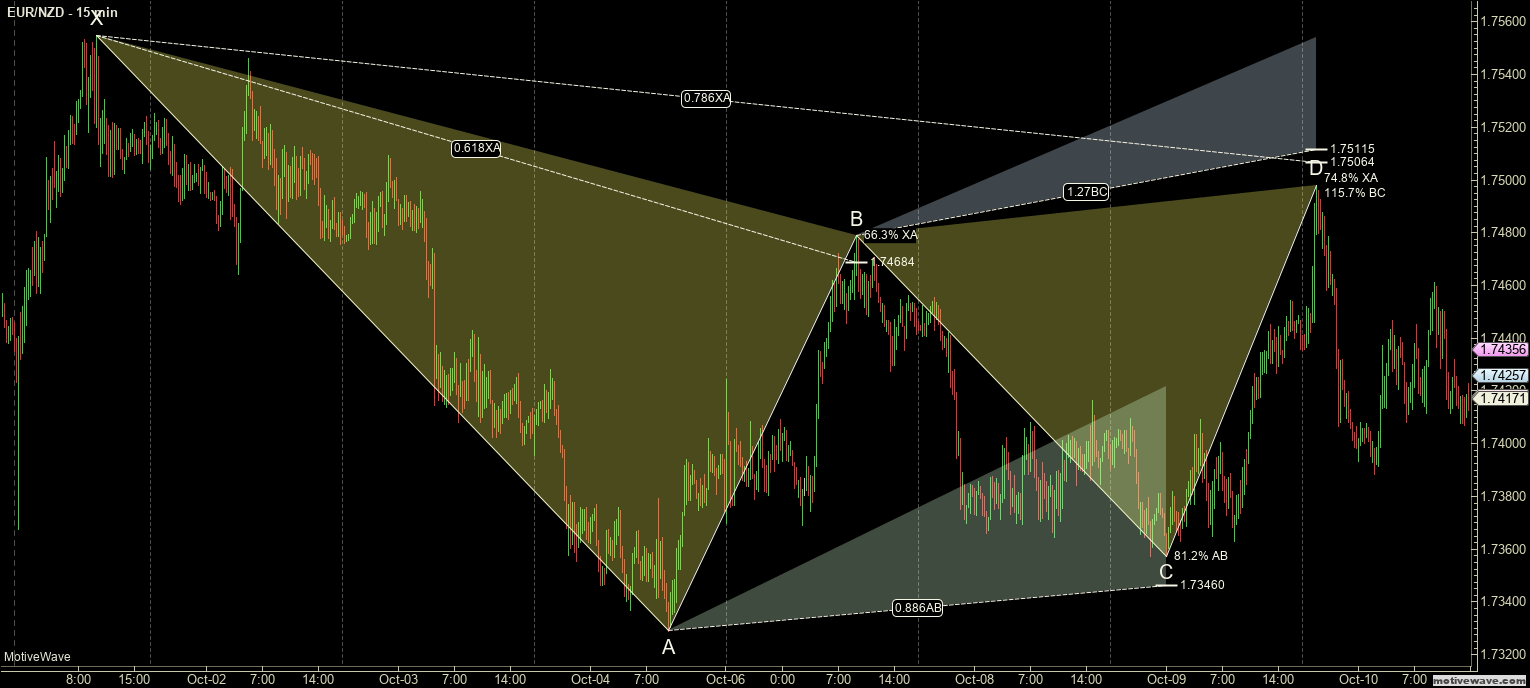
The Gartley is probably the most well-known pattern in Gartley Harmonics. Gartley himself said that this pattern represents one of the best trading opportunities. Its profitability remains exceptionally resilient. This is especially true when we consider how old the pattern is and how it has remained profitable in these contemporary trading environments. Pesavento reported (at least I think he was the one who wrote this statistic) that it is profitable seven out of ten times and has remained that way for over 80 years. It is important to remember that all harmonic patterns have stringent ruleset. There is no room for interpretation in the construction of any pattern, and the Gartley pattern is no different.

Rules

  1. D cannot exceed X.
  2. C cannot exceed A.
  3. B cannot exceed X.

Characteristics

  1. X is the high or low of a swing.
  2. It is impossible to project or determine A.
  3. Main Fibonacci levels are 38.2%, 50%, 61.8% and 78.6%.
  4. Precise 61.7% retracement XA for B.
  5. BC projections have two specific Fibs: 127% or 161.8%.
  6. The BC projection must not exceed 161.8%.
  7. Symmetrical AB=CD patterns are frequent.
  8. C retracement has a wide range between 38.2% and 88.6%.
  9. An exact D retracement is 78.6% of the XA move.

Sources: Carney, S. M. (2010). Harmonic trading. Upper Saddle River, NJ: Financial Times/Prentice Hall Gartley, H. M. (2008). Profits in the stock market. Pomeroy, WA: Lambert-Gann Pesavento, L., & Jouflas, L. (2008). Trade what you see: how to profit from pattern recognition. Hoboken: Wiley