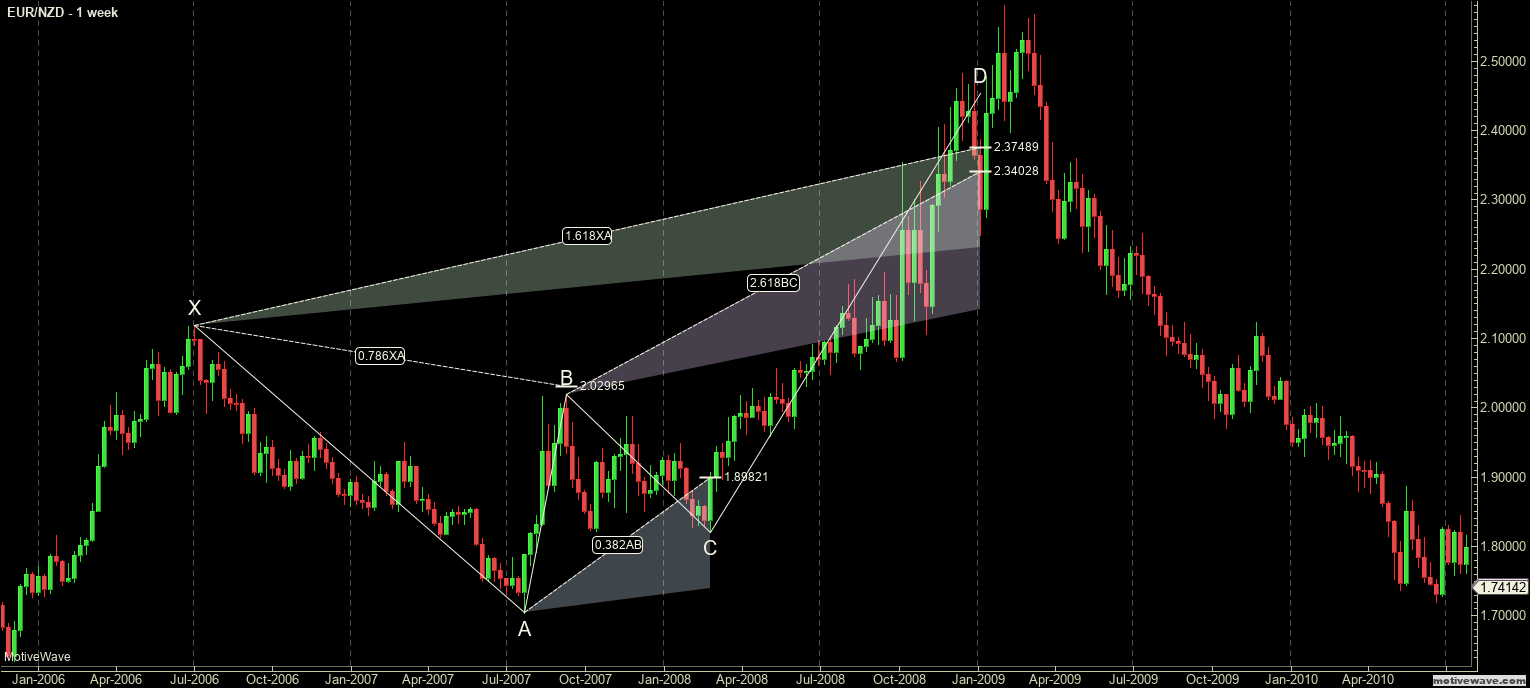
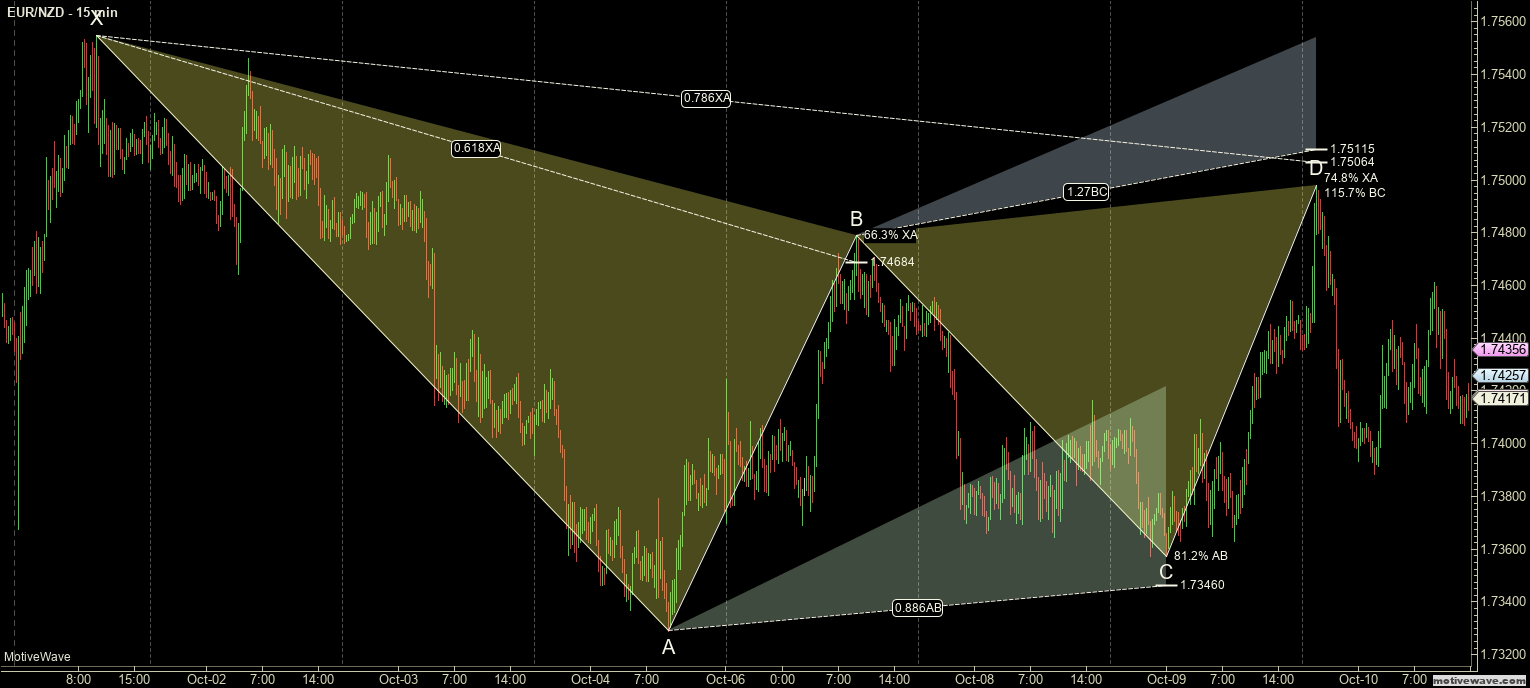
Butterfly Harmonic Pattern Example: Bearish Butterfly
The Butterfly
The Butterfly pattern is a harmonic pattern discovered by Bryce Gilmore. Gilmore is the author of Geometry or Markets (now in its 4th Edition, initially published in 1987)– a must-read for those interested in harmonics patterns. He is the creator of his proprietary software called WaveTrader. The Butterfly is one of the most potent harmonic patterns because of the nature of where it shows up. Both Carney and Pesavento stress that this pattern typically shows the significant highs and significant lows of a trend. In fact, in utilizing multiple time frame analysis, it is not uncommon to see several Butterfly patterns show up in various timeframes all at the end of a trend (example: the end of a bull trend can show a bearish butterfly on a daily chart with a 4-hour and 1-hour chart showing a bearish butterfly ending at the same time). This pattern is an example of an extension pattern and is generally formed when a Gartley pattern (the Gartley Harmonic pattern) is invalidated by the CD wave moving beyond X. From a price action perspective, this is the kind of move where one would ‘assume’ a new high or low should be established, but extreme fear or greed takes over and causes prices to accelerate in both volume and price to end a trend.
Failure, Symmetry, and Thrust
Pesavento identified three crucial characteristics of the Butterfly pattern.
Thrust – C should be observed as an indicator of whether a Gartley or Butterfly pattern will form. He indicated specific Fibonacci levels that are important for gaps – but that is important for equity markets that are rife with gaps. That is not important for us in Forex markets (gaps in Forex are rare intra-week and typically form only on the Chicago Sunday open, Forex also has an extremely high degree of gaps filling). He noted that thrusts out of the CD wave point to a high probability of new 161.8% extensions rather than a 127.2% extension.
Symmetry – The slope of the AB and CD wave in the AB=CD should be observed strictly. Depending on how steep the angle is on the CD wave, this could indicate a Butterfly pattern is going to be formed. Pesavento also noted that the number of bars should be equal (10 bars in AB should also be 10 bars in CD). Regarding the steepness of the CD wave, this is where Gann can become instrumental. In my trading, and depending on the instrument and market, I utilize Gann’s various Squares (Square of 144, Square of 90, Square of 52, etc.). If you use a chart that is properly squared in price and time, there is very little ambiguity involved in identifying the speed of the slope of a CD wave.
Failure Signs – Very merely put, Pesavento called for close attention to any move that extends beyond the 161.8% XA expansion. And this is an excellent point because one of the most dangerous things we can do as traders is an attempt to put to much weight on a specific style of analysis. It’s easy to think, ‘well, the Butterfly pattern is strong, so if it completes that must be the high or low.’ That is a very foolish and dangerous assumption to make. When markets, even Forex, make new highs or lows in their respective trends, that is generally a sign of strength. So while the Butterfly pattern does indicate the end of a trend – common sense confirmation is still required. The Butterfly pattern should help confirm the end of a trend, not define it.
The Five Negations
Continuing on with the great work of Pesavento and Jouflas, they identified five conditions that would invalidate a Butterfly pattern:
- No AB=CD in the AD wave.
- A move beyond the 261.8% extension.
- B above X (sell) or B below X (buy).
- C above A or C Below A, respectively.
- D must extend beyond X.
Ideal Butterfly Pattern Conditions
Carney identified six ideal conditions for a Butterfly pattern. You will note that the combination of Pesavento and Jouflas’s work greatly compliments Carney’s.
- Precise 78.6% retracement of B from the XA wave. The 78.6% B retracement is required.
- BC must be at least 161.8%.
- AB=CD is required – the Alternate 127% AB=CD is the most common.
- 127% projection is the most critical number in the PRZ (Potential Reversal Zone).
- No 161.8% projection.
- C should be within its 38.2% to 88.6% Fibonacci retracement.
Sources: Carney, S. M. (2010). Harmonic trading. Upper Saddle River, NJ: Financial Times/Prentice Hall. Gilmore, B. T. (2000). Geometry of markets. Greenville, SC: Traders Press. Pesavento, L., & Jouflas, L. (2008). Trade what you see: how to profit from pattern recognition. Hoboken: Wiley.


