Categories
Ichimoku

Ichimoku Strategy #2 – K-Cross, The Day Trading Strategy

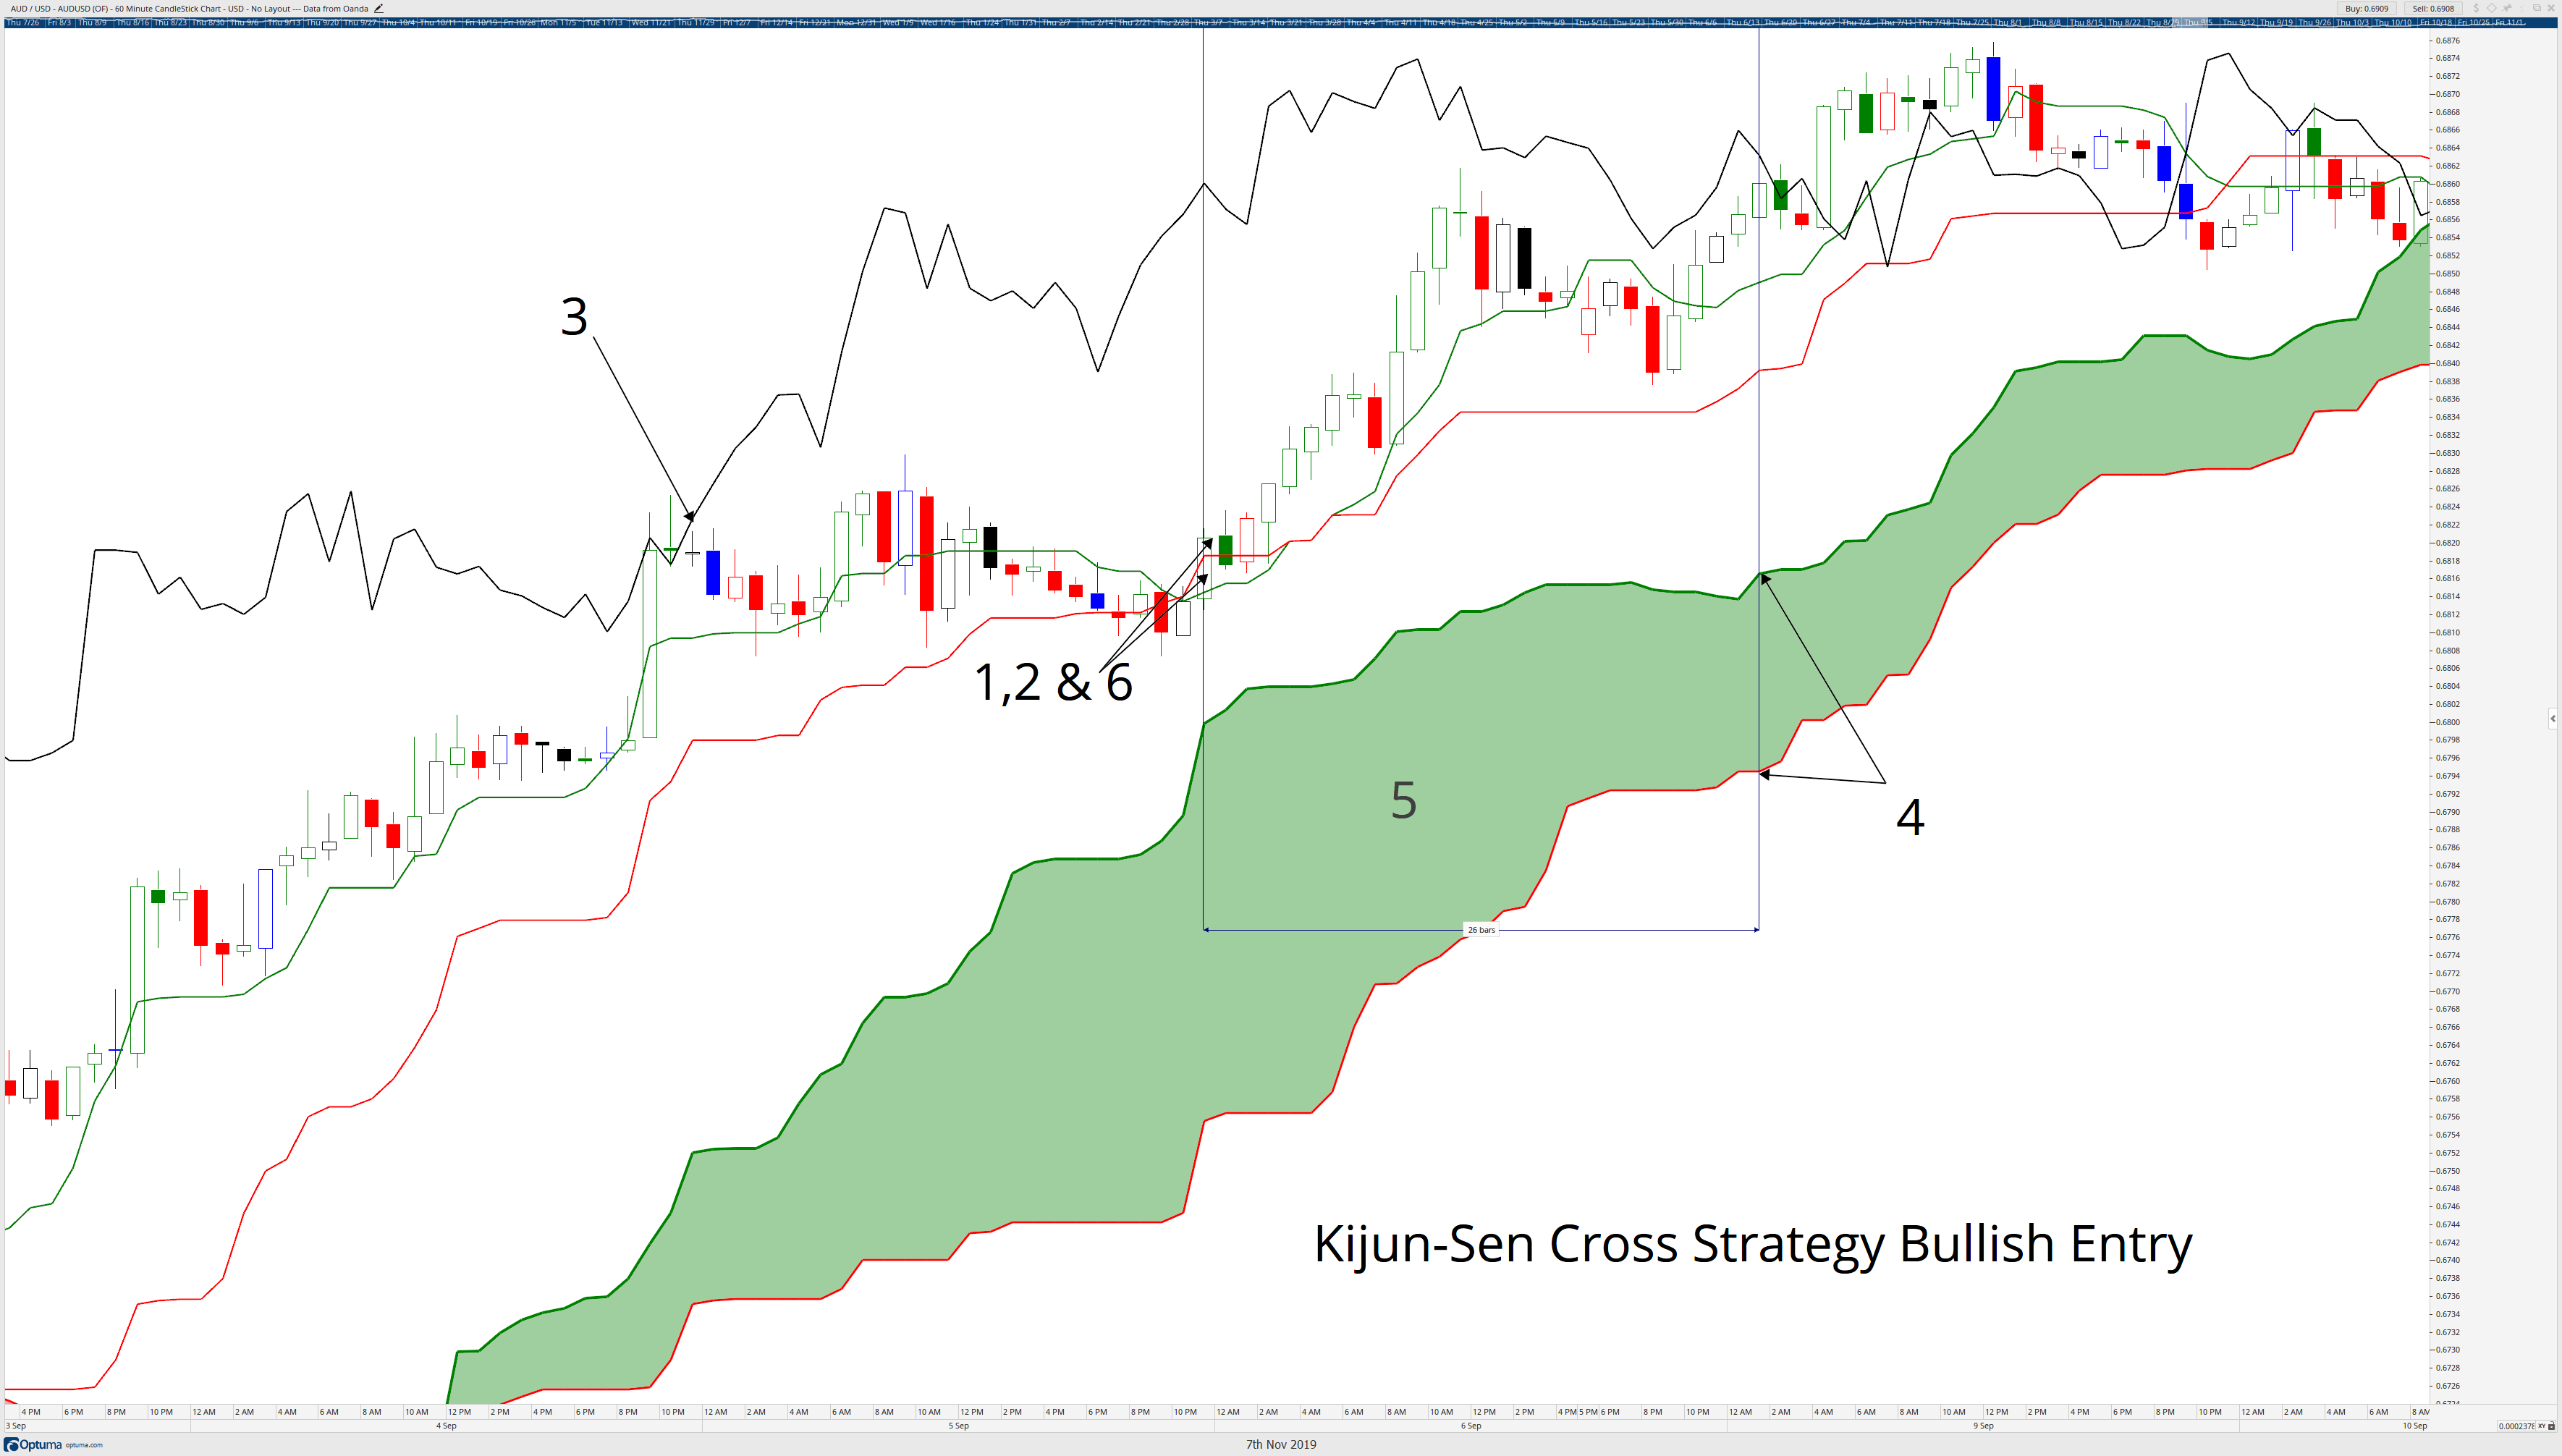
The Kijun-Sen Crossover (Crossunder) Strategy is the second in my series over Ichimoku Kinko Hyo. There are two trades setups provided for the long and short side of a market. This strategy also comes from Manesh Patel’s book, Trading with Ichimoku Clouds: The essential guide to Ichimoku Kinko Hyo technical analysis.

Patel called this the day-trading strategy. He warned that this trading strategy has the lowest risk factor out of all of his strategies. The positive expectancy rate is lower, and so being stopped out of trades is a normal consequence of this strategy. He also indicated that the win/loss ratio could be extremely high.

Kijun-Sen Cross Bullish Rules

  1. Price crosses above the Kijun-Sen.
  2. Tenkan-Sen greater than the Kijun-Sen.
    1. If the Tenkan-Sen is less than the Kijun-Sen, then the Tenkan-Sen should be pointing up while the Kijun-Sen is flat.
  3. Chikou Span in open space.
  4. Future Senkout Span B is flat or pointing up.
    1. If Future Senkou Span A is less than Future Senkou Span B, then Future Senkou Span A must be pointing up.
  5. Price, Tenkan-Sen, Kijun-Sen, and Chikou Span should not be in the Cloud. If they are, it should be a thick cloud.
  6. Price not far from the Tenkan-Sen or Kijun-Sen
  7. Optional: Future Cloud is not thick.
K-Cross Strategy Bullish Entry


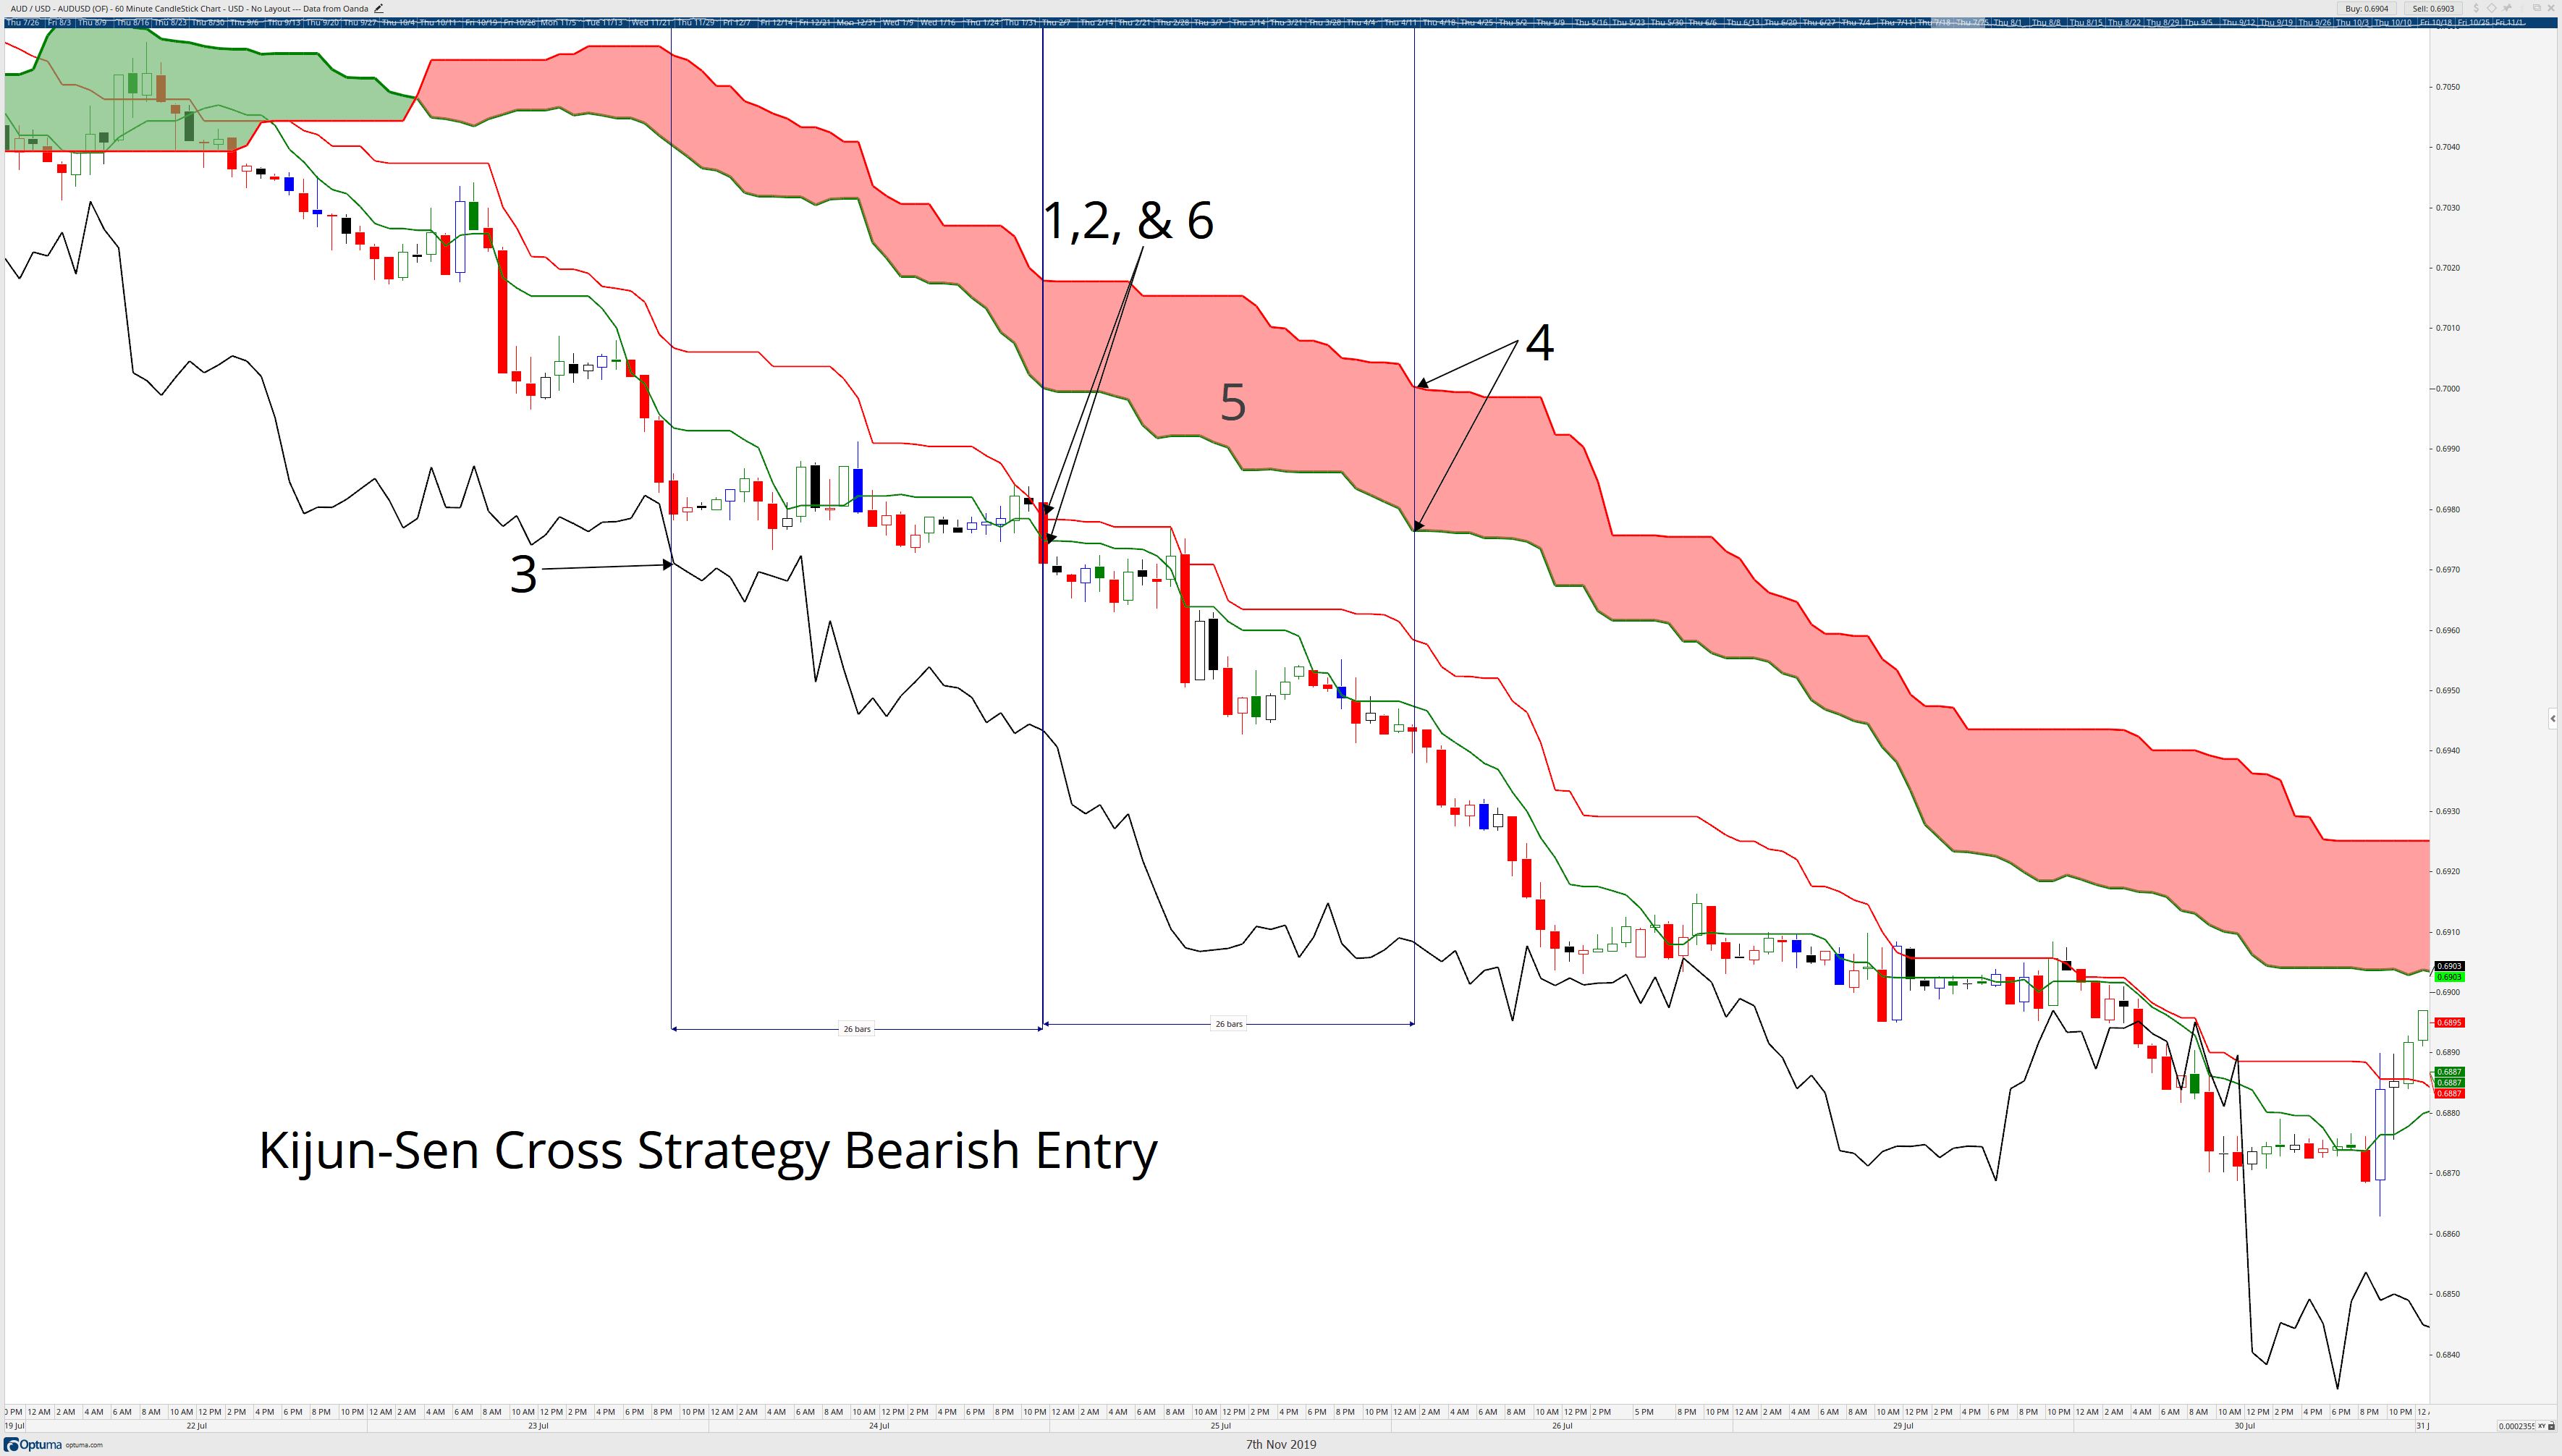
Kijun-Sen Cross Bearish Rules

  1. Prices cross below the Kijun-Sen.
  2. Tenkan-Sen less than the Kijun-Sen.
    1. If the Tenkan-Sen is less than the Kijun-Sen, then the Tenkan-Sen should be pointing up while the Kijun-Sen is flat.
  3. Chikou Span in open space.
  4. Future Senkou Span B is flat for pointing down.
    1. If Future Senkou Span A is greater than Future Senkou Span B, then Future Senkou Span A must be pointing down.
  5. Price, Tenkan-Sen, Kijun-Sen, and Chikou Span should not be in the Cloud. If they are, it should be a thick Cloud.
  6. Price not far from the Tenkan-Sen or Kijun-Sen
  7. Optional: Future Cloud is not thick.
K-Cross Strategy Bearish Entry


Sources: Péloille Karen. (2017). Trading with Ichimoku: a practical guide to low-risk Ichimoku strategies. Petersfield, Hampshire: Harriman House Ltd.

Patel, M. (2010). Trading with Ichimoku clouds: the essential guide to Ichimoku Kinko Hyo technical analysis. Hoboken, NJ: John Wiley & Sons.

Linton, D. (2010). Cloud charts: trading success with the Ichimoku Technique. London: Updata.

Elliot, N. (2012). Ichimoku charts: an introduction to Ichimoku Kinko Clouds. Petersfield, Hampshire: Harriman House Ltd.

Categories
Forex Harmonic

The Gartley Pattern

Harmonic Pattern: Bearish Gartley

The Gartley is probably the most well-known pattern in Gartley Harmonics. Gartley himself said that this pattern represents one of the best trading opportunities. Its profitability remains exceptionally resilient. This is especially true when we consider how old the pattern is and how it has remained profitable in these contemporary trading environments. Pesavento reported (at least I think he was the one who wrote this statistic) that it is profitable seven out of ten times and has remained that way for over 80 years. It is important to remember that all harmonic patterns have stringent ruleset. There is no room for interpretation in the construction of any pattern, and the Gartley pattern is no different.

Rules

  1. D cannot exceed X.
  2. C cannot exceed A.
  3. B cannot exceed X.

Characteristics

  1. X is the high or low of a swing.
  2. It is impossible to project or determine A.
  3. Main Fibonacci levels are 38.2%, 50%, 61.8% and 78.6%.
  4. Precise 61.7% retracement XA for B.
  5. BC projections have two specific Fibs: 127% or 161.8%.
  6. The BC projection must not exceed 161.8%.
  7. Symmetrical AB=CD patterns are frequent.
  8. C retracement has a wide range between 38.2% and 88.6%.
  9. An exact D retracement is 78.6% of the XA move.

Sources: Carney, S. M. (2010). Harmonic trading. Upper Saddle River, NJ: Financial Times/Prentice Hall Gartley, H. M. (2008). Profits in the stock market. Pomeroy, WA: Lambert-Gann Pesavento, L., & Jouflas, L. (2008). Trade what you see: how to profit from pattern recognition. Hoboken: Wiley

Categories
Forex Harmonic

AB=CD Pattern

AB=CD Pattern

Bearish AB=CD Harmonic Pattern
Bullish AB=CD Harmonic Pattern

The AB=CD Harmonic Pattern is the most basic and common pattern in harmonic geometry. It is the building block of all other patterns. It is the ‘bread and butter’ pattern. Pesavento and Carney recommended that this pattern should be learned first – and reading this article does not qualify for having learned this pattern. Like any form of analysis, you will need to regularly and consistently train your brain and eyes to find this pattern. You won’t be able to get very far in the study of harmonic patterns until you can see this pattern just by glancing at a chart.

Rules

  1. BC cannot exceed AB.
  2. D must exceed B to form a completed AB=CD pattern.

Characteristics

  1. CD is an extension of AB, generally from the Fibonacci ratio of 1.27% to 2.00%.
  2. CD’s slope is steep or longer/wider than AB.
  3. BC often corrects to the Fibonacci ratios of 38.2%, 50%, 61.8%, or 78.6%.


AB=CD Pattern Reciprocal Ratios

Point C Retracement BC Projection
38.2% 24% or 261.8%
50% 200%
61.8% 161.8%
70.7% 141%
78.6% 127%
88.6% 113%


Sources: Carney, S. M. (2010). Harmonic trading. Upper Saddle River, NJ: Financial Times/Prentice Hall Gartley, H. M. (2008). Profits in the stock market. Pomeroy, WA: Lambert-Gann Pesavento, L., & Jouflas, L. (2008). Trade what you see: how to profit from pattern recognition. Hoboken: Wiley