Categories
Chart Patterns Forex Trading Guides

Chart Patterns: Start Here

Chart Patterns: Start Here

Something that I stress repeatedly throughout our series on chart patterns is the difference between traditional markets like the stock market and the forex market. I’m sure a good number of readers have spent time reading books on technical analysis and have recorded and have seen various statistics regarding the performance of the various chart patterns that exist. There’s a big problem that exists in the realm of technical analysis and its use in forex markets, and that is related to nearly 100% of all technical analysis trading material focused on the stock market. Why is this a problem? Several reasons.

  1. Statistical performance values for chart patterns based on the pattern’s performance in the stock market is overwhelmingly long-biased: the stock market has been in a bull market for over a decade.
  2. Forex markets do not ‘trend’ in the traditional sense of financial analysis, they range.

In a nutshell, just because a particular pattern in the stock market may not perform that well in the forex market, it does not mean that its performance isn’t positive in forex. I’ve learned that most underperforming chart patterns in the stock market perform very well in forex markets. As always, make sure you do your own due diligence and research – investigate each pattern for yourself and see how they play out in your own trading.

To begin learning about Chart Patterns, follow this series of education articles.

Chart Patterns: Pullbacks and Throwbacks

Chart Patterns: Symmetrical Triangles

Chart Patterns: Ascending Triangles

Chart Patterns: Descending Triangles

Chart Patterns: Head-And-Shoulder Patterns

Chart Patterns: Broadening Patterns


Sources:

Kirkpatrick, C. D., & Dahlquist, J. R. (2016). Technical analysis: the complete resource for financial market technicians. Upper Saddle River: Financial Times/Prentice Hall.

Bulkowski, T. N. (2013). Visual guide to chart patterns. New York, NY: Bloomberg Press.

Bulkowski, T. N. (2008). Encyclopedia of candlestick charts. Hoboken, NJ: J. Wiley & Sons.

Bulkowski, T. N. (2002). Trading classic chart patterns. New York: Wiley.


Categories
Chart Patterns

Chart Patterns: Flags and Pennants

Flags and Pennants

If you’ve ever traded a chart and you’ve seen what looks like a reversal in the trend, but as soon as you enter the trend seems to continue, odds are you were trading against a continuation pattern. Flags and pennants are titles given to patterns that show up as small countertrend moves that ultimately trap participants and then use their momentum to keep the price moving in the direction of the trend. Flags are represented as rectangular channels, and pennants are represented as triangles.

Before a flag or pennant can be identified, we first need a flag pole. A flag pole is any clear trending price action that, well, looks like a pole. See below:

Flags and Pennants
Flags and Pennants


The images above show examples of bearish flags and bearish pennants, as well as bullish flags and bullish pennants. If you are unfamiliar with how to trade triangles or rectangles, refer to the articles that discuss the various triangle patterns. But we can review the basics of entering these great continuation patterns.

Bearish Pennant
Bearish Pennant
Bear Flag
Bear Flag
Bullish Pennant
Bullish Pennant
Bull Flag
Bull Flag


Learning how to trade flags and pennants is one of the most useful and enjoyable things that you can learn – especially as a new trader. Flags and pennants help train your brain to get used to buying dips during bull runs and shorting rallies during bear moves. If you get to a point where you can profitably trade flags and pennants, then you have transitioned into a trader who is very near outperforming the vast majority of your peers. It may seem like an easy thing to do – but it is an entirely different thing to execute. Analyzing and identifying a flag or pennant is easy; trading it is difficult.

I can not stress enough how profitable these patterns can be – and how easily you can miss them even in plain sight. The problem resides with your brain – that ‘lizard’ part that kicks in when you are are fearful of your account. When you begin to feel the fear of your account losing money, that triggers a powerful part of your brain known as the limbic system. The limbic system controls fear and pleasure. And when your fear sense is triggered, it hyper focuses the synapsis across your brain. Things that you would passively identify like flags and pennants are tertiary in their importance when the limbic system is acting in your defense. You need to find ways to ‘pause’ the process with things like alerts. On the images above, you saw horizontal lines above prior swing highs and below prior swing lows. Placing alerts at those points may be enough to interrupt your primary fear response and allow you to make money on your emotions.

Because if you are feeling it, so is everyone else.


Sources:

Kirkpatrick, C. D., & Dahlquist, J. R. (2016). Technical analysis: the complete resource for financial market technicians. Upper Saddle River: Financial Times/Prentice Hall.

Bulkowski, T. N. (2013). Visual guide to chart patterns. New York, NY: Bloomberg Press.

Bulkowski, T. N. (2008). Encyclopedia of candlestick charts. Hoboken, NJ: J. Wiley & Sons.

Bulkowski, T. N. (2002). Trading classic chart patterns. New York: Wiley.

Categories
Forex Harmonic Forex Trading Guides

Harmonic Pattern Guide – Walkthrough

 Harmonic Pattern – Walkthrough

Bearish Butterfly Pattern against 180-degree Square of 9 angle.

The chart above is the AUDJPY Forex pair on its 6-hour chart. If you are unable to identify this pattern without referencing notes or the prior articles, you are not ready to use this form of technical analysis. Regardless, the pattern above is a Bearish Butterfly Pattern.

Harmonic Patterns are by there very nature indicative of imminent price reversals. The PRZ (Potential Reversal Zone) is, in my opinion, the most critical level when determining whether to utilize a Harmonic Pattern in my trading. A Harmonic Pattern itself is not a sufficient enough form of analysis to decide whether or not to take a trade. Harmonic Patterns, in my opinion, should not be used as a primary form of analysis, but rather a complementary or confirmatory form of analysis. The chart above is an excellent example of this.

The horizontal levels on AUDJPY’s chart are derived from W.D. Gann’s Square of 9 – natural number values that represent angles. The methods and theories in Gann Analysis are an entirely different topic and require years of study and research – but for this article, one component of his work will help make my point. The red horizontal line at the top is a 180-degree Square of 9 angle. The 180-degree Square of 9 angle is already a strong and naturally powerful level of resistance. When I see price is near the 180-degree Square of 9 angle, I know one thing is for sure:

There is a high probability that the AUDJPY will have difficulty crossing this level and a high probability of price, at least initially, being rejected from moving higher.

So I would naturally look to be taking a short trade if the market shows rejection at that level. That is where the presence of a Harmonic Pattern is desirable. The Bearish Butterfly Pattern is one of the most reliable and most powerful reversal patterns in all Scott Carney’s work. I know that the Butterfly Pattern typically shows up at the end of a swing – not necessarily a trend, but the end of a swing. If I see a Bearish Butterfly Pattern, I know one thing is for sure:

The Bearish Butterfly Pattern is a reversal pattern. I also understand that the Bearish Butterfly Pattern appears at the top of a swing, indicating an extended and overdone market.

After seeing price approach, the naturally strong reversal level of the 180-degree Square of 9 angle, and then the completion of a Bearish Butterfly Pattern, I believe that there is a sufficient amount of analysis to risk taking a short trade. A short trade is further validated by the completion of a bearish engulfing candlestick, as well as some lengthily bearish divergence on the RSI.


Categories
Ichimoku

Ichimoku Strategy #2 – K-Cross, The Day Trading Strategy

The Kijun-Sen Crossover (Crossunder) Strategy is the second in my series over Ichimoku Kinko Hyo. There are two trades setups provided for the long and short side of a market. This strategy also comes from Manesh Patel’s book, Trading with Ichimoku Clouds: The essential guide to Ichimoku Kinko Hyo technical analysis.

Patel called this the day-trading strategy. He warned that this trading strategy has the lowest risk factor out of all of his strategies. The positive expectancy rate is lower, and so being stopped out of trades is a normal consequence of this strategy. He also indicated that the win/loss ratio could be extremely high.

Kijun-Sen Cross Bullish Rules

  1. Price crosses above the Kijun-Sen.
  2. Tenkan-Sen greater than the Kijun-Sen.
    1. If the Tenkan-Sen is less than the Kijun-Sen, then the Tenkan-Sen should be pointing up while the Kijun-Sen is flat.
  3. Chikou Span in open space.
  4. Future Senkout Span B is flat or pointing up.
    1. If Future Senkou Span A is less than Future Senkou Span B, then Future Senkou Span A must be pointing up.
  5. Price, Tenkan-Sen, Kijun-Sen, and Chikou Span should not be in the Cloud. If they are, it should be a thick cloud.
  6. Price not far from the Tenkan-Sen or Kijun-Sen
  7. Optional: Future Cloud is not thick.
K-Cross Strategy Bullish Entry


Kijun-Sen Cross Bearish Rules

  1. Prices cross below the Kijun-Sen.
  2. Tenkan-Sen less than the Kijun-Sen.
    1. If the Tenkan-Sen is less than the Kijun-Sen, then the Tenkan-Sen should be pointing up while the Kijun-Sen is flat.
  3. Chikou Span in open space.
  4. Future Senkou Span B is flat for pointing down.
    1. If Future Senkou Span A is greater than Future Senkou Span B, then Future Senkou Span A must be pointing down.
  5. Price, Tenkan-Sen, Kijun-Sen, and Chikou Span should not be in the Cloud. If they are, it should be a thick Cloud.
  6. Price not far from the Tenkan-Sen or Kijun-Sen
  7. Optional: Future Cloud is not thick.
K-Cross Strategy Bearish Entry


Sources: Péloille Karen. (2017). Trading with Ichimoku: a practical guide to low-risk Ichimoku strategies. Petersfield, Hampshire: Harriman House Ltd.

Patel, M. (2010). Trading with Ichimoku clouds: the essential guide to Ichimoku Kinko Hyo technical analysis. Hoboken, NJ: John Wiley & Sons.

Linton, D. (2010). Cloud charts: trading success with the Ichimoku Technique. London: Updata.

Elliot, N. (2012). Ichimoku charts: an introduction to Ichimoku Kinko Clouds. Petersfield, Hampshire: Harriman House Ltd.

Categories
Forex Harmonic

The 5-0 Harmonic Pattern

Harmonic Pattern Example: Bearish 5-0 Harmonic Pattern

The 5-0 Harmonic Pattern

Like the Shark Pattern, the 5-0 pattern is a relatively new pattern discovered by the great Scott Carney. Carney revealed this pattern in his second book in his harmonic series, Harmonic Trading: Volume Two.

The 5-0 pattern is easily one of the wonkiest looking patterns. Depending on where you are at with your knowledge of harmonic patterns, the 5-0 will look foreign. And this is primarily because the 5-0 Pattern starts a 0. If you are used to seeing XABCD,  then 0XABCD will undoubtedly look odd.

5-0 Elements

  1. The pattern begins (begins with 0) at the beginning of an extended price move (direct quote from Carney’s work).
  2. After 0 has been established, an impulse reversal at X, A, and B must possess a 113 – 161.8% extension.
  3. The projection off of AB has a 161.8% extension requirement to C. C can move beyond the 161.8% extension but not beyond 224%.
  4. D is the 50% retracement of BC and is equal to AB (a Reciprocal AB=CD Pattern).
  5. The reciprocal AB=CD is required.

One of the best ways to interpret this pattern is to view it from an exasperated trader’s point of view. If we take the Bullish 5-0 Pattern as an example, then we can see why. The AB leg ends with B below X, creating a lower low. We then get an extended move in time where the BC leg is the most prolonged move with C ending above A. The movement from B to C may take on the appearance of a bear flag or bearish pennant. C to D shows intense shorting pressure and a belief among bears that new lows are going to be found. Instead, we get to D – the 50% retracement of BC. Instead of new lower lows, we get a confirmation swing creating a higher low. That move will more than likely generate a brand new trend reversal or significant corrective move.


Sources: Carney, S. M. (2010). Harmonic trading. Upper Saddle River, NJ: Financial Times/Prentice Hall.  Gilmore, B. T. (2000). Geometry of markets. Greenville, SC: Traders Press.  Pesavento, L., & Jouflas, L. (2008). Trade what you see: how to profit from pattern recognition. Hoboken: Wiley.

Categories
Forex Harmonic

The Deep Crab Pattern

Harmonic Pattern Example: Bearish Deep Crab

The Deep Crab Pattern    

The Deep Crab is a variant of the regular Crab pattern. It is still a 5-point extension, and it still has the endpoint (D) at the 161.8% extension of XA, but the AB=CD importance is a little different.

The most distinguishing component of this pattern is the importance of the specific 88.6% retracement point of B. Along with the Crab Pattern, the Deep Crab Pattern presents an especially extended and long move towards D.

Carney stressed that the Crab and Deep Crab represent significant overbought and oversold conditions, and reaction after completion is often sharp and quick. It is the opinion of many traders and analysts that the Crab Pattern and Deep Crab represent some of the fastest and profitable patterns out of all harmonic patterns.

Deep Crab differences from the Crab

  1. BC leg projection is not as extreme as the Crab.
  2. B must be at least an 88.6% retracement. Common to move more than 88.6% retracement level not above/below X (not above X in a Bearish Deep Crab and not below X in a Bullish Deep Crab).
  3. AB=CD pattern variations are more important in the Deep Crab Pattern.
  4. The BC leg is a minimum of 224% but can extend to 361.8%.

Sources: Carney, S. M. (2010). Harmonic trading. Upper Saddle River, NJ: Financial Times/Prentice Hall.  Gilmore, B. T. (2000). Geometry of markets. Greenville, SC: Traders Press.  Pesavento, L., & Jouflas, L. (2008). Trade what you see: how to profit from pattern recognition. Hoboken: Wiley.

Categories
Forex Harmonic

The Cypher Pattern

The Cypher Pattern

The Cypher Pattern is another type of Harmonic Pattern – except it isn’t – but it is. This is one of the few patterns not identified by Scott Carney. Darren Oglesbee discovered this particular pattern.

This pattern is very similar to the Butterfly in both it’s construction and where it typically will occur (near the end of trends). However, the Cypher Pattern is a rare pattern and not one that shows up with a high amount of frequency. Don’t confuse rarity with being more powerful or profitable. I do not know enough about this pattern, nor have I had the opportunity to trade it enough to gauge it’s ‘power’ versus its peers. All I do know is that in the times I have traded it, its positive expectancy rate is high, no different than a Bat or Alternative Bat in my experience. The same goes for the Crab and Deep Crab, for that matter. Just like all of the other Harmonic Patterns that you will have learned about, the Cypher has specific rules and conditions that must be met for it to be a specified Cypher pattern.

Cypher Confirmation Conditions

  1. B must retrace to an expansive range between 38.2% and 61.8% of XA. At least 38.2% but not exceeding 61.8%
  2. C is an extension leg and moves beyond A – but must move to at least 127.2%, but it is normal for it to go as far as the 113% – 141.4%. It is considered invalid if it moves beyond the 141.4%
  3. CD leg should break the 78.6% level of XC.
  4. The PRZ (Potential Reversal Zone) of D is a wide range where the price must get to. Price can move anywhere between 38.2% to 61.8%.

I’ve created a simplified approach to how to ‘see’ this pattern.

Simplified Approach (Bullish Cypher)

  1. C must be higher than A.
  2. D must be less than B but greater than X.
  3. We should see a higher high (C > A) and a higher low (D > X).

Simplified Approach (Bearish Cypher)

  1. C must be less than A.
  2. D must be more than B but less than X.
  3. The same approach as above, reverse: lower high (D < X) and a lower low (C < A).

This pattern can be confusing (all harmonic patterns can be complicated), but in a nutshell, what we see happening with the Cypher pattern is the first pullback/throwback of a trend (B). After B, the small pullback/throwback of B occurs with the C leg. From a bullish perspective, when we see prices making lower highs and lower lows, but there is no follow-through shorting pressure, we should be on the lookout for some powerful and influential moves to occur in a very short period of time. It is not uncommon to see a bullish candle engulf several days of consolidation with this pattern.


Sources: Carney, S. M. (2010). Harmonic trading. Upper Saddle River, NJ: Financial Times/Prentice Hall.  Gilmore, B. T. (2000). Geometry of markets. Greenville, SC: Traders Press.  Pesavento, L., & Jouflas, L. (2008). Trade what you see: how to profit from pattern recognition. Hoboken: Wiley.

Categories
Forex Harmonic

The Crab Pattern

The Crab Pattern


The crab pattern is another of Carney’s harmonic patterns and one of the first that he discovered. The essential condition of this pattern is the extremely tight and resistance endpoint of 161.8% of the XA leg.

Like almost all harmonic patterns, the potential reversal in price action after this pattern has been complete is generally fast, violent and powerful. However, Carney gives special attention to this pattern and reports that it is usually the most extreme of all harmonic patterns.

The pattern is not as frequent as others due to its five-point extension structure. It is desirable to utilize an oscillator to filter entries of this pattern according to any divergence between price and your selected oscillator.

Crab Pattern Elements

  1. B must be a 61.8% retracements or less of XA.
  2. The BC projection can be quite extensive, generally 261.8%, 314%, or 3618%.
  3. An AB=CD 161.8% or an Alternate AB=CD 127% is required for the formation of this pattern.
  4. The extension of 161.8% of XA is the end limit of the pattern.
  5. C has an expansive range between 38.2% and 88.6%.

Sources: Carney, S. M. (2010). Harmonic trading. Upper Saddle River, NJ: Financial Times/Prentice Hall.  Gilmore, B. T. (2000). Geometry of markets. Greenville, SC: Traders Press.  Pesavento, L., & Jouflas, L. (2008). Trade what you see: how to profit from pattern recognition. Hoboken: Wiley.

Categories
Forex Harmonic

The Alternate Bat Pattern

Harmonic Pattern Example: Alternate Bat Bullish

The Alternate Bat Pattern

The Alternate Bat Pattern is another pattern by Scott M. Carney. This pattern comes from his second Volume Two in his Harmonic Trading series of books. He discovered this pattern roughly two years after (2003) his discovery of the Bat Pattern (2001). Carney wrote that ‘the origin of the alternate Bat pattern resulted from many frustrated and failed trades of the standard framework. The standard Bat pattern is defined by the B point that is less than a 0.618 retracement of the XA Leg.’ Essentially, with the Alternate Bat Pattern we observe an extension beyond the 88.6% level at D, where D moves slightly below X (in a bullish Bat) or above X (in a bearish Bat). I view Alternate Bats as classic and powerful bear traps and bull traps. And they are just plain nasty if you find yourself thinking that a new low means further downside movement and a continuation lower – but instead to you get whipsawed by a massive reversal.


Alternate Bat Elements

  • Whereas the 88.6% retracement is nearly singular to the Bat Pattern, the Alternate Bat Pattern utilizes the 113% retracement of XA to determine the endpoint.
  • B must be a 38.2% or less retracement of XA.
  • Minimum projection of 200%
  • The AB=CD pattern must be an extended AB=CD and often is a 161.8% level.
  • The pattern is potent when using a form of divergence detection, such as the Composite Index, to confirm the pattern.


Sources: Carney, S. M. (2010). Harmonic trading. Upper Saddle River, NJ: Financial Times/Prentice Hall.  Gilmore, B. T. (2000). Geometry of markets. Greenville, SC: Traders Press.  Pesavento, L., & Jouflas, L. (2008). Trade what you see: how to profit from pattern recognition. Hoboken: Wiley.

Categories
Forex Harmonic

The Butterfly Pattern

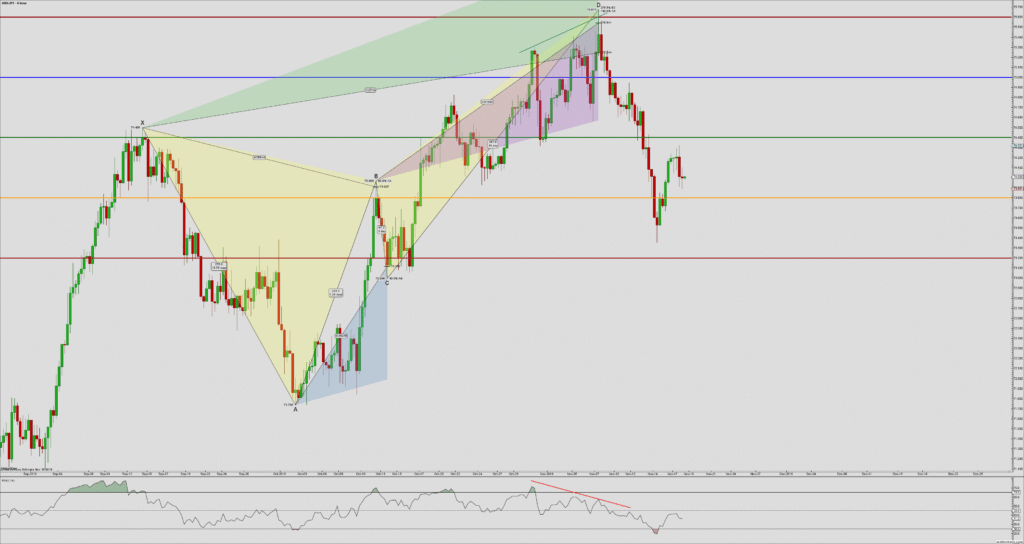
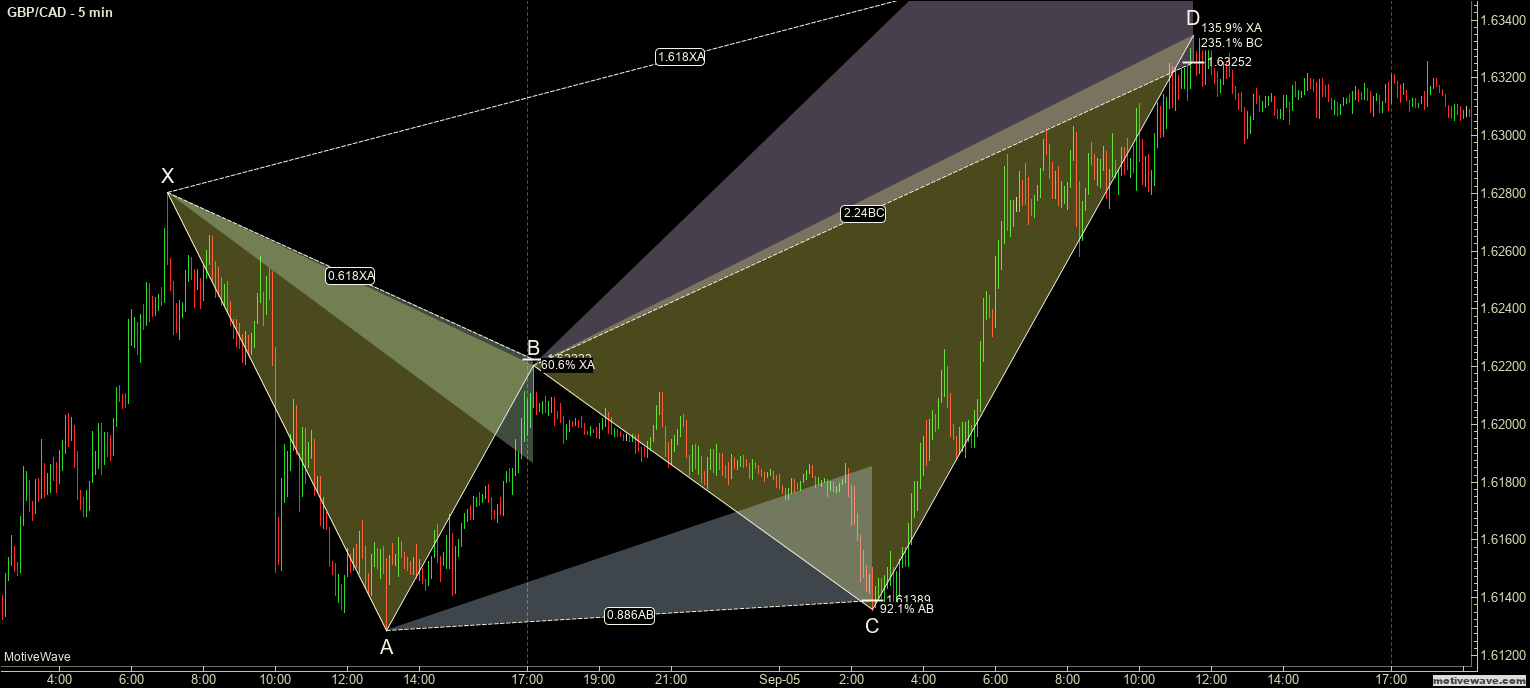
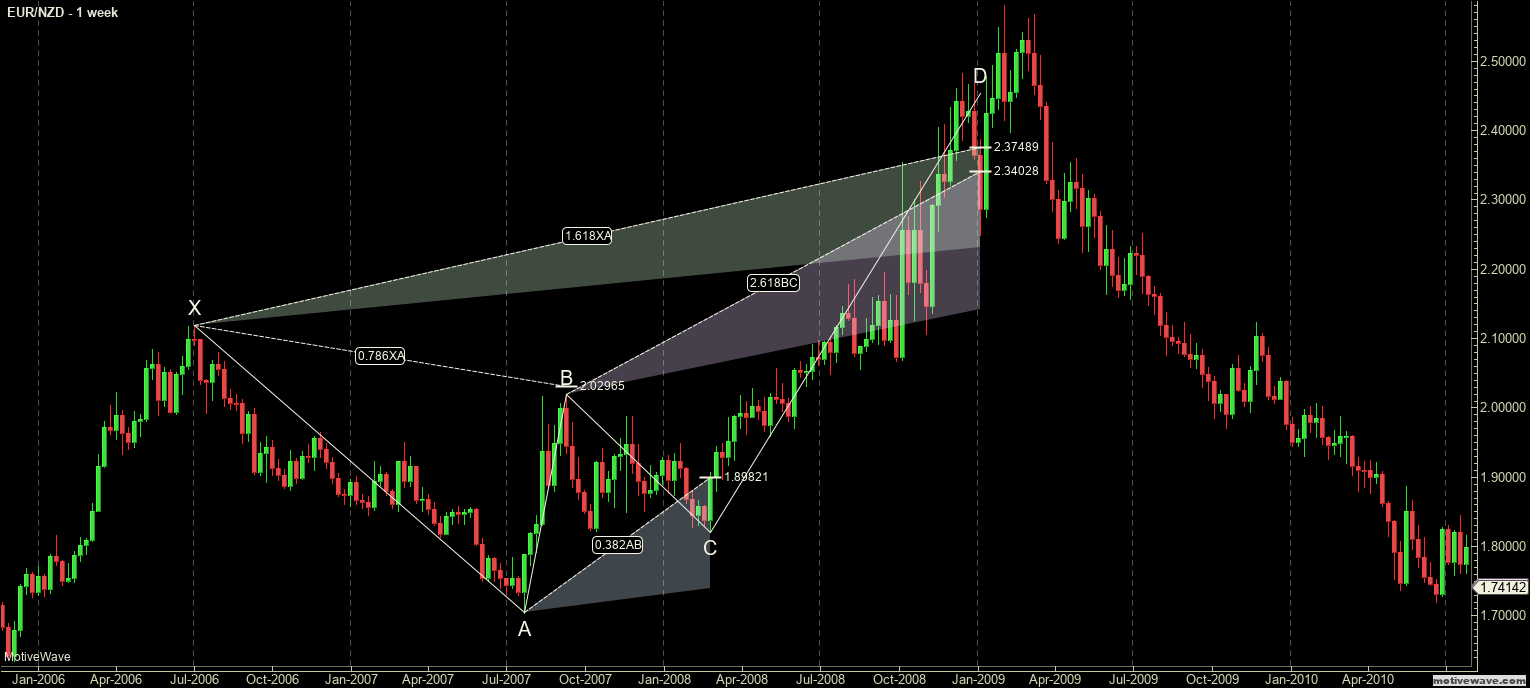
Butterfly Harmonic Pattern Example: Bearish Butterfly

The Butterfly

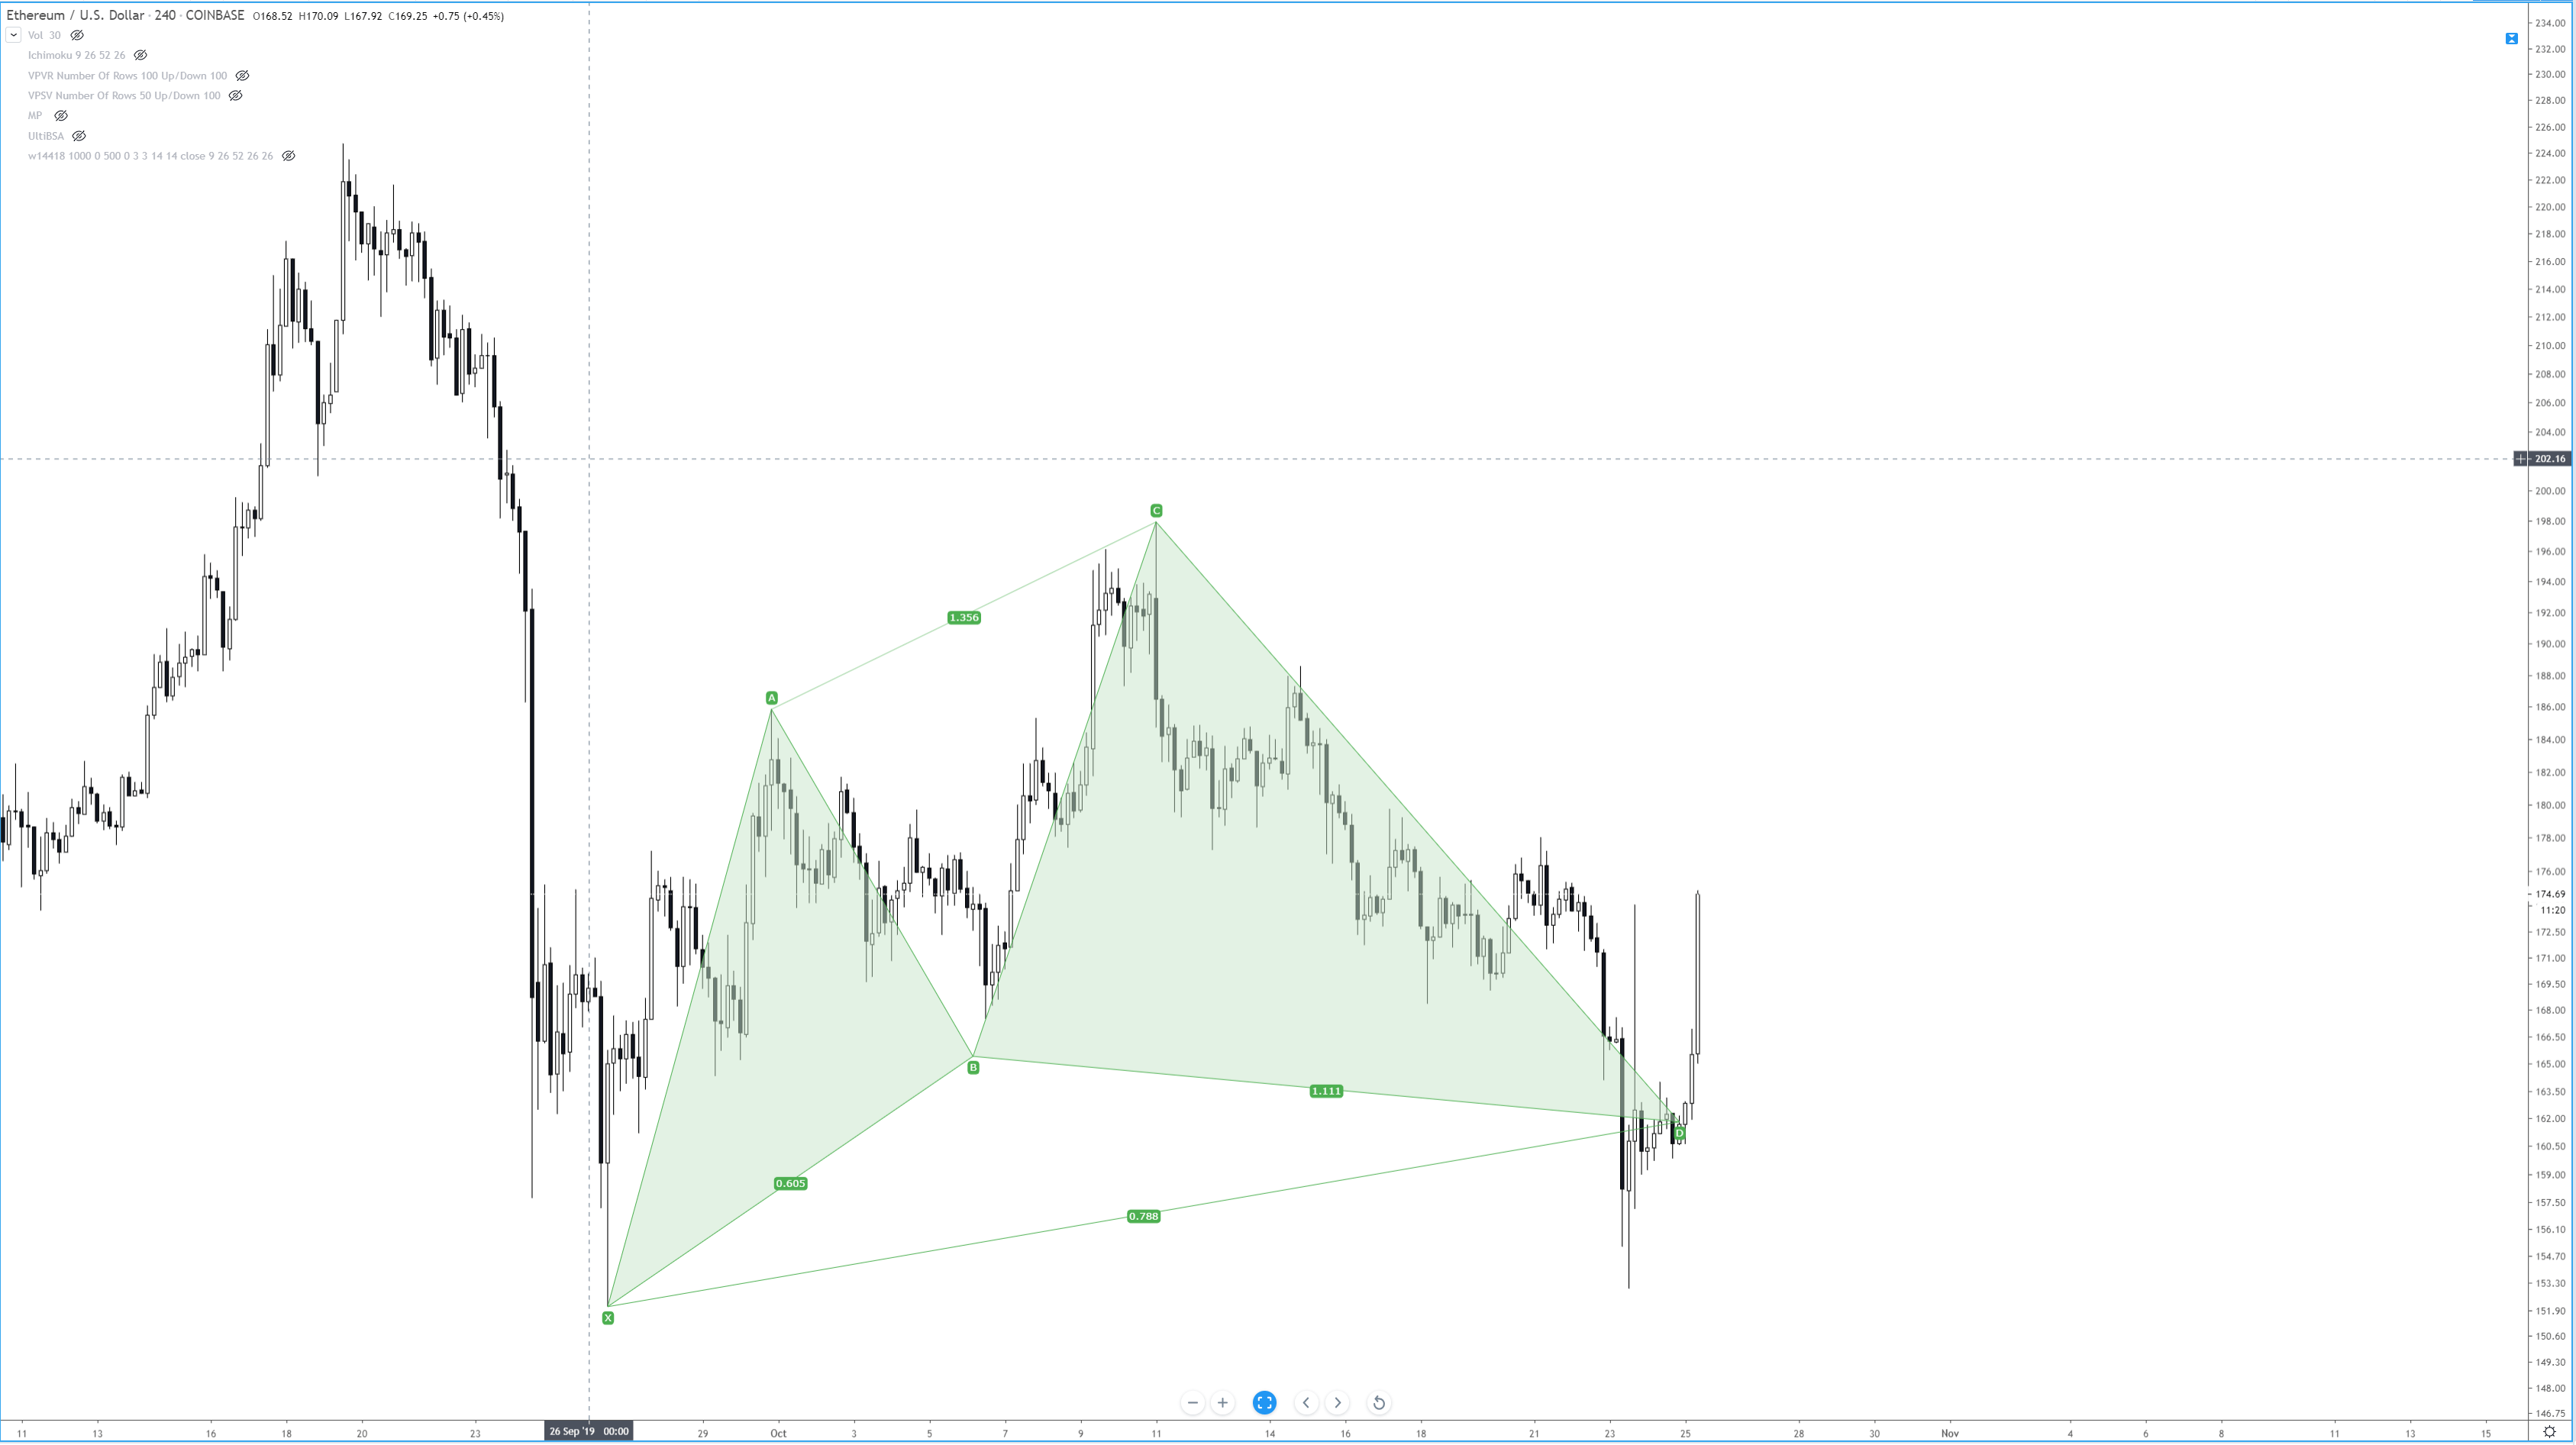
The Butterfly pattern is a harmonic pattern discovered by Bryce Gilmore. Gilmore is the author of Geometry or Markets (now in its 4th Edition, initially published in 1987)– a must-read for those interested in harmonics patterns. He is the creator of his proprietary software called WaveTrader. The Butterfly is one of the most potent harmonic patterns because of the nature of where it shows up. Both Carney and Pesavento stress that this pattern typically shows the significant highs and significant lows of a trend. In fact, in utilizing multiple time frame analysis, it is not uncommon to see several Butterfly patterns show up in various timeframes all at the end of a trend (example: the end of a bull trend can show a bearish butterfly on a daily chart with a 4-hour and 1-hour chart showing a bearish butterfly ending at the same time). This pattern is an example of an extension pattern and is generally formed when a Gartley pattern (the Gartley Harmonic pattern) is invalidated by the CD wave moving beyond X. From a price action perspective, this is the kind of move where one would ‘assume’ a new high or low should be established, but extreme fear or greed takes over and causes prices to accelerate in both volume and price to end a trend.

Failure, Symmetry, and Thrust

Pesavento identified three crucial characteristics of the Butterfly pattern.

Thrust – C should be observed as an indicator of whether a Gartley or Butterfly pattern will form. He indicated specific Fibonacci levels that are important for gaps – but that is important for equity markets that are rife with gaps. That is not important for us in Forex markets (gaps in Forex are rare intra-week and typically form only on the Chicago Sunday open, Forex also has an extremely high degree of gaps filling). He noted that thrusts out of the CD wave point to a high probability of new 161.8% extensions rather than a 127.2% extension.


Symmetry – The slope of the AB and CD wave in the AB=CD should be observed strictly. Depending on how steep the angle is on the CD wave, this could indicate a Butterfly pattern is going to be formed. Pesavento also noted that the number of bars should be equal (10 bars in AB should also be 10 bars in CD). Regarding the steepness of the CD wave, this is where Gann can become instrumental. In my trading, and depending on the instrument and market, I utilize Gann’s various Squares (Square of 144, Square of 90, Square of 52, etc.). If you use a chart that is properly squared in price and time, there is very little ambiguity involved in identifying the speed of the slope of a CD wave.


Failure Signs – Very merely put, Pesavento called for close attention to any move that extends beyond the 161.8% XA expansion. And this is an excellent point because one of the most dangerous things we can do as traders is an attempt to put to much weight on a specific style of analysis. It’s easy to think, ‘well, the Butterfly pattern is strong, so if it completes that must be the high or low.’ That is a very foolish and dangerous assumption to make. When markets, even Forex, make new highs or lows in their respective trends, that is generally a sign of strength. So while the Butterfly pattern does indicate the end of a trend – common sense confirmation is still required. The Butterfly pattern should help confirm the end of a trend, not define it.


The Five Negations

Continuing on with the great work of Pesavento and Jouflas, they identified five conditions that would invalidate a Butterfly pattern:

  1. No AB=CD in the AD wave.
  2. A move beyond the 261.8% extension.
  3. B above X (sell) or B below X (buy).
  4. C above A or C Below A, respectively.
  5. D must extend beyond X.


Ideal Butterfly Pattern Conditions

Carney identified six ideal conditions for a Butterfly pattern. You will note that the combination of Pesavento and Jouflas’s work greatly compliments Carney’s.

  1. Precise 78.6% retracement of B from the XA wave. The 78.6% B retracement is required.
  2. BC must be at least 161.8%.
  3. AB=CD is required – the Alternate 127% AB=CD is the most common.
  4. 127% projection is the most critical number in the PRZ (Potential Reversal Zone).
  5. No 161.8% projection.
  6. C should be within its 38.2% to 88.6% Fibonacci retracement.

Sources: Carney, S. M. (2010). Harmonic trading. Upper Saddle River, NJ: Financial Times/Prentice Hall.  Gilmore, B. T. (2000). Geometry of markets. Greenville, SC: Traders Press.  Pesavento, L., & Jouflas, L. (2008). Trade what you see: how to profit from pattern recognition. Hoboken: Wiley.

Categories
Forex Indicators

The Truth About Moving Averages

Moving Averages

Of all the technical indicators that exist, moving averages are probably the most well known. Moving averages are also one of the only technical indicators ever used by market news broadcasters. Moving averages are generally one of the first types of indicators that new analysts and traders will learn about because they simple to calculate and simple to interpret. But are moving averages useful for trading? Are they appropriate for trading?

Dangers of Moving Averages

I want to preface any further commentary on moving averages by saying I am strictly opposed to their use. Outside of any singular purpose for their use, I will never advocate for their use of an analytical tool or a trading tool. The reasons for this opinion are my own trading experience, and the experience of teaching students – who have all (myself included) fell into the old trap of moving average crossover systems and the lies that are sold about their usefulness and profitability. That is not to say they are not helpful, useful, or profitable – but the temptation to believe in their positive expectancy and profitability is often too hard to avoid.


Moving Averages: A simple visual representation of data

20-period Simple Moving Average

The orange line on the chart above is a moving average — specifically, a Simple Moving Average (SMA). A Simple Moving Average is a line that is plotted, showing the average close of a defined number of periods. On the chart above, it is a 10-period moving average. Meaning it is taking the last ten candlestick closes, adding them up, dividing that number by ten, and then displaying it as a line. But a Simple Moving Average is just one type of average. There is an enormous amount of various moving averages, each with their specific calculations. The chart below shows only some of those different moving averages, all with a 10-period average.

Various moving averages

From the image above, you can probably say that, depending on the moving average used, some averages are more responsive to price changes than others. Some move a lot; some move just a little. There is a myriad of different reasons why one moving average would be used over another, and there are specific moving averages that to be used only with particular trading systems and methods. Now, after I’ve bashed moving averages, I think it’s essential that I do show some examples of moving averages positively. The first would be using a long period moving average on a higher time frame. For example, a standard method of determining whether a stock is bullish or bearish is to use a 200-period on a daily chart. If a stock is trading above the 200-day average, it is considered bullish; if it is trading below, it is bearish.

200-day Moving Average of S&P500

Another example of a trading system using moving averages effectively would be Goichi Hosada’s Ichimoku Kinko Hyo system. This system will be discussed in much greater detail in another article, but the Ichimoku system is based almost entirely on moving averages. There is a significant difference between Western moving averages and Japanese moving averages. The Tenkan-Sen and Kijun-Sen in the Ichimoku system are calculated using the mid-point of the default periods. The utilization of the mid-point is particular not to just the Ichimoku system but is indicative of a large amount of Japanese analysis, which focuses on ‘balance’ and ‘equilibrium.’ So while I do rail against the use of Western moving averages, the use of the Ichimoku system’s moving averages is undoubtedly a significant exception due to it being a full trading system and one of the few trading systems that are a proven and profitable system.

Ichimoku Kinko Hyo
Categories
Crypto Market Analysis

How to trade Bitcoin these Days?

  • Market Cap: $109,146,342,387
  • Total Supply: 21,000,000
  • Circulating Supply: 17,260,700
  • Daily Volume: $3,735,502,316

How to trade Bitcoin?

Trading Cryptocurrencies might be hard these days. Many people think that, because of the downtrend that we are in, they can not trade at all. However, there is great potential in this market. The trend direction does not matter, volatility is the thing traders should be concerned with. Cryptocurrency has a lot of volatility, which creates opportunity.


Where will BTC go and how do we determine that?

Bitcoin has three ways to go:

  • Up
  • Sideways
  • Down

Scenario 1

Bitcoin has the chance to move up, but the moves are small and negligible. The major trend is downwards, and we should not consider long positions until fundamentals change.

Scenario 2

Bitcoin trading sideways is easiest to trade. Volume will not change in size, confirmation oscillators should be ranging as well, and we can trade off of support and resistance lines and the divergences in RSI and CMF.

Scenario 3

Bitcoin is trading in a downwards fashion. We can spot the downwards moves by looking at CBOE and CME contract expiration dates, divergences accompanied with volume spikes, and sudden breaks of major support lines.

Final word

There is a big opportunity in catching the downtrend that is expected to happen before 20th of November. It will be indicated by BTC breaking 5750 barrier with great volume, which will trigger stop losses.