Moving Averages
Of all the technical indicators that exist, moving averages are probably the most well known. Moving averages are also one of the only technical indicators ever used by market news broadcasters. Moving averages are generally one of the first types of indicators that new analysts and traders will learn about because they simple to calculate and simple to interpret. But are moving averages useful for trading? Are they appropriate for trading?
Dangers of Moving Averages
I want to preface any further commentary on moving averages by saying I am strictly opposed to their use. Outside of any singular purpose for their use, I will never advocate for their use of an analytical tool or a trading tool. The reasons for this opinion are my own trading experience, and the experience of teaching students – who have all (myself included) fell into the old trap of moving average crossover systems and the lies that are sold about their usefulness and profitability. That is not to say they are not helpful, useful, or profitable – but the temptation to believe in their positive expectancy and profitability is often too hard to avoid.
Moving Averages: A simple visual representation of data
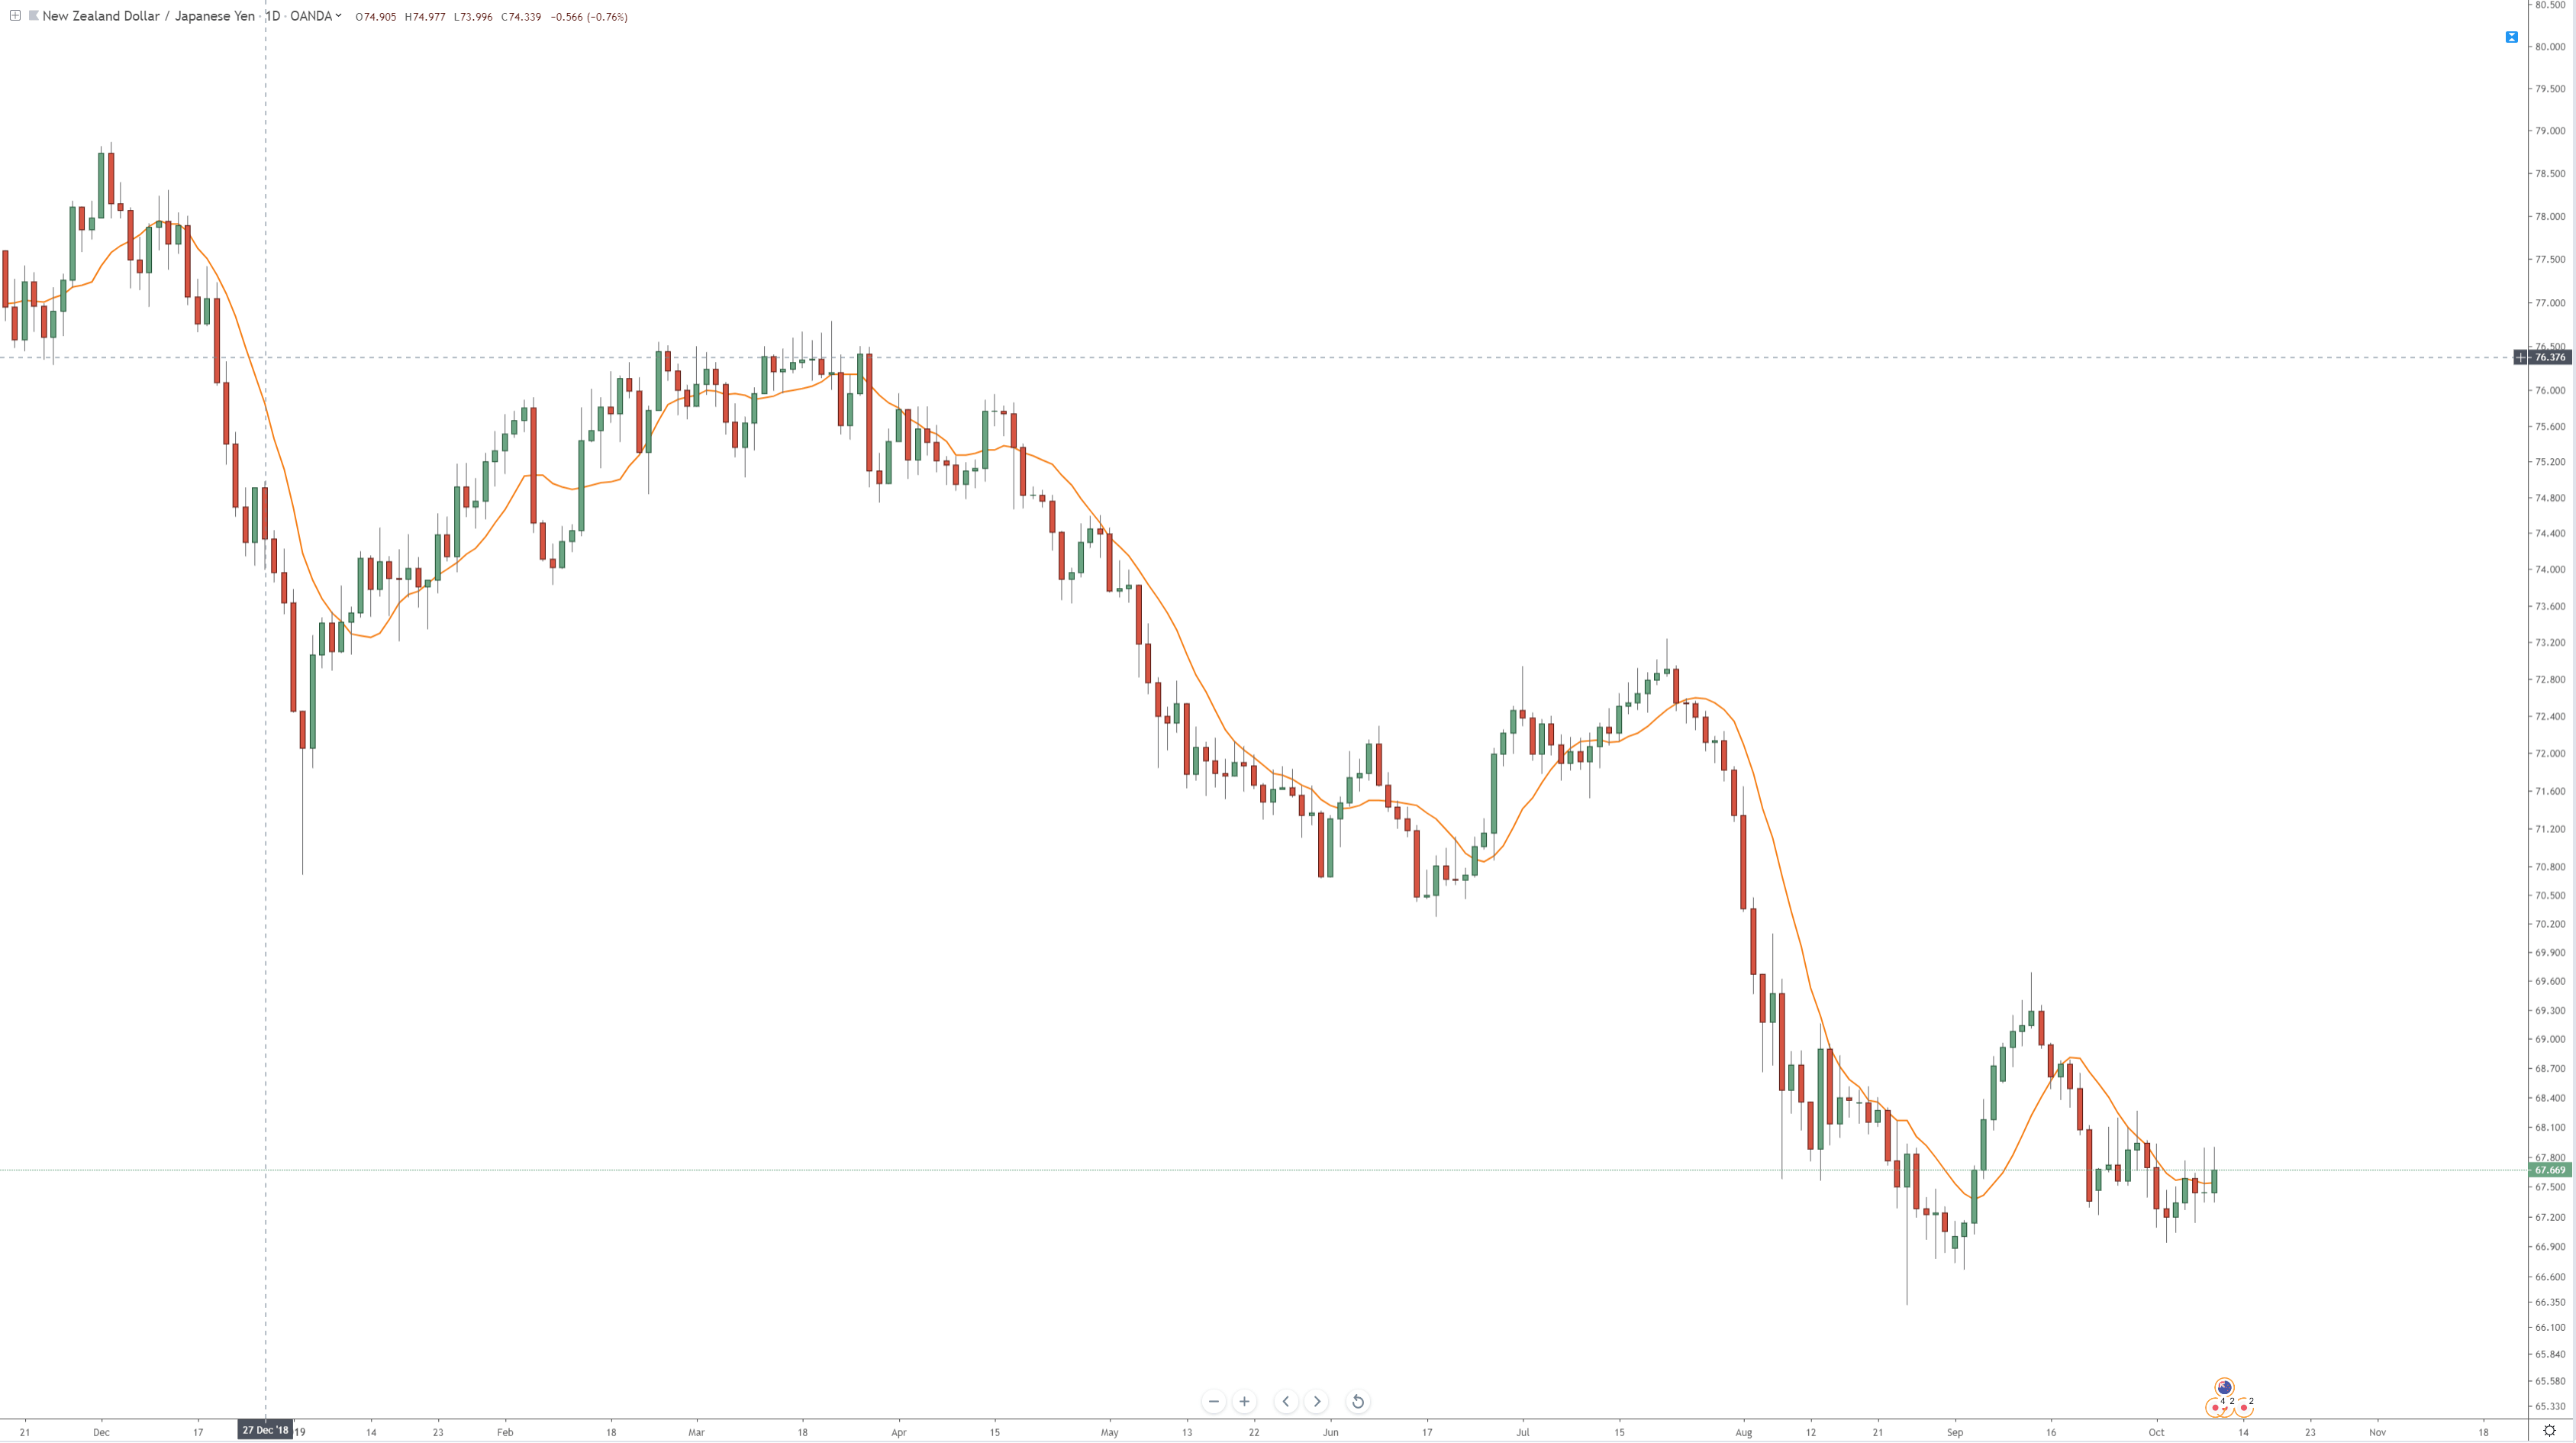
The orange line on the chart above is a moving average — specifically, a Simple Moving Average (SMA). A Simple Moving Average is a line that is plotted, showing the average close of a defined number of periods. On the chart above, it is a 10-period moving average. Meaning it is taking the last ten candlestick closes, adding them up, dividing that number by ten, and then displaying it as a line. But a Simple Moving Average is just one type of average. There is an enormous amount of various moving averages, each with their specific calculations. The chart below shows only some of those different moving averages, all with a 10-period average.
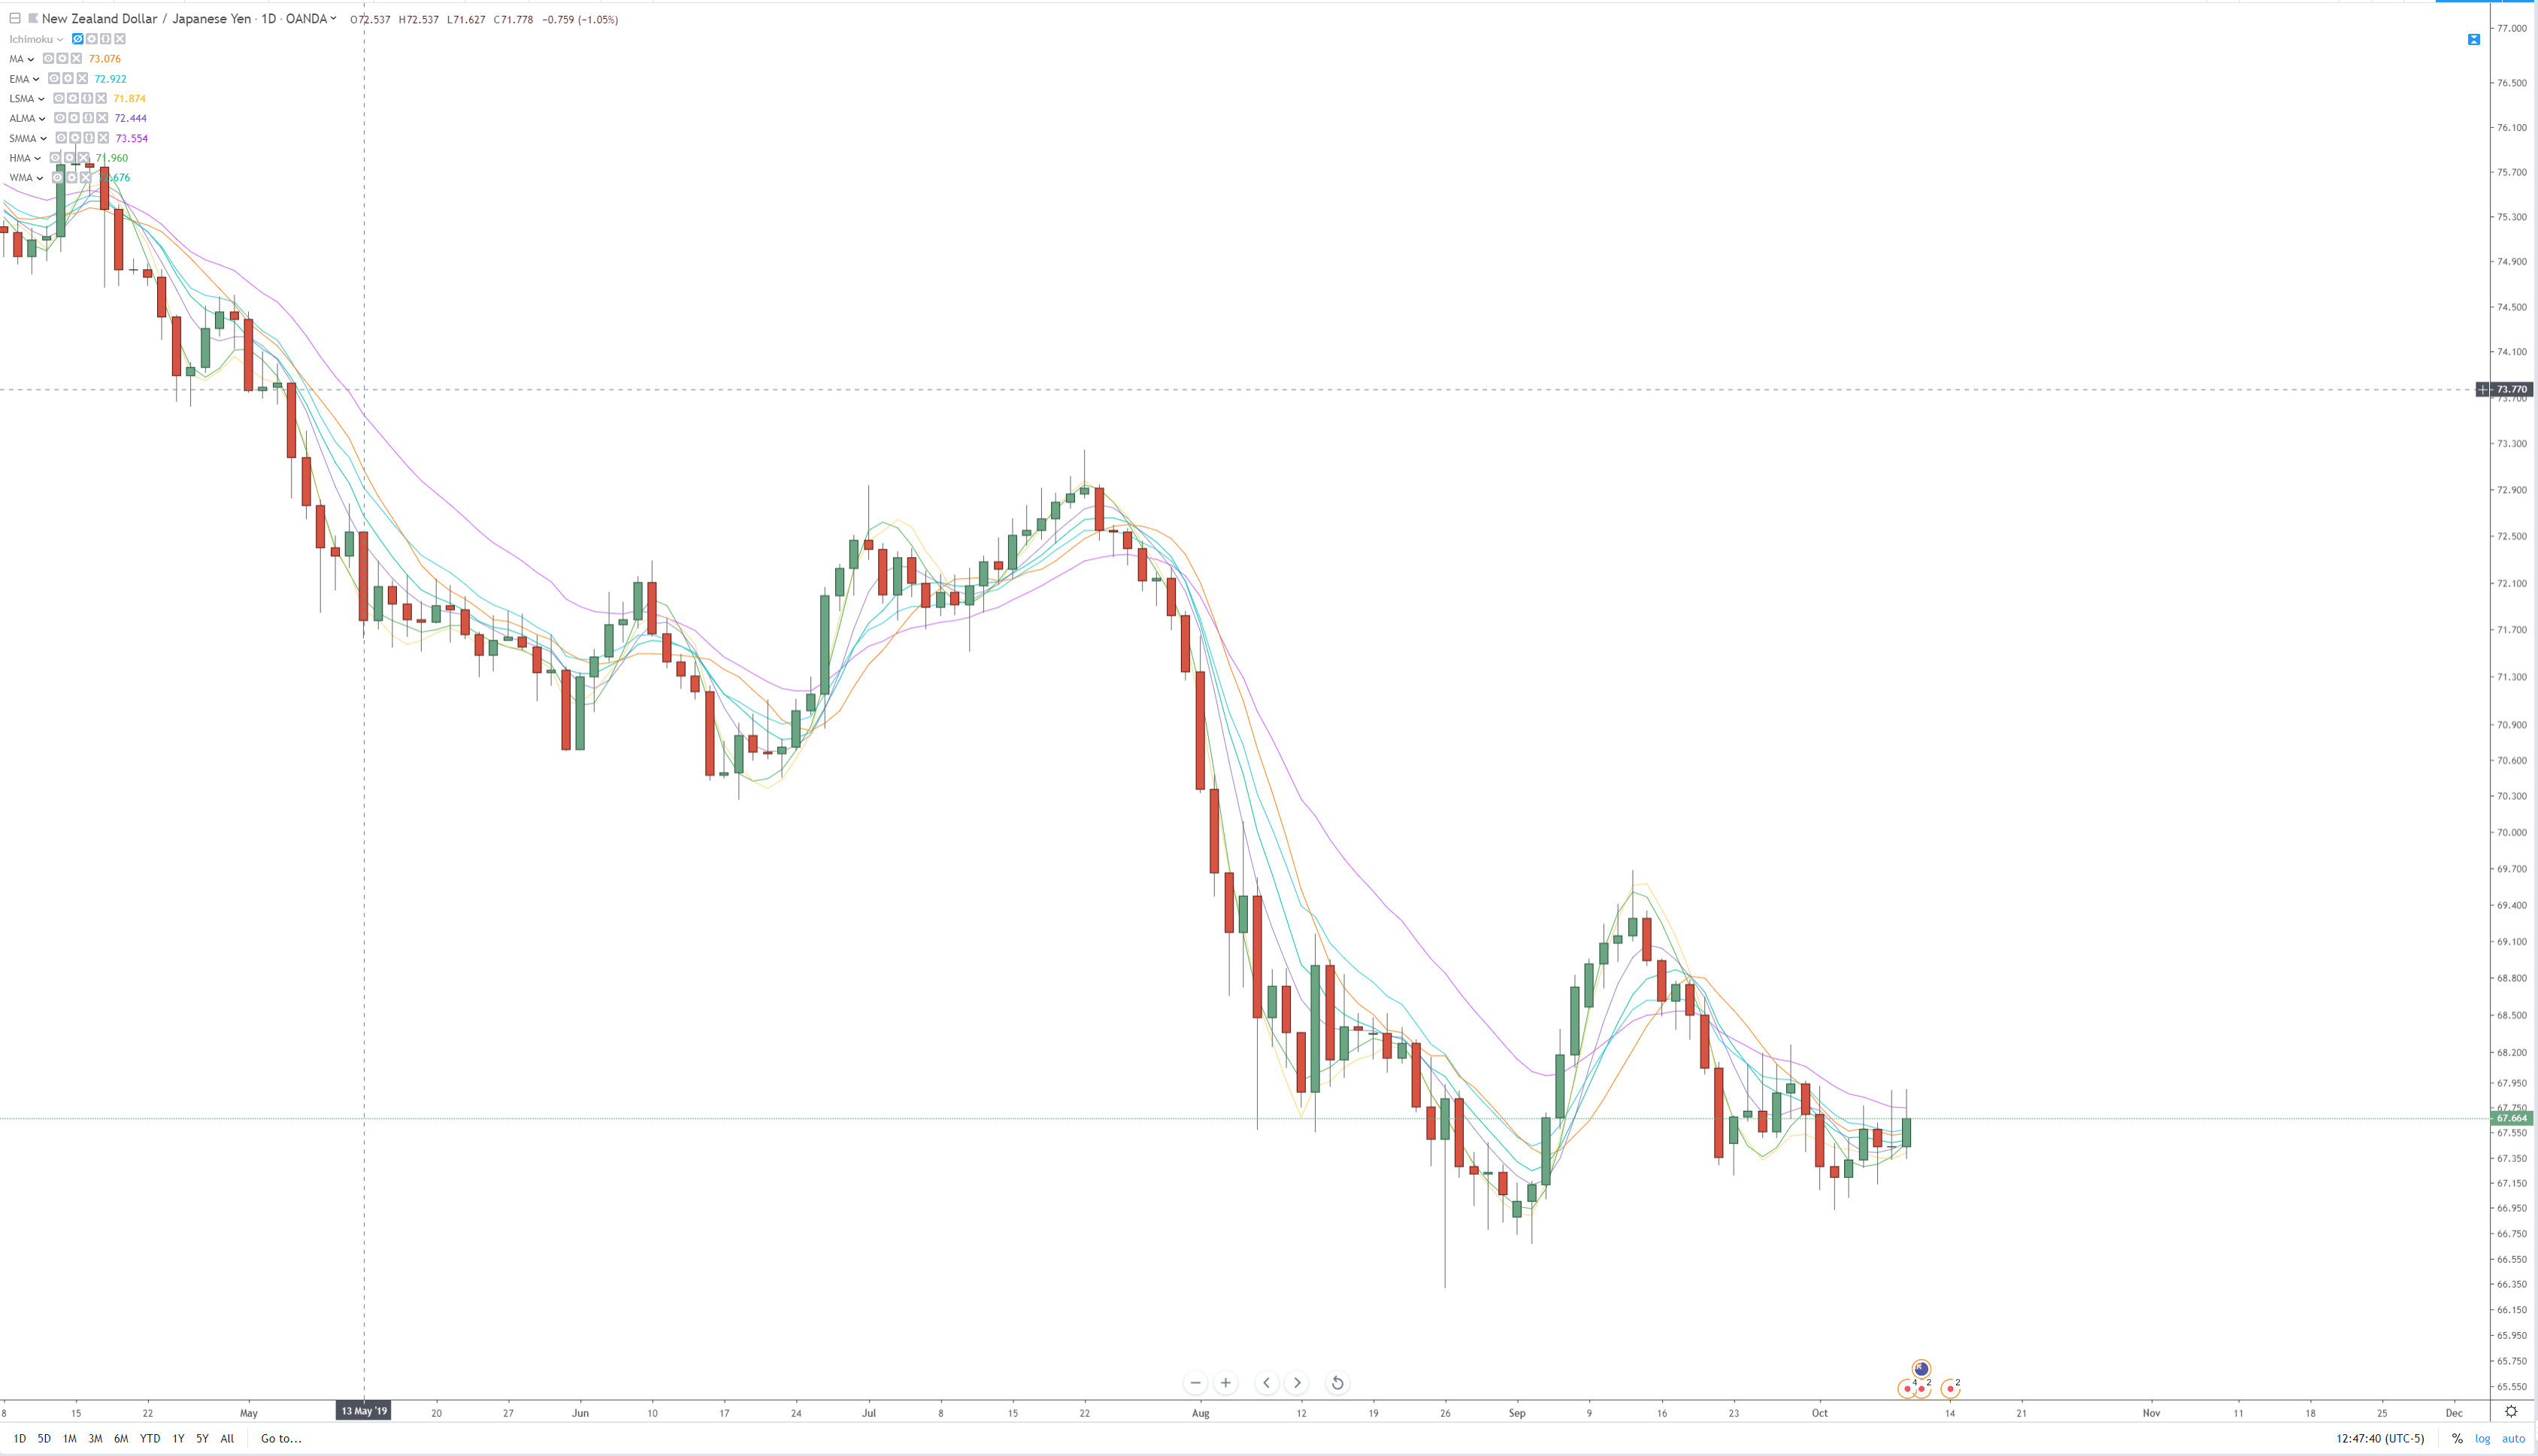
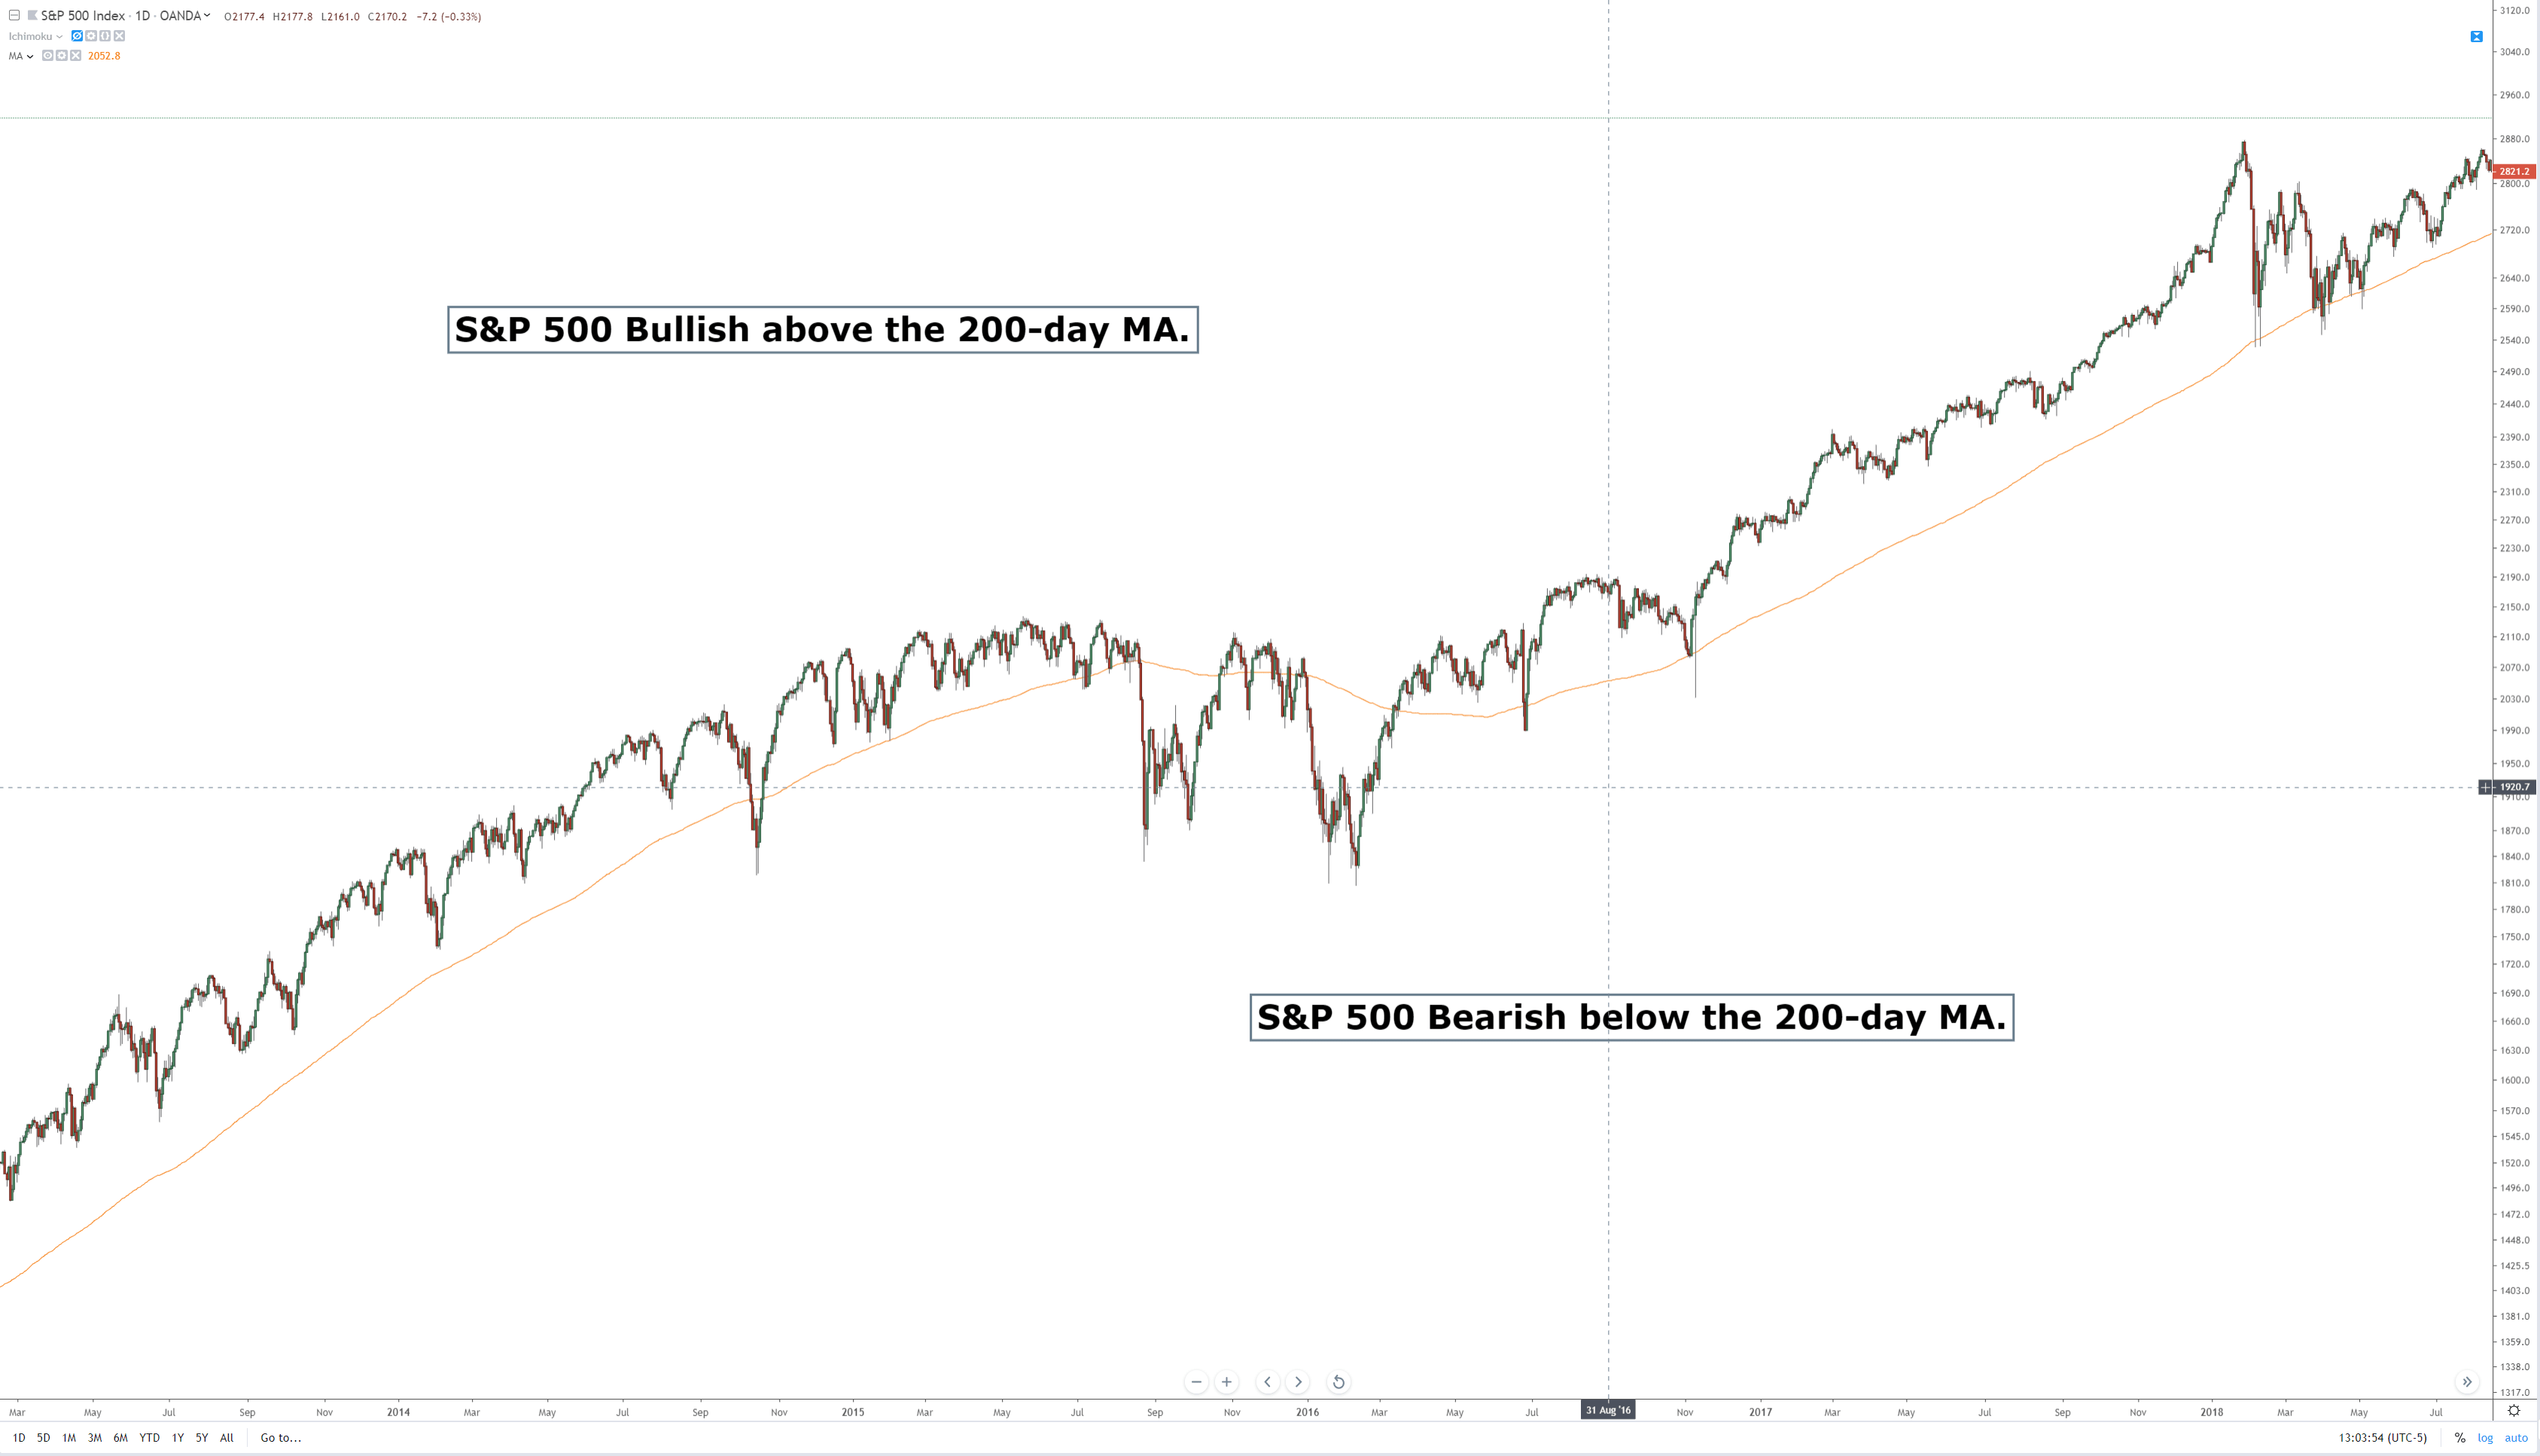
From the image above, you can probably say that, depending on the moving average used, some averages are more responsive to price changes than others. Some move a lot; some move just a little. There is a myriad of different reasons why one moving average would be used over another, and there are specific moving averages that to be used only with particular trading systems and methods. Now, after I’ve bashed moving averages, I think it’s essential that I do show some examples of moving averages positively. The first would be using a long period moving average on a higher time frame. For example, a standard method of determining whether a stock is bullish or bearish is to use a 200-period on a daily chart. If a stock is trading above the 200-day average, it is considered bullish; if it is trading below, it is bearish.
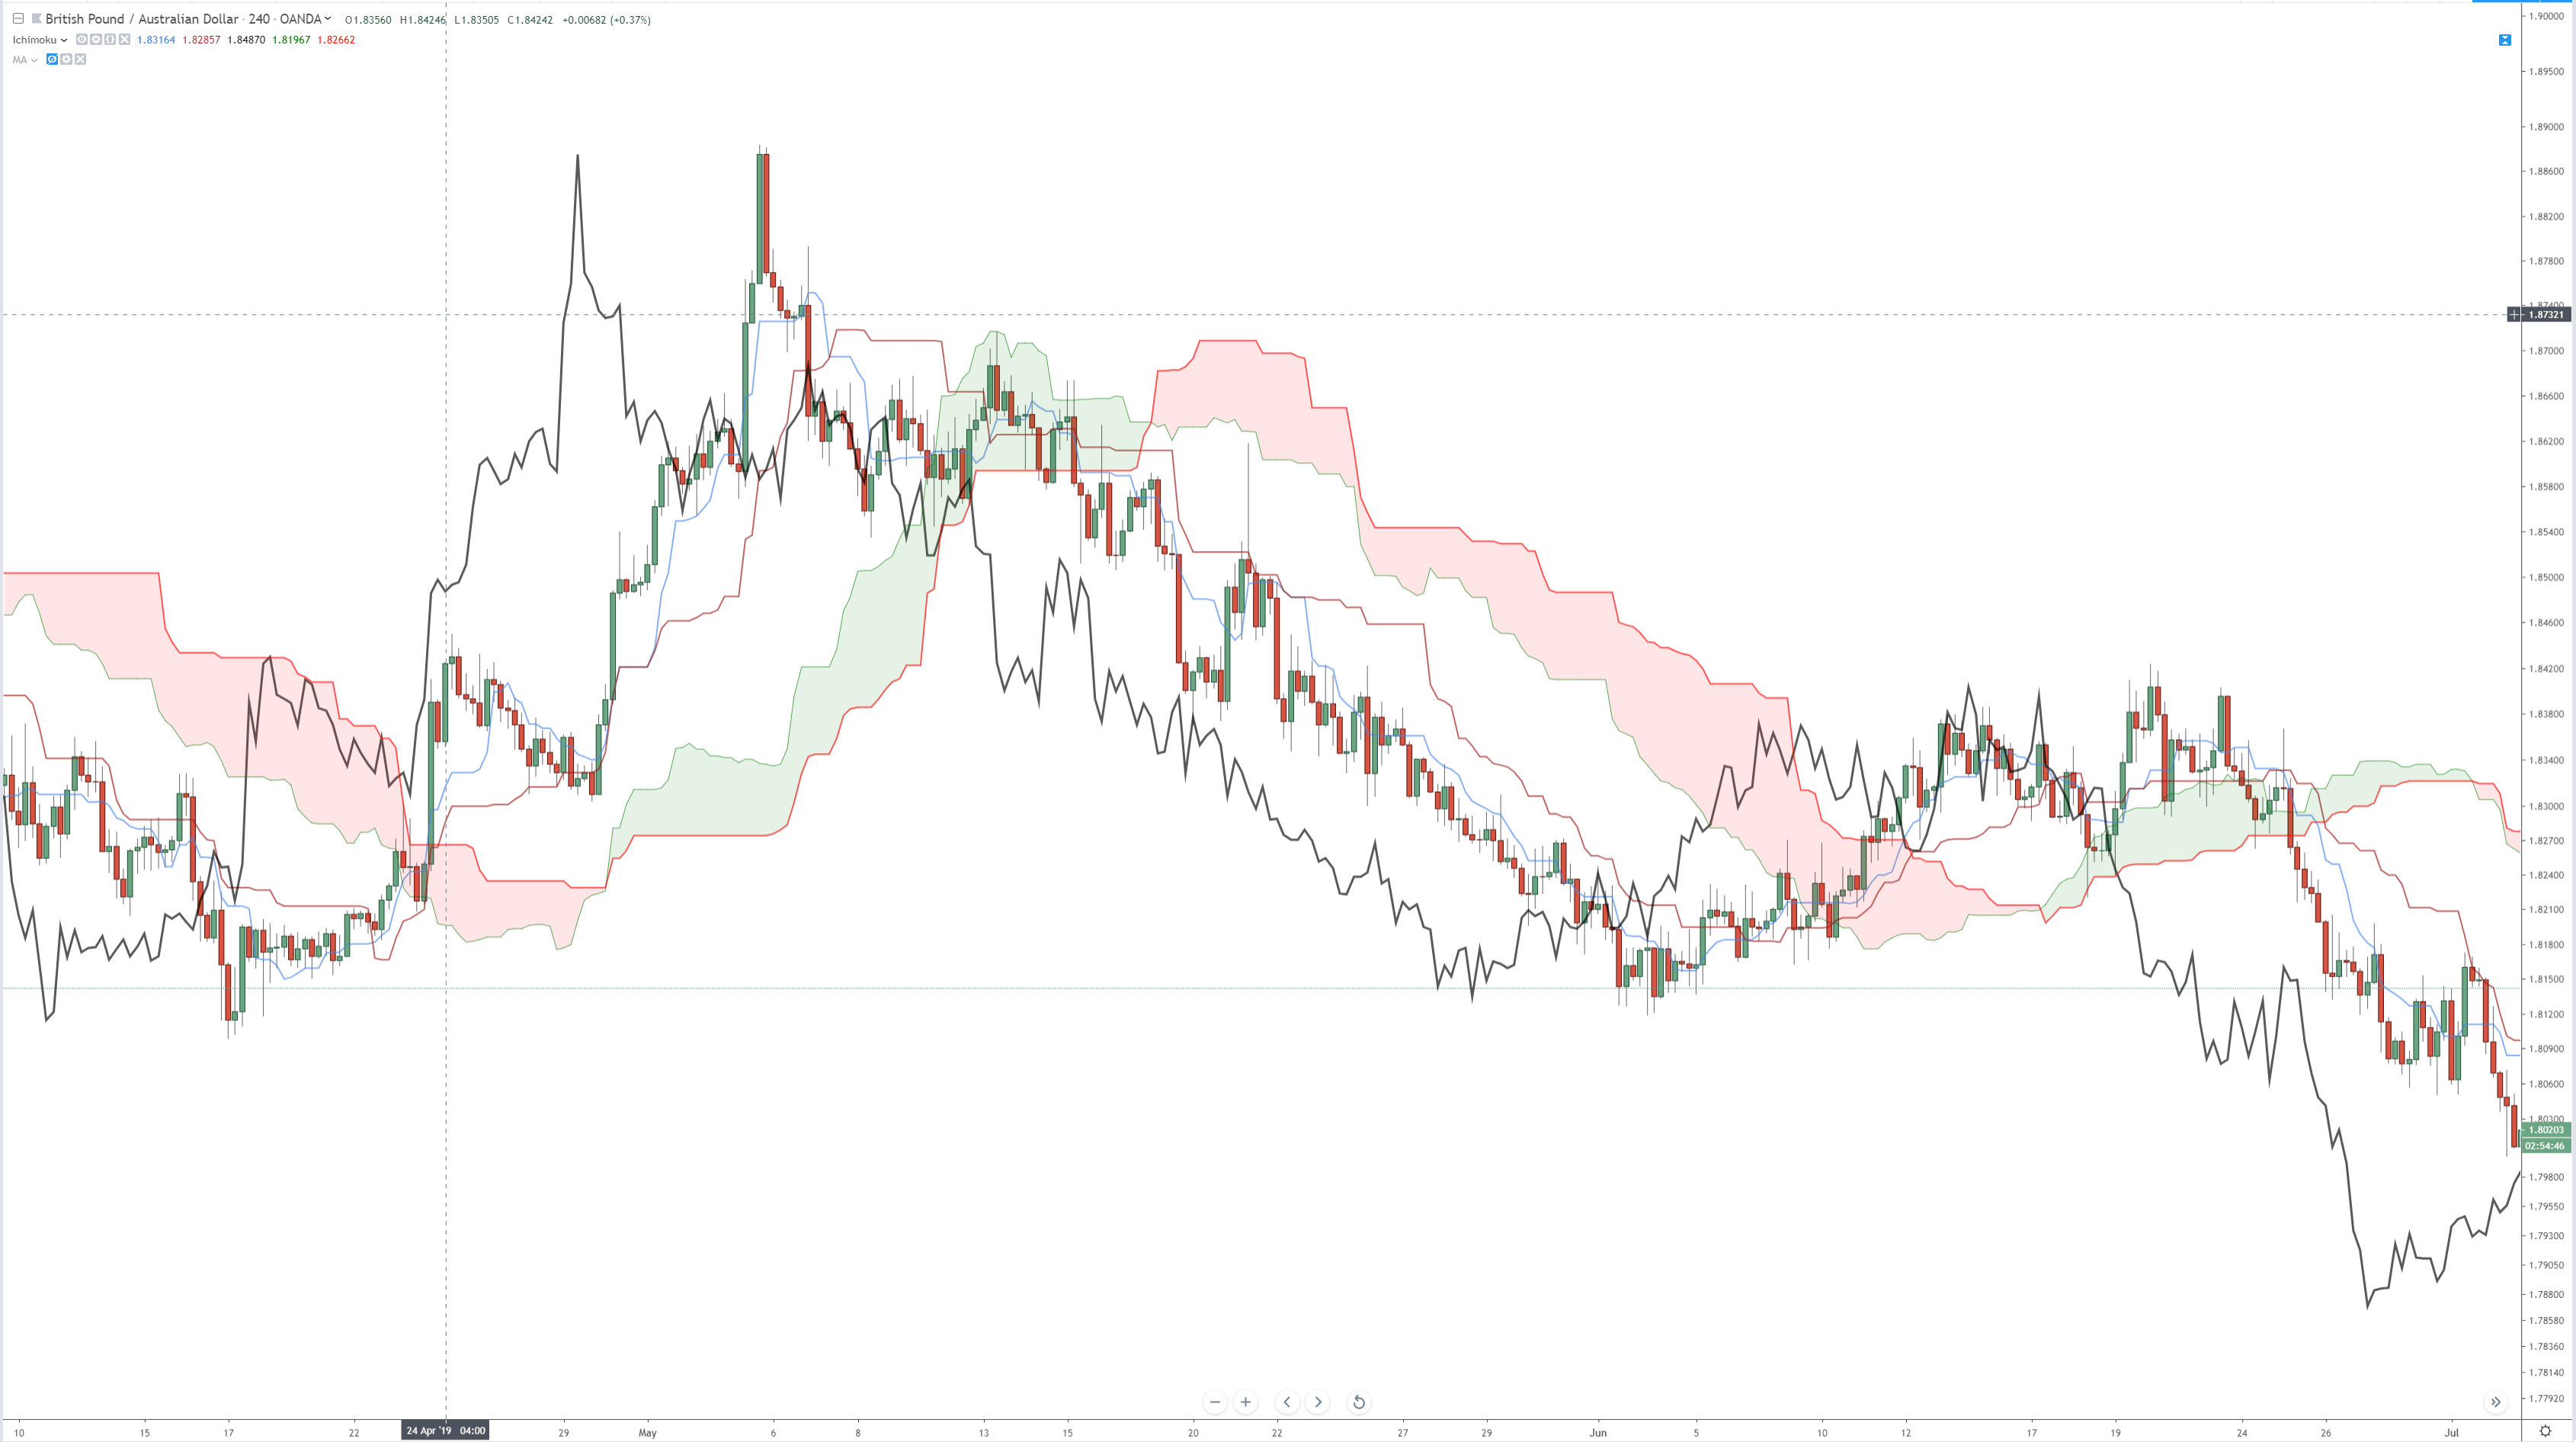
Another example of a trading system using moving averages effectively would be Goichi Hosada’s Ichimoku Kinko Hyo system. This system will be discussed in much greater detail in another article, but the Ichimoku system is based almost entirely on moving averages. There is a significant difference between Western moving averages and Japanese moving averages. The Tenkan-Sen and Kijun-Sen in the Ichimoku system are calculated using the mid-point of the default periods. The utilization of the mid-point is particular not to just the Ichimoku system but is indicative of a large amount of Japanese analysis, which focuses on ‘balance’ and ‘equilibrium.’ So while I do rail against the use of Western moving averages, the use of the Ichimoku system’s moving averages is undoubtedly a significant exception due to it being a full trading system and one of the few trading systems that are a proven and profitable system.
