Categories
Forex Indicators

The Truth About Moving Averages

Moving Averages

Of all the technical indicators that exist, moving averages are probably the most well known. Moving averages are also one of the only technical indicators ever used by market news broadcasters. Moving averages are generally one of the first types of indicators that new analysts and traders will learn about because they simple to calculate and simple to interpret. But are moving averages useful for trading? Are they appropriate for trading?

Dangers of Moving Averages

I want to preface any further commentary on moving averages by saying I am strictly opposed to their use. Outside of any singular purpose for their use, I will never advocate for their use of an analytical tool or a trading tool. The reasons for this opinion are my own trading experience, and the experience of teaching students – who have all (myself included) fell into the old trap of moving average crossover systems and the lies that are sold about their usefulness and profitability. That is not to say they are not helpful, useful, or profitable – but the temptation to believe in their positive expectancy and profitability is often too hard to avoid.


Moving Averages: A simple visual representation of data

20-period Simple Moving Average

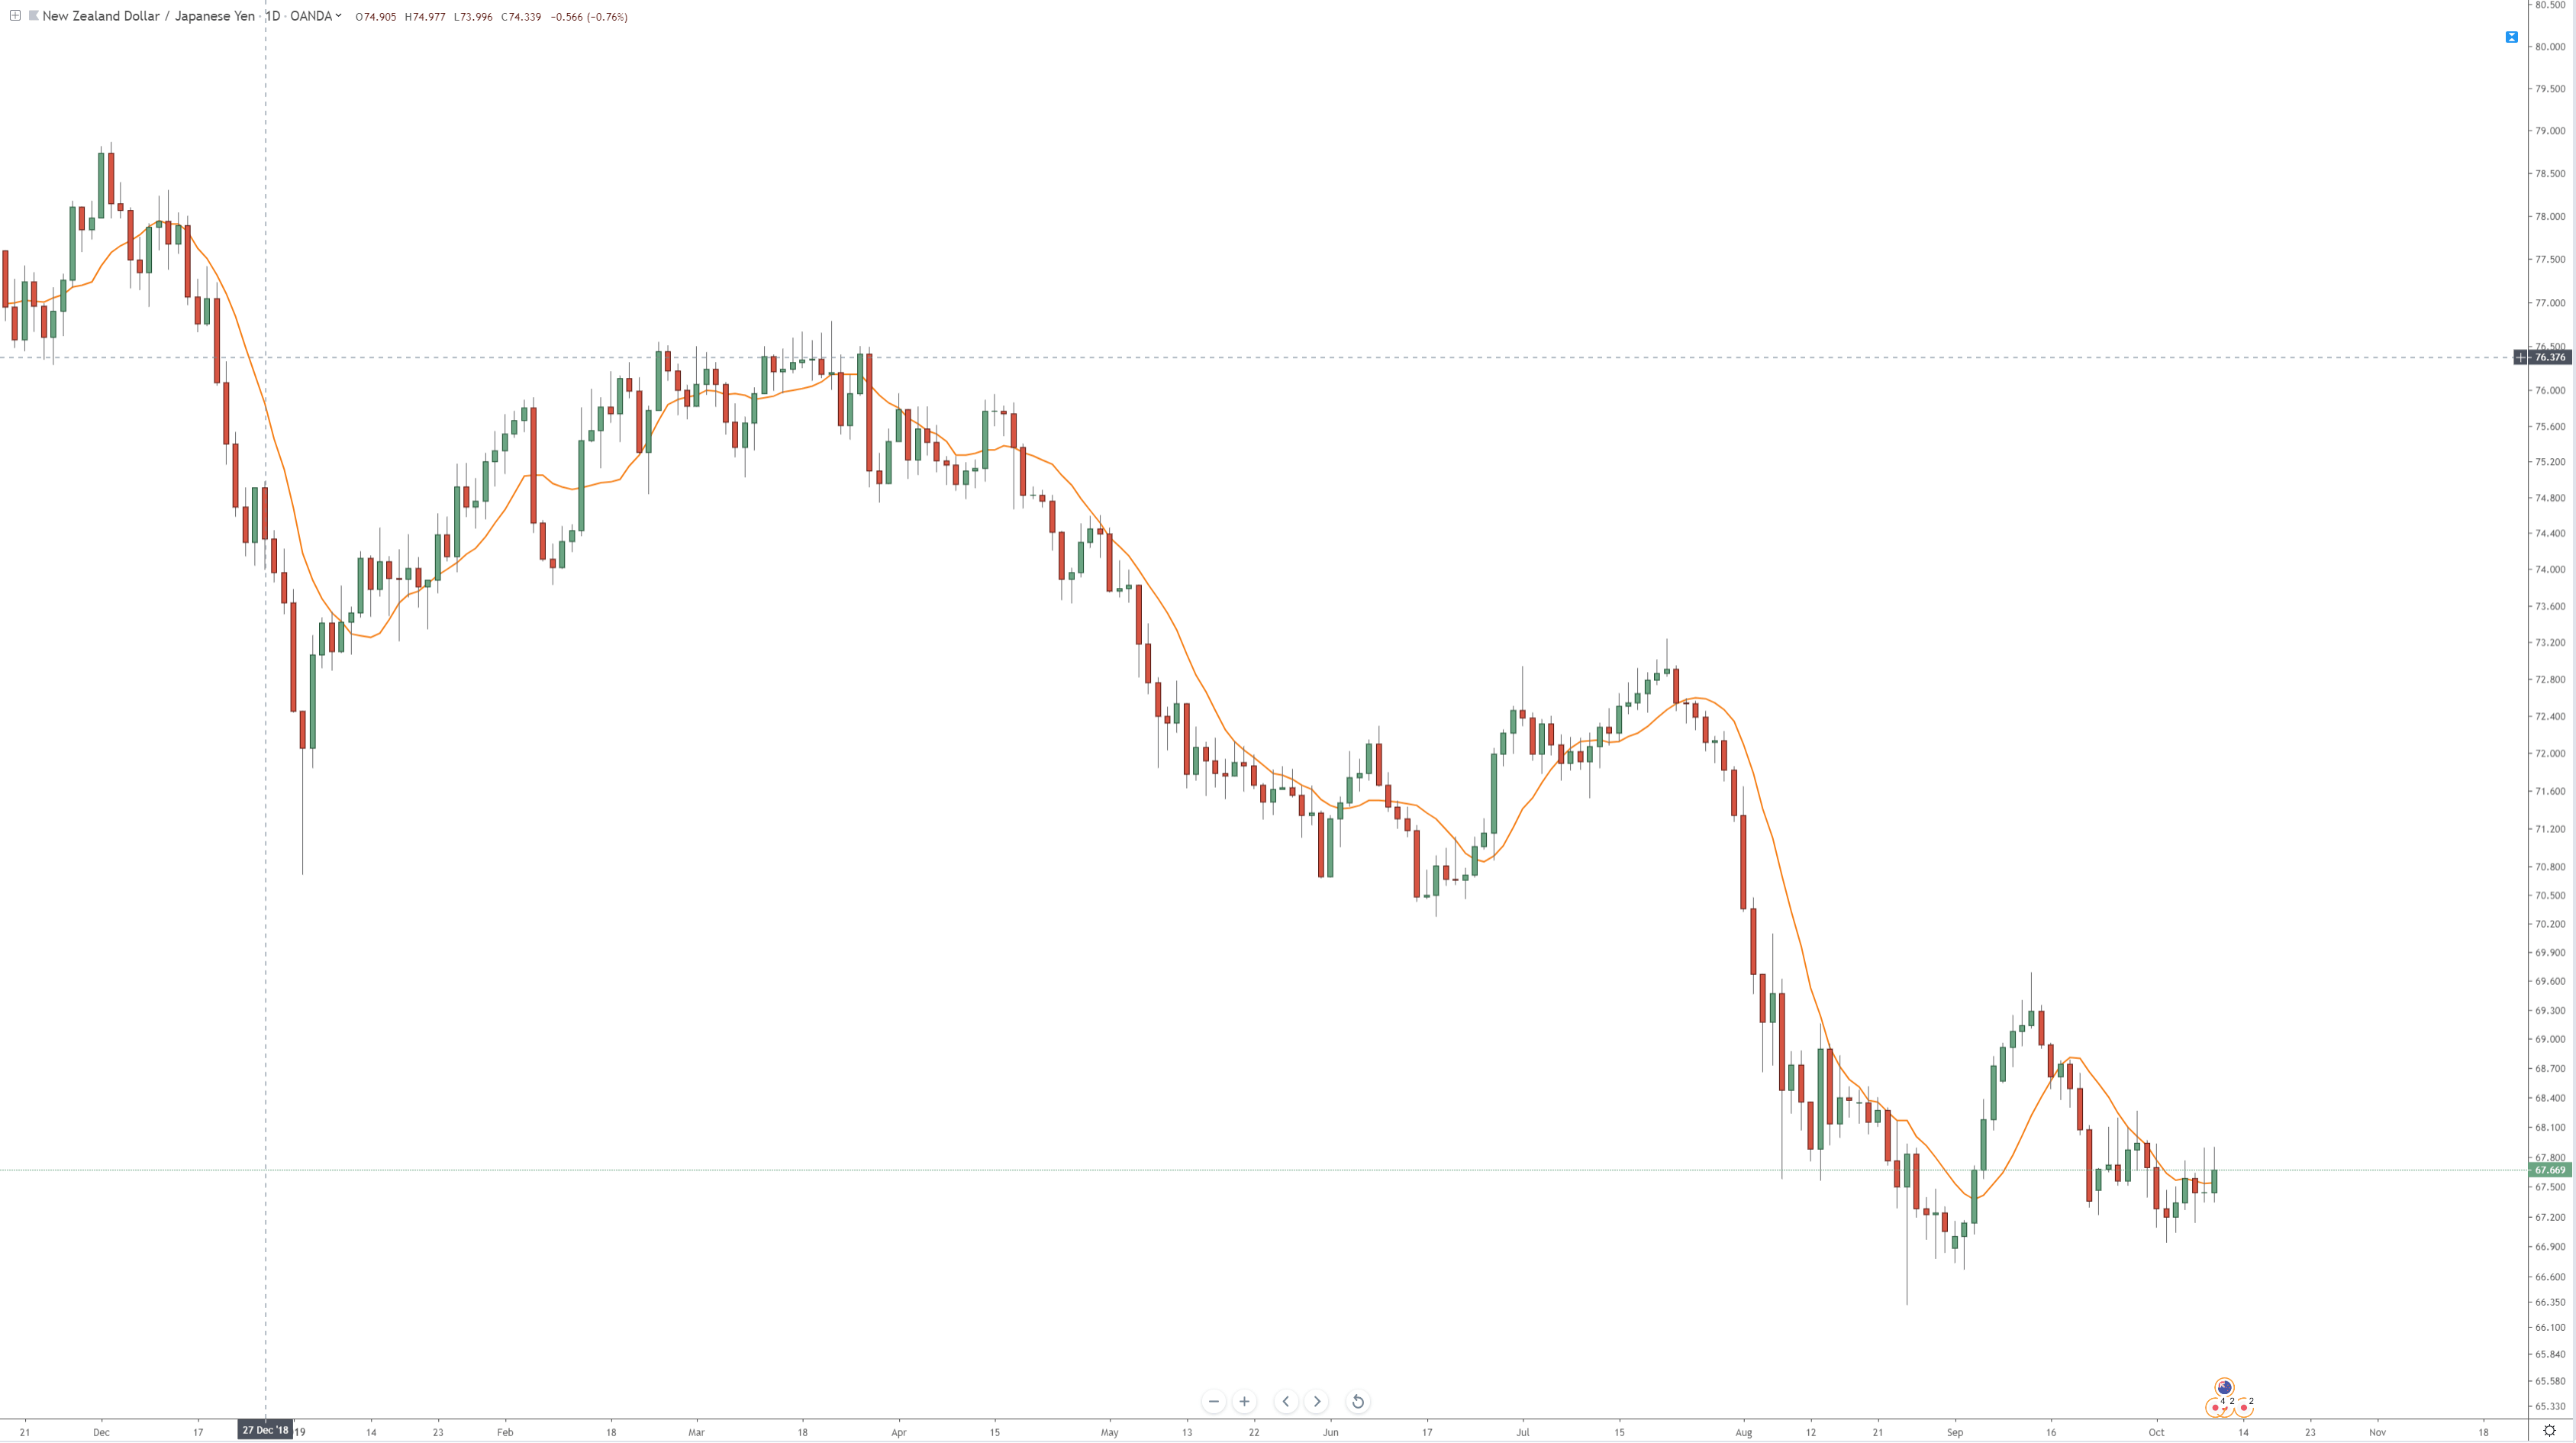
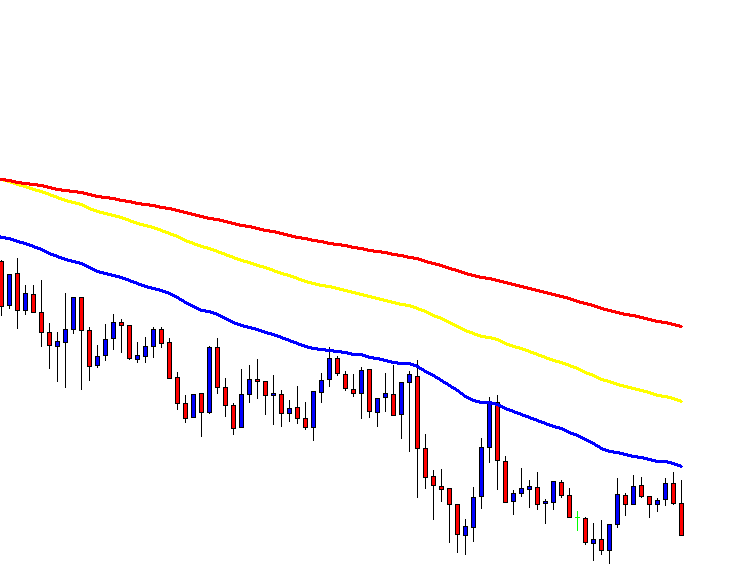
The orange line on the chart above is a moving average — specifically, a Simple Moving Average (SMA). A Simple Moving Average is a line that is plotted, showing the average close of a defined number of periods. On the chart above, it is a 10-period moving average. Meaning it is taking the last ten candlestick closes, adding them up, dividing that number by ten, and then displaying it as a line. But a Simple Moving Average is just one type of average. There is an enormous amount of various moving averages, each with their specific calculations. The chart below shows only some of those different moving averages, all with a 10-period average.

Various moving averages

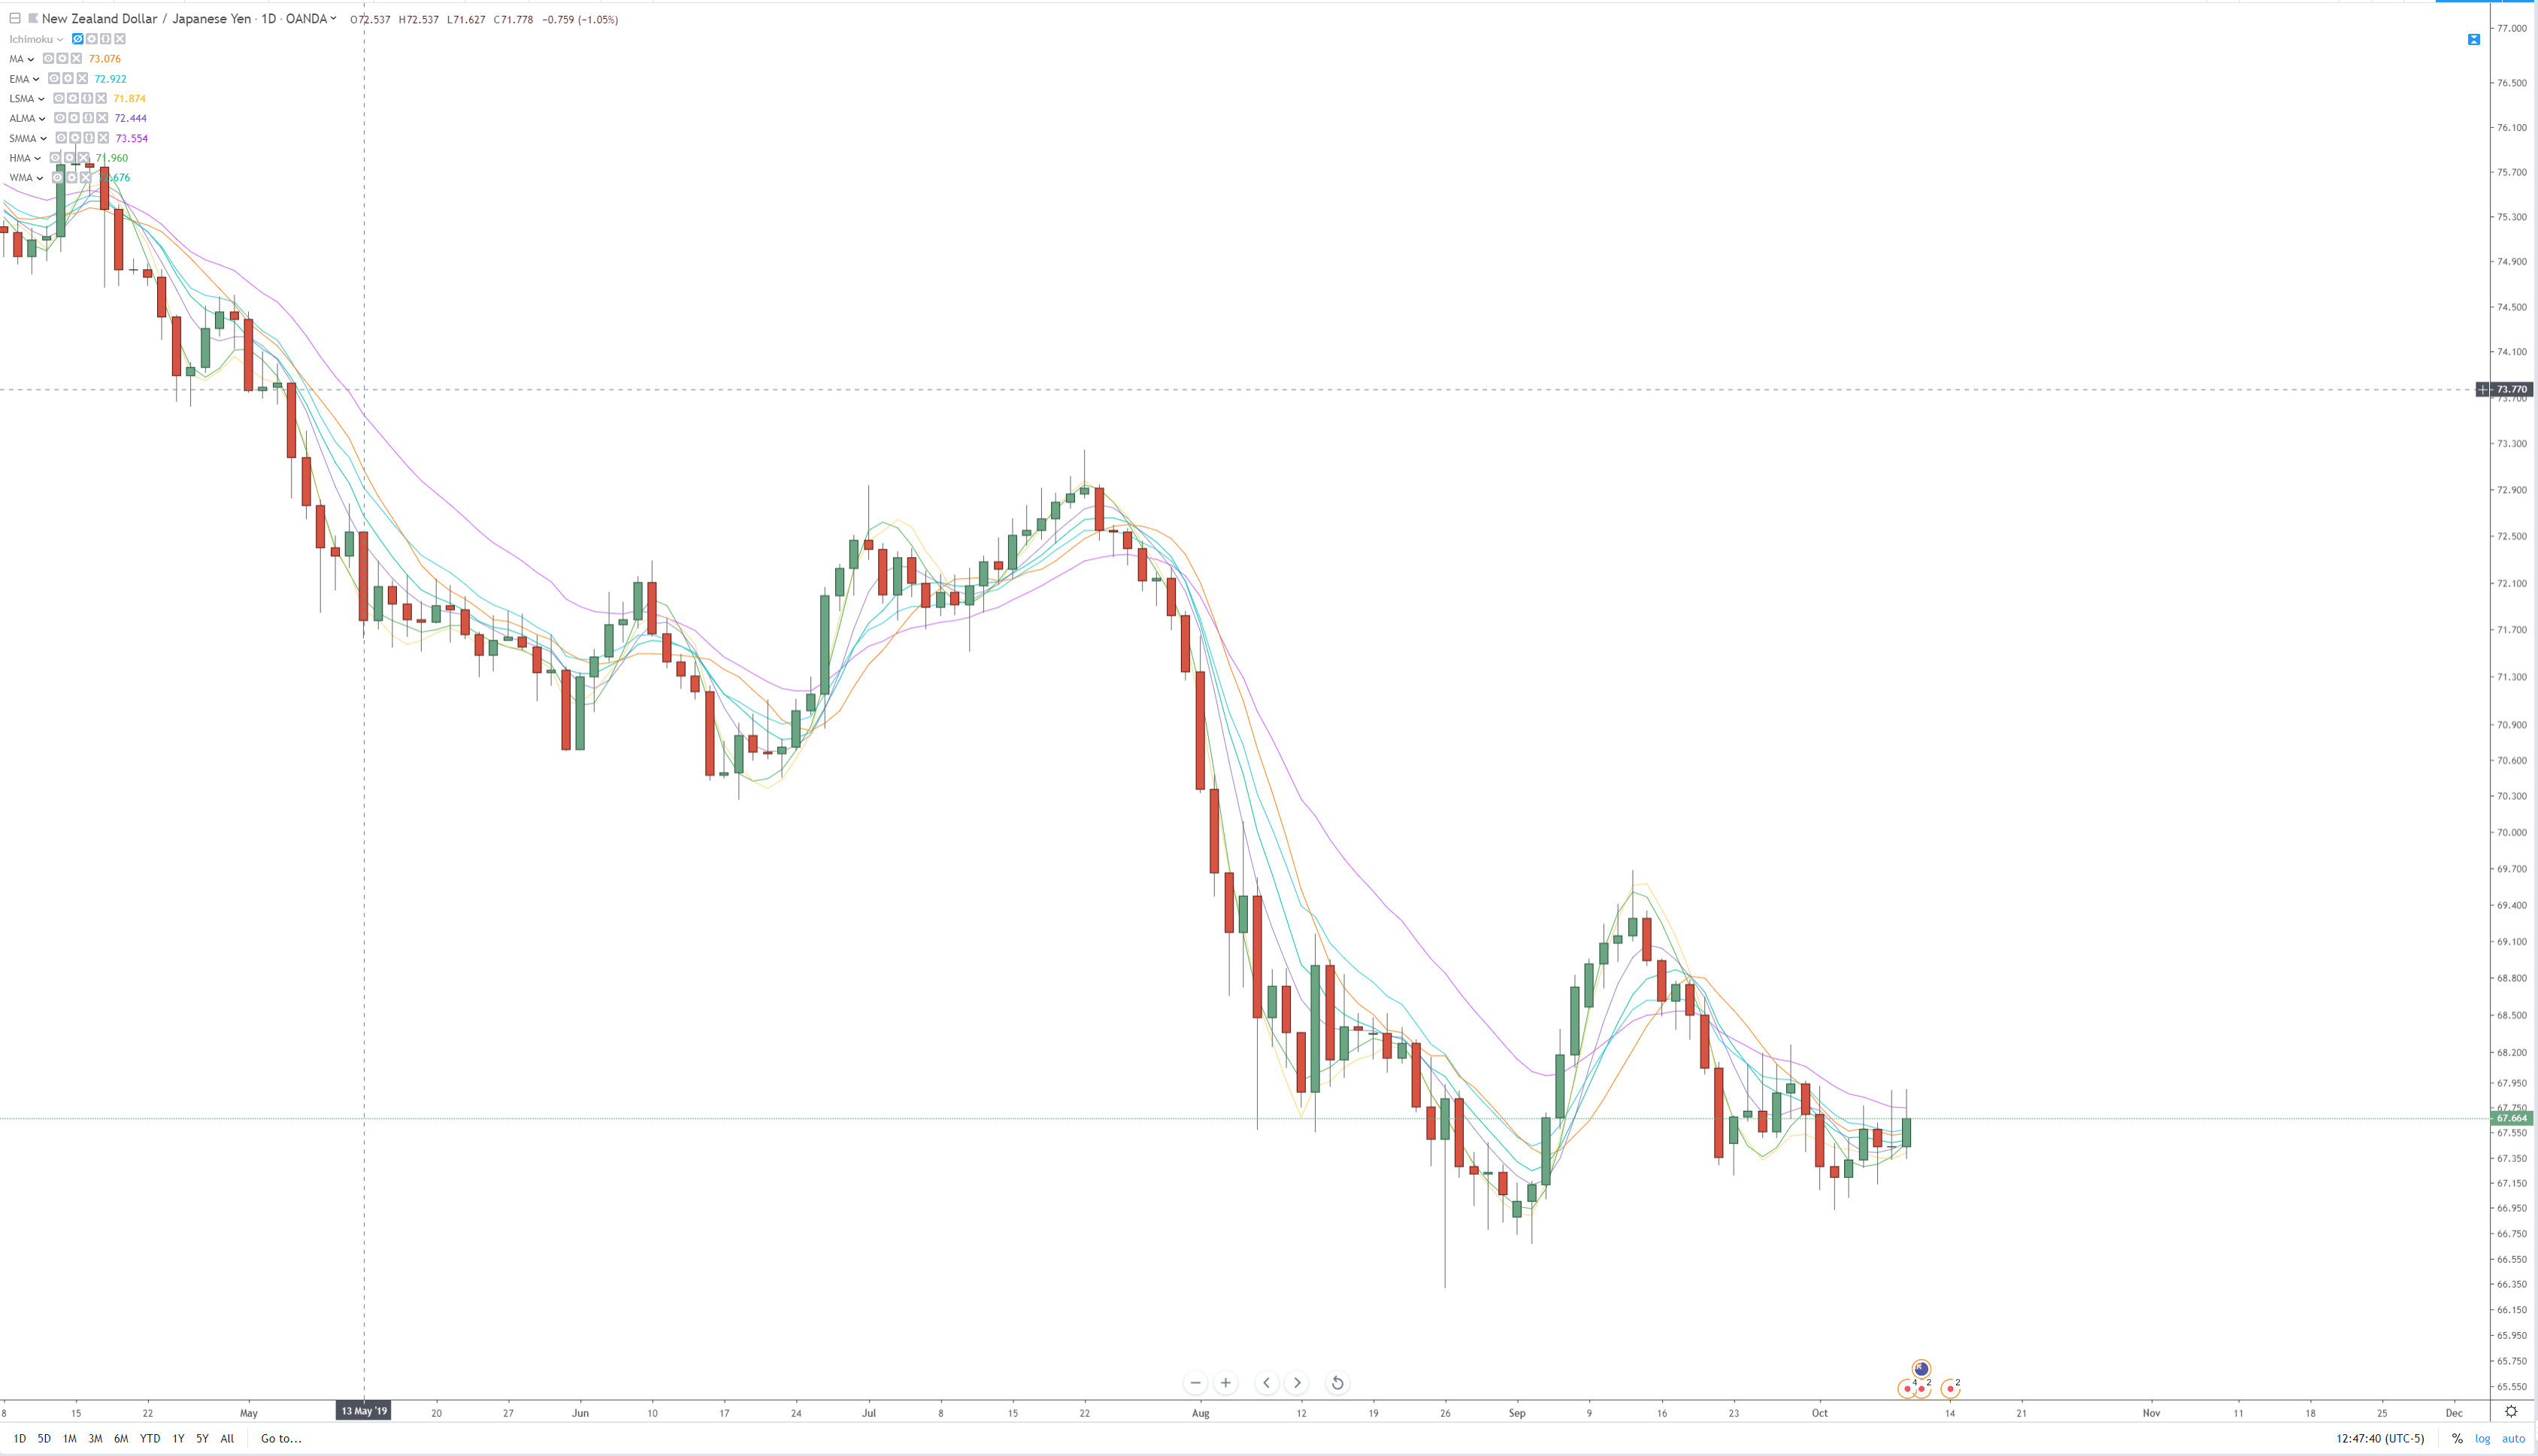
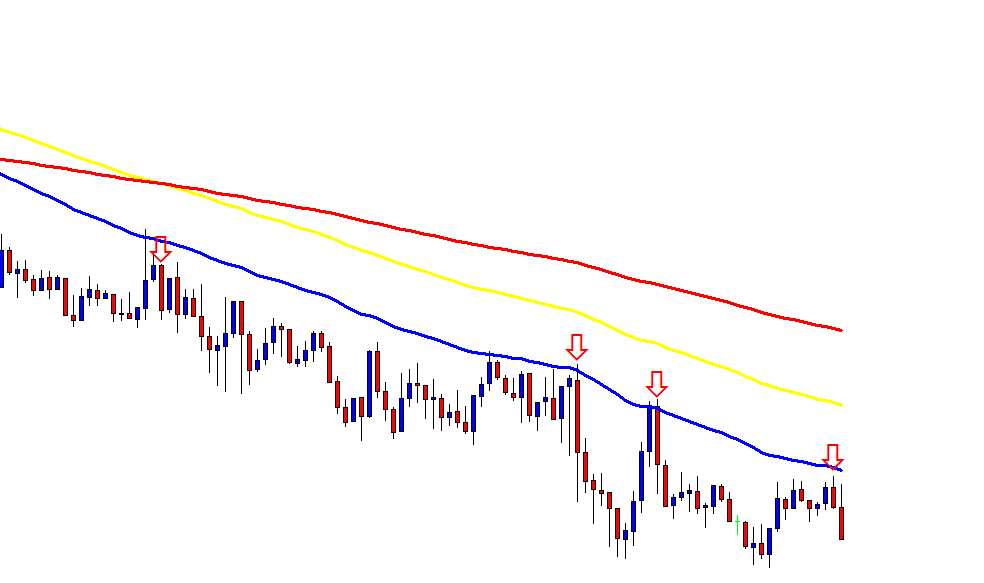
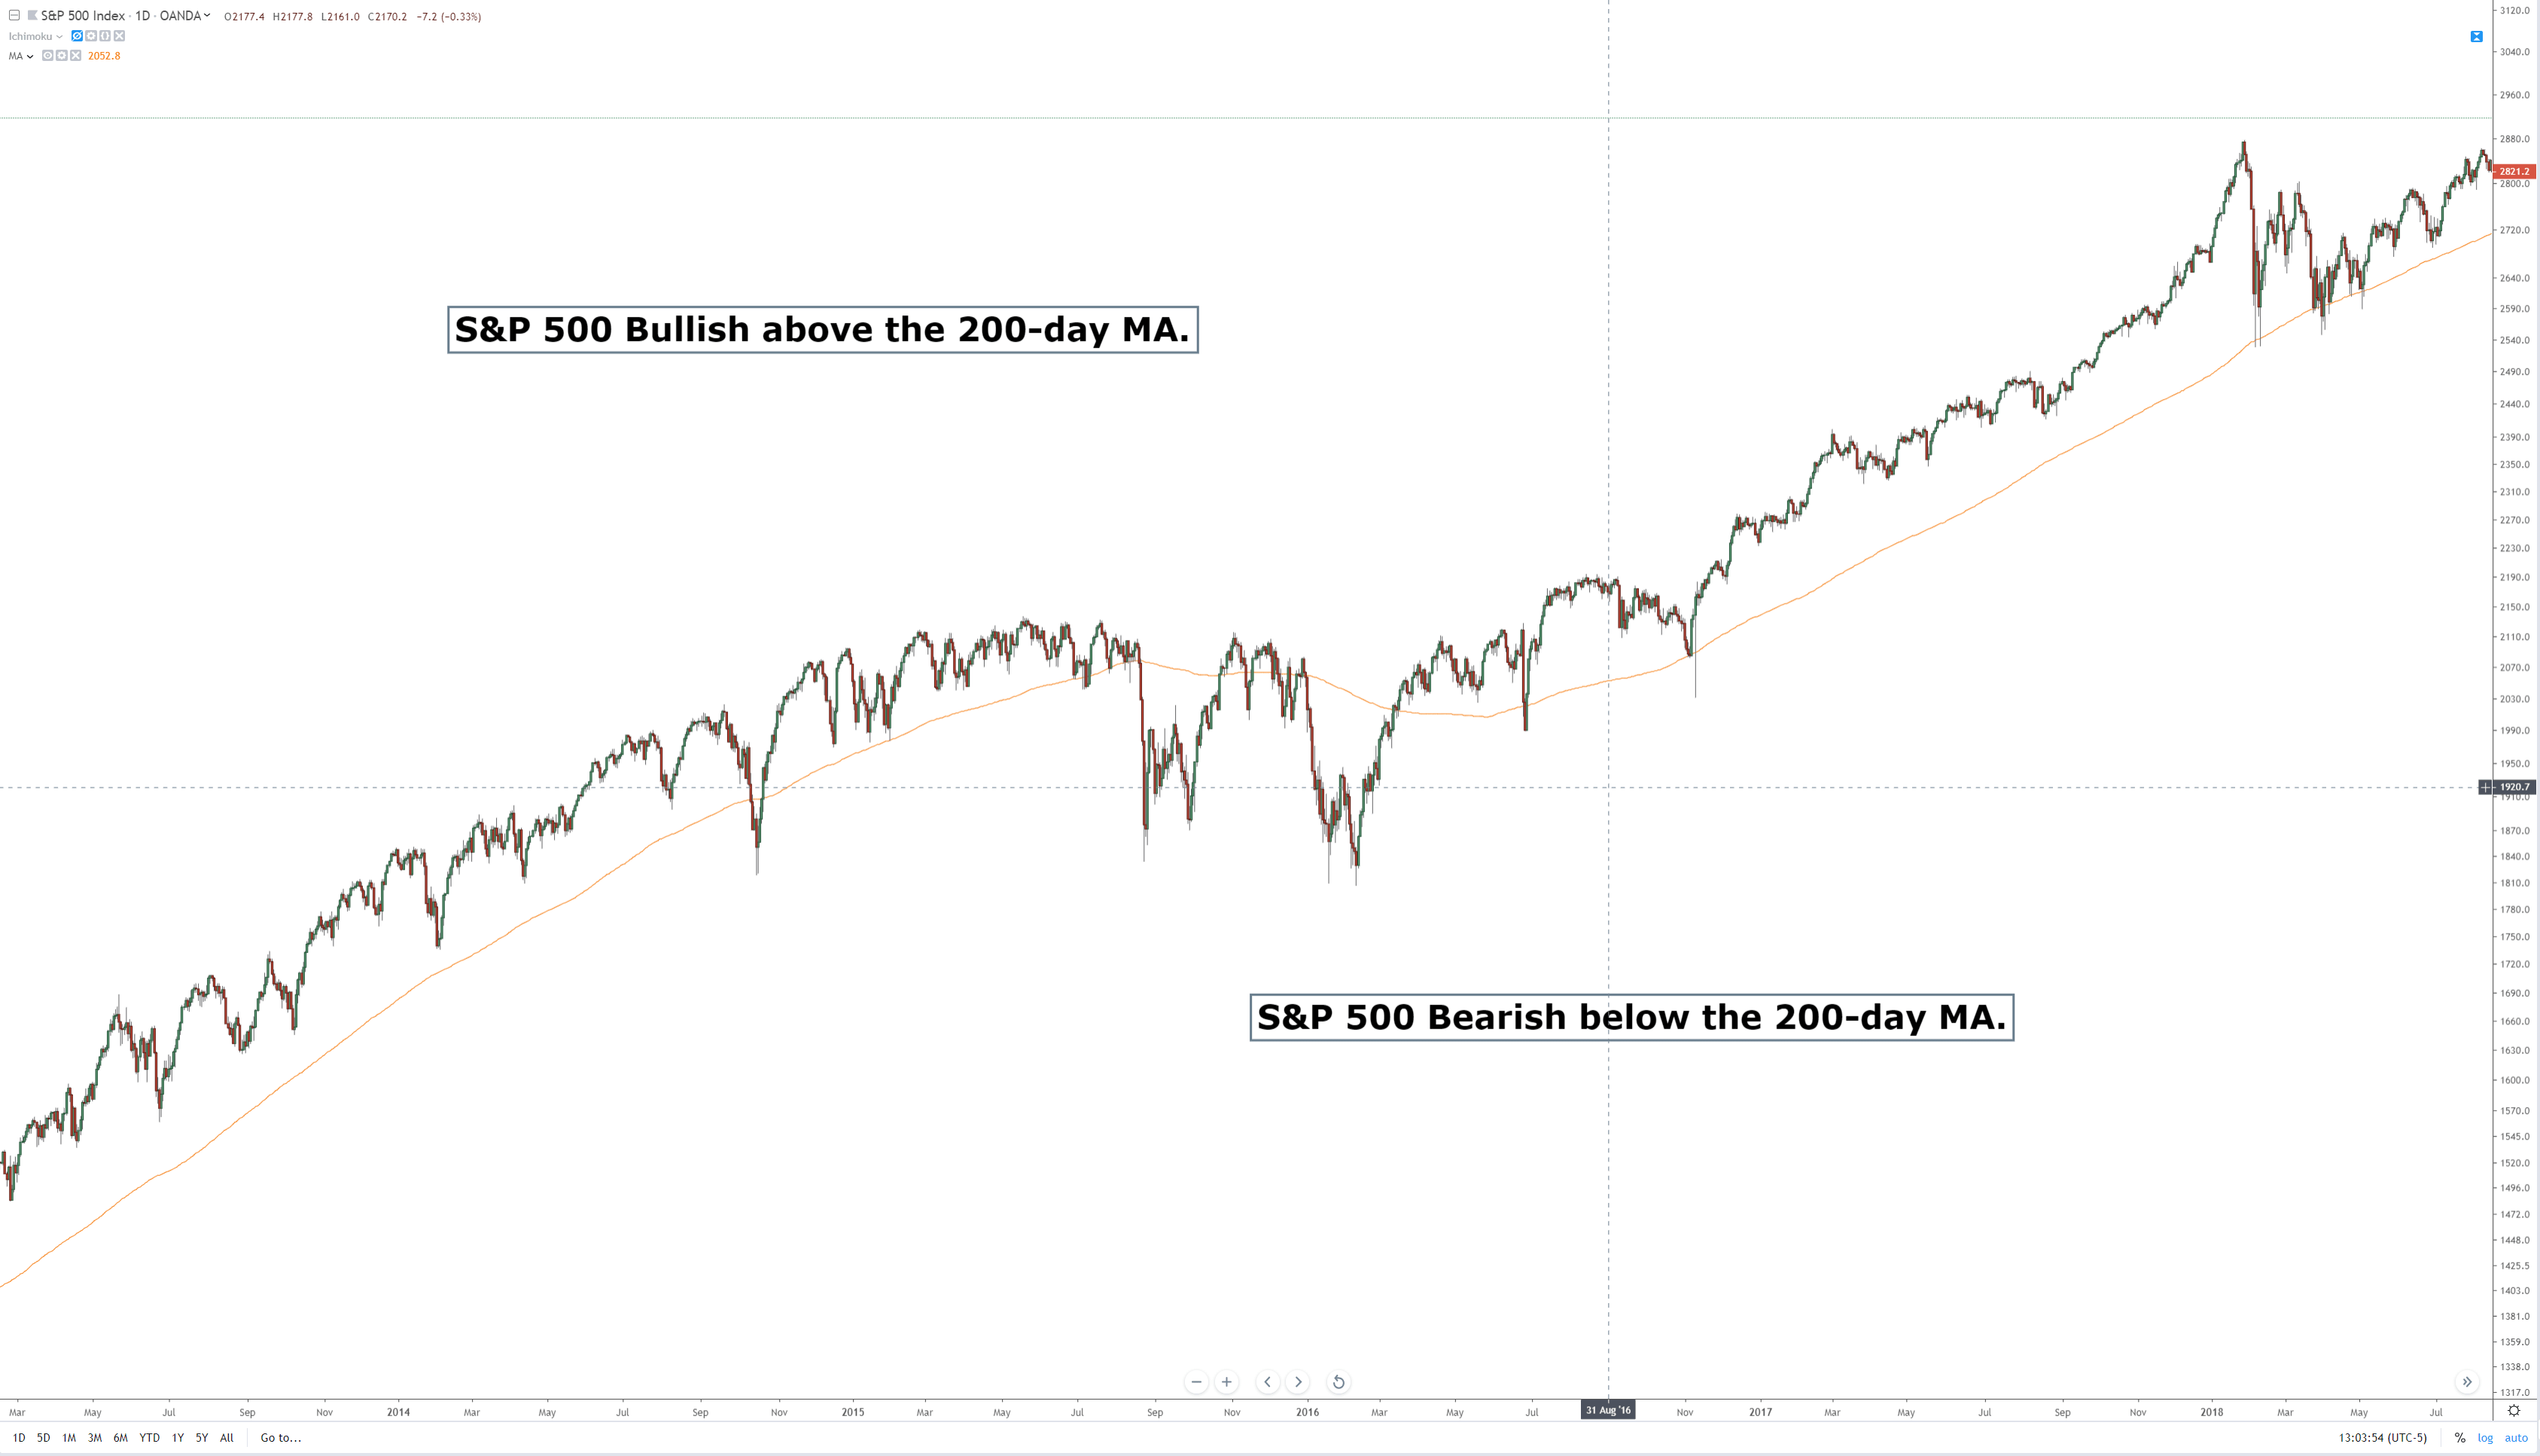
From the image above, you can probably say that, depending on the moving average used, some averages are more responsive to price changes than others. Some move a lot; some move just a little. There is a myriad of different reasons why one moving average would be used over another, and there are specific moving averages that to be used only with particular trading systems and methods. Now, after I’ve bashed moving averages, I think it’s essential that I do show some examples of moving averages positively. The first would be using a long period moving average on a higher time frame. For example, a standard method of determining whether a stock is bullish or bearish is to use a 200-period on a daily chart. If a stock is trading above the 200-day average, it is considered bullish; if it is trading below, it is bearish.

200-day Moving Average of S&P500

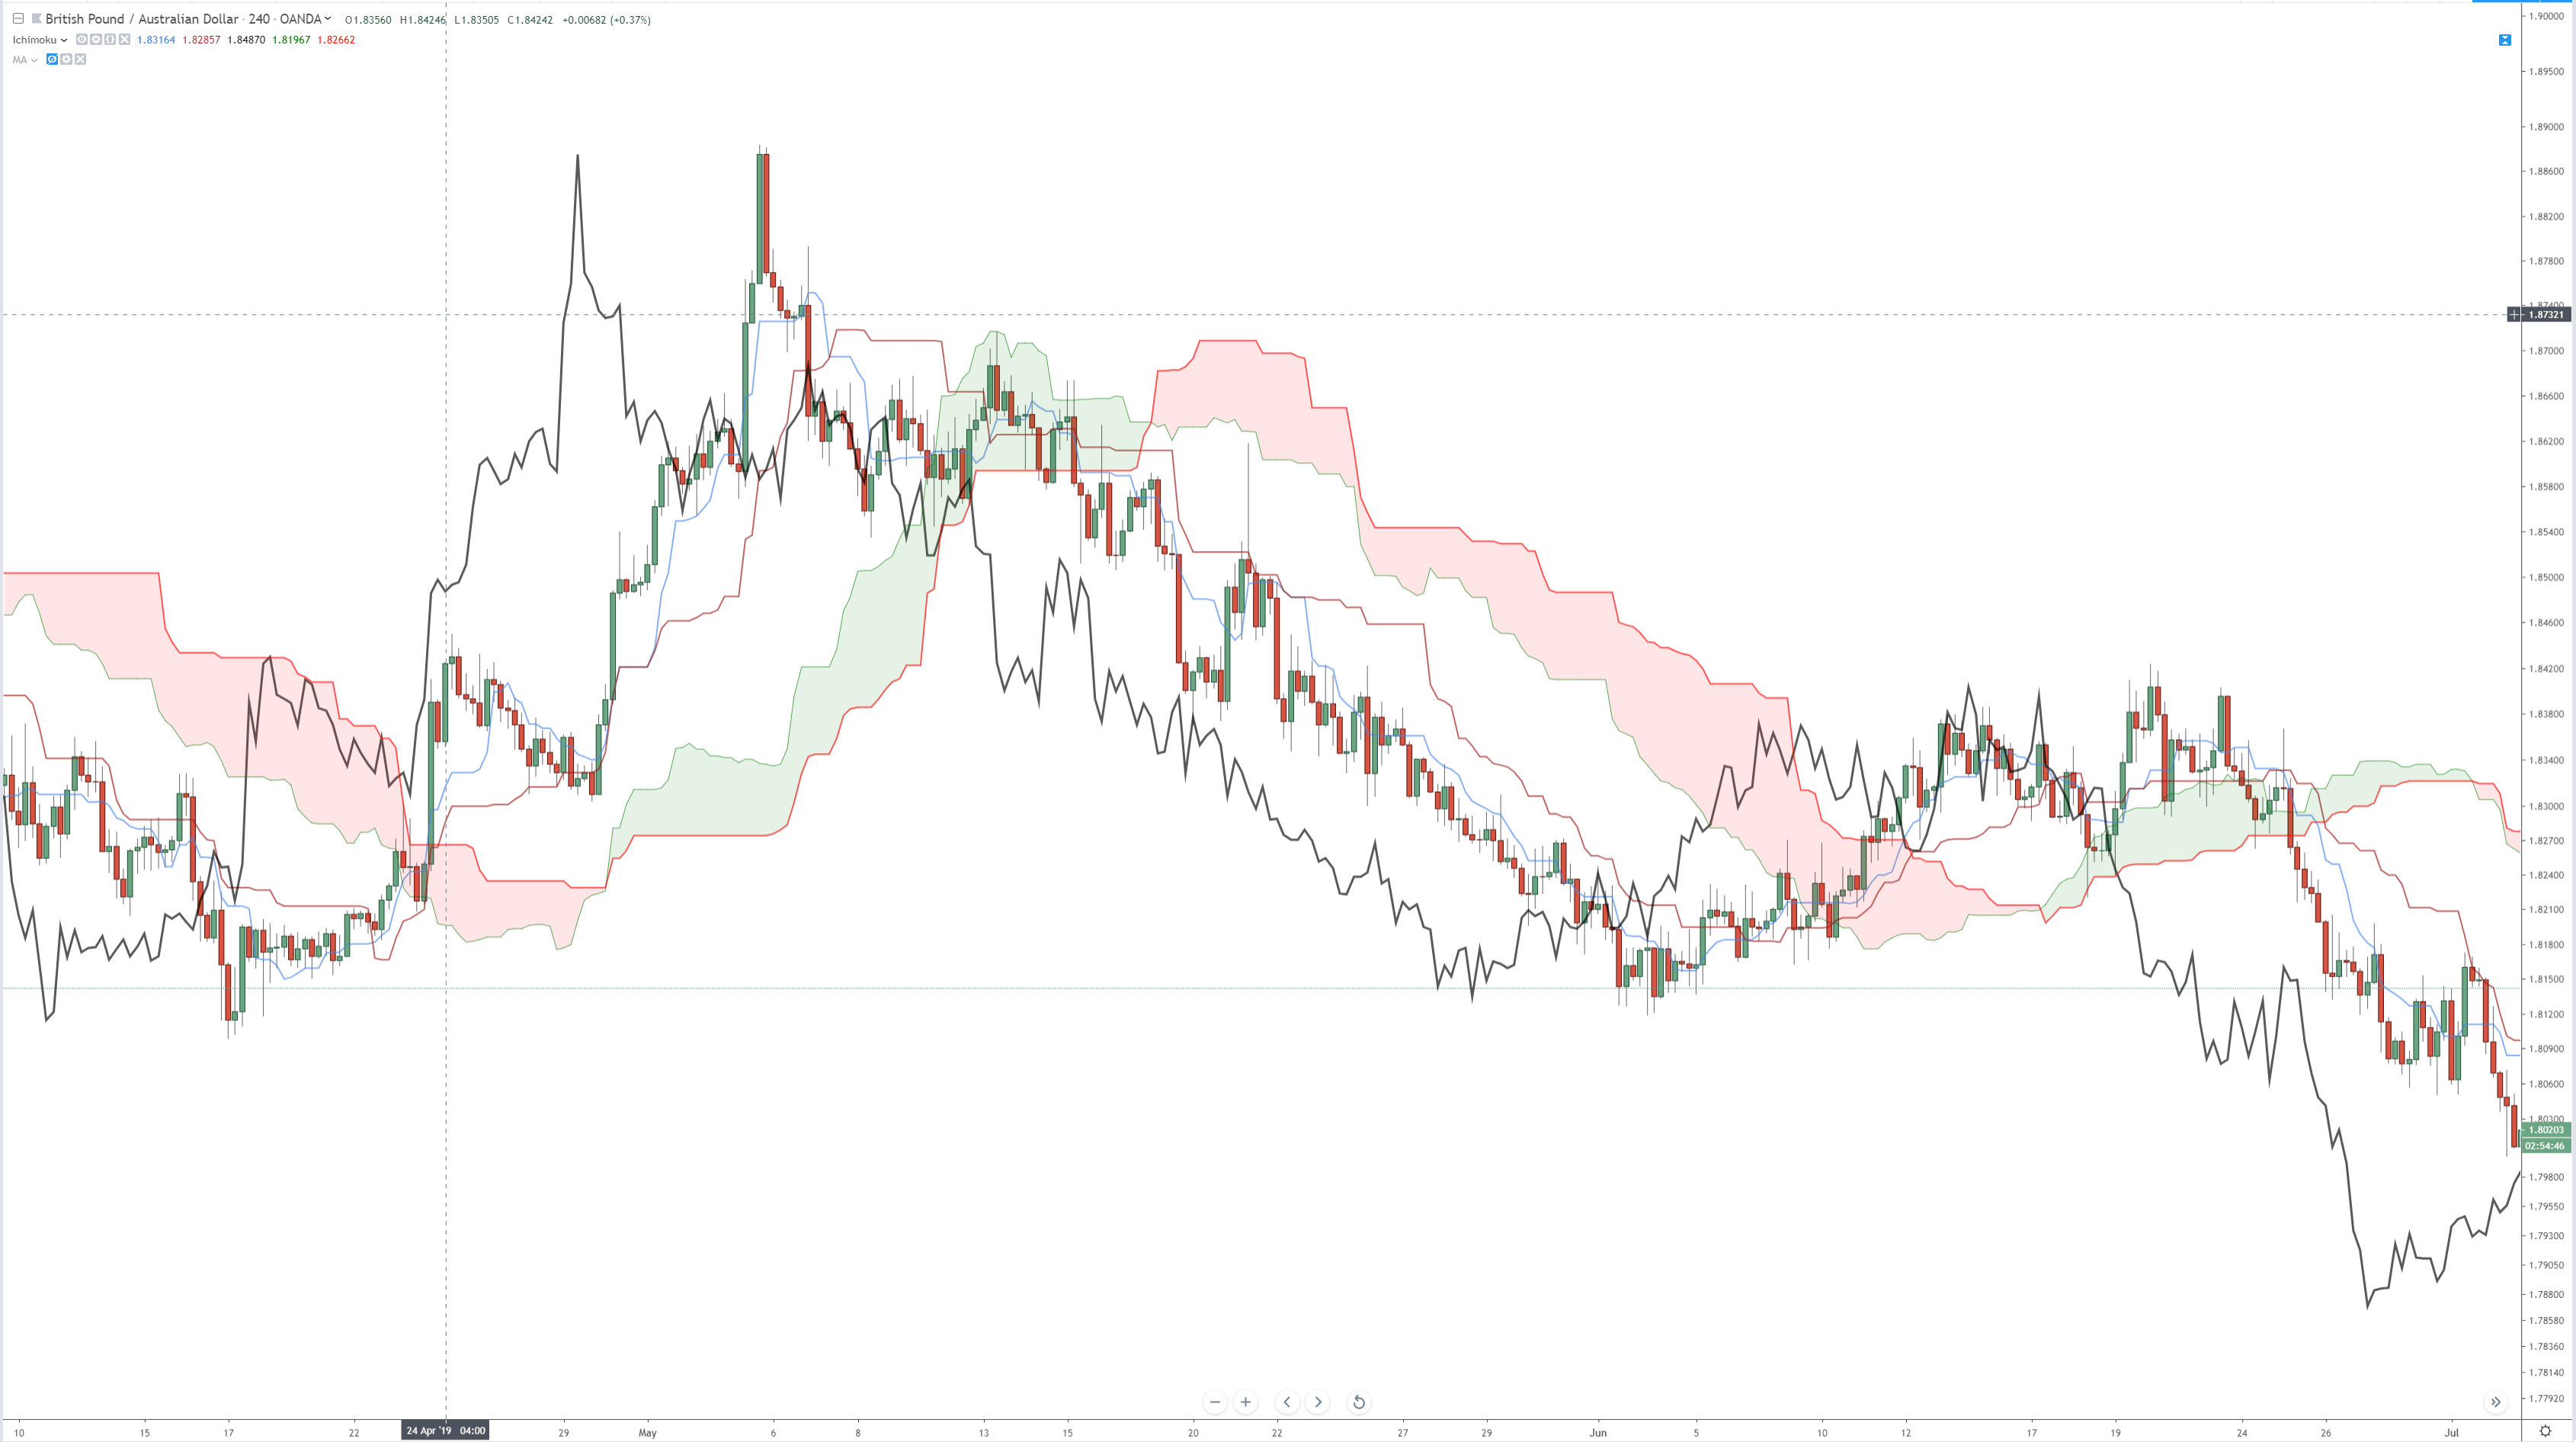
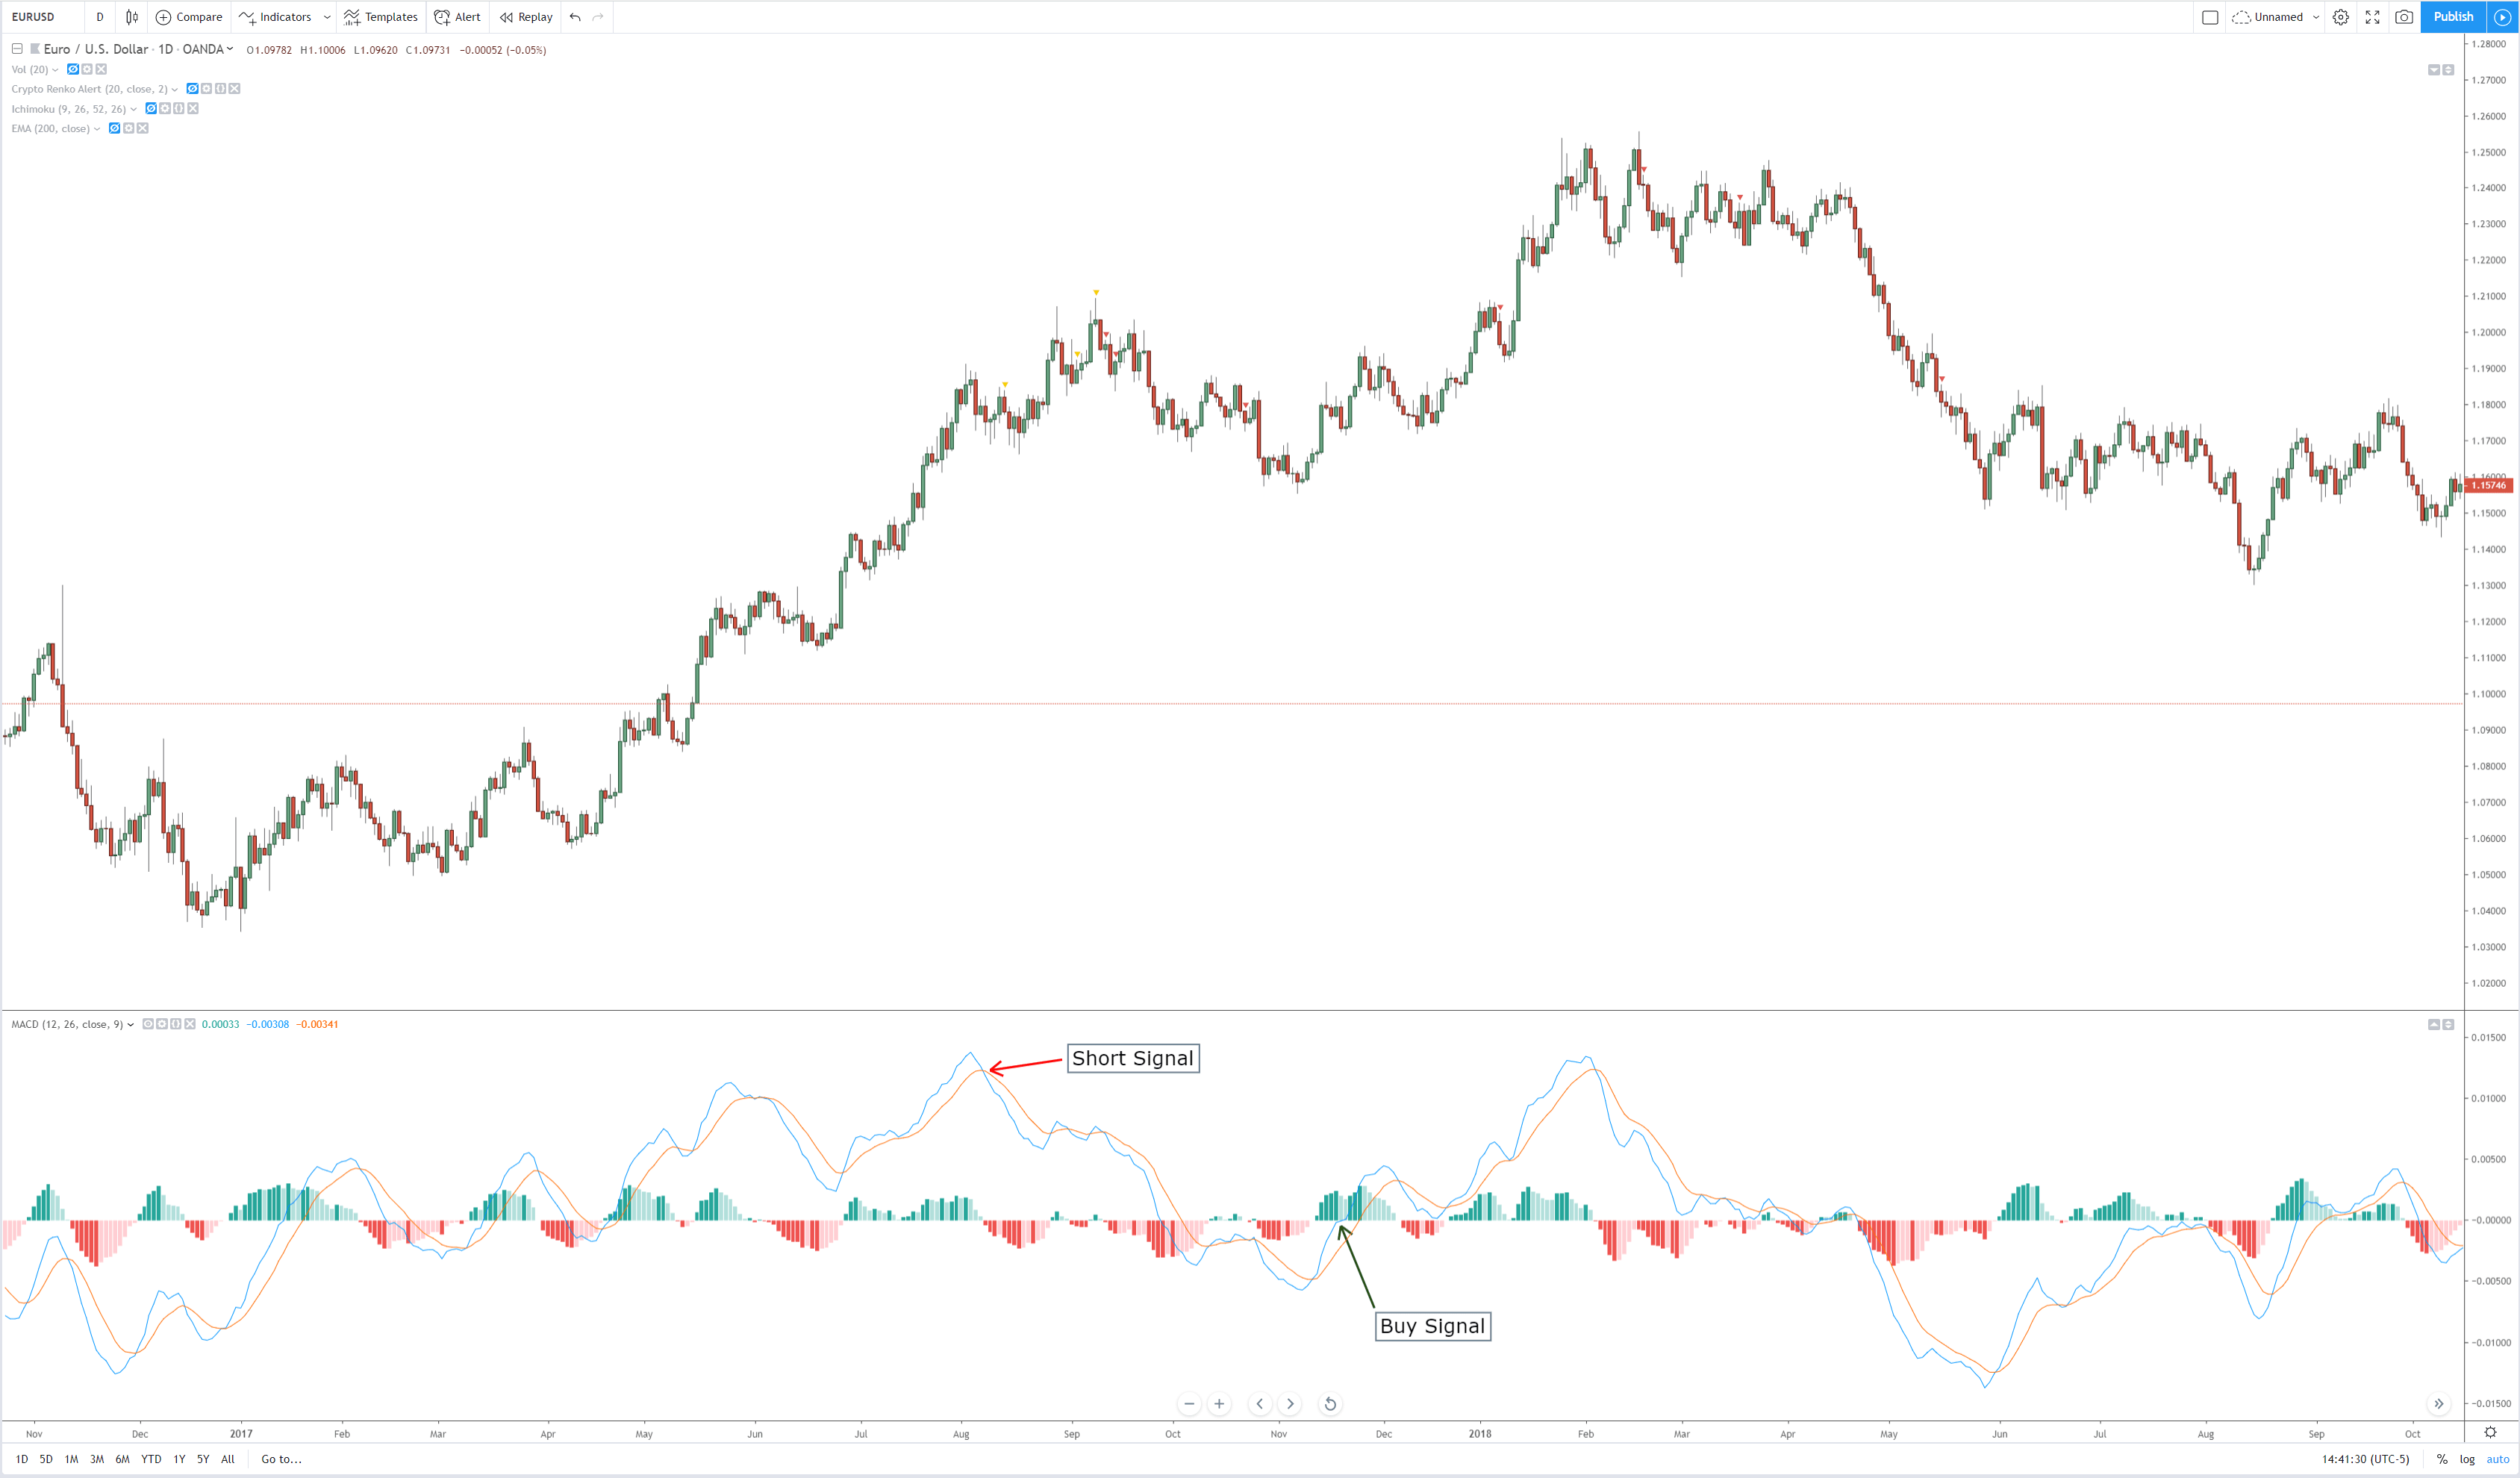
Another example of a trading system using moving averages effectively would be Goichi Hosada’s Ichimoku Kinko Hyo system. This system will be discussed in much greater detail in another article, but the Ichimoku system is based almost entirely on moving averages. There is a significant difference between Western moving averages and Japanese moving averages. The Tenkan-Sen and Kijun-Sen in the Ichimoku system are calculated using the mid-point of the default periods. The utilization of the mid-point is particular not to just the Ichimoku system but is indicative of a large amount of Japanese analysis, which focuses on ‘balance’ and ‘equilibrium.’ So while I do rail against the use of Western moving averages, the use of the Ichimoku system’s moving averages is undoubtedly a significant exception due to it being a full trading system and one of the few trading systems that are a proven and profitable system.

Ichimoku Kinko Hyo
Categories
Forex Basic Strategies

Moving Average Strategies: Three Simple Moving Averages Part 2

In the article “Moving Average Strategies: Three Simple Moving Averages Part 1”, we have come to know how three simple moving averages on a chart help us detect a trend. In this article, we will demonstrate how and where to take entries with the help of ‘Three SMAs”.

A Moving Average is an indicator that shows trends as well as it acts as support/resistance. In a buying market, it acts as support whereas it serves as a resistance in a selling market. Let us have a look at how it works as resistance and offers us entries in a selling market.

We have inserted “Three SMAs” with the value of 200, 100 and 50 on this chart. The chart shows that the price has been down-trending nicely as far as “Three SMAs” rules are concerned. Please notice that every time the price goes back to the 50- Period Simple Moving Average, it comes down. However, in some cases, the price makes a bit bigger move than the others. We need to understand which one is to make a bigger move and offers us an entry. Can you spot out the differences?

Have a look at the same chart below.

Look at the arrowed candle. The price comes down with a better pace and travels more after those marked candles. There are several reasons for this.

  1. The price goes back to the 50- Period Simple Moving Average; touches (or very adjacent to it).
  2. The bearish reversal candles are engulfing candle.

In some cases, the price starts down-trending without touching the 50-Period Simple Moving Average, it does not travel a good distance towards the downside. It rather goes back again; touches it and then makes a bigger move.

At the very left, the first arrowed candle, the bearish engulfing candle does not touch the Moving Average, but one of the bullish candles has had rejection at the 50-Period Simple Moving Average, thus this is an entry. However, see the very next candle comes out as a corrective candle. This means the sellers are not that sanguine since the bearish reversal candle is not produced right at the 50-Period Simple Moving Average.

With the second and third arrowed candles, they are produced right at the 50-Period Simple Moving Average and both of them are bearish engulfing candles. Those two are perfect entries as far as ‘Three SMAs’ is concerned.

At the very right, the last arrowed candle is very adjacent to the 50-Period Simple Moving Average and produces a bearish engulfing candle.  Most likely, the price would head towards the South again. However, “Three SMAs” does not recommend that we shall take an entry here.

We will learn more strategies with Moving Average in our fore coming articles. Keep in touch.


Categories
Forex Indicators

MACD – Moving Average Convergence Divergence

The MACD

Fig 1- Chart with MACD. Click on it to enlarge

The Moving Average Convergence Divergence (MACD) is probably one of the most popular and well-known oscillator indicators in any market. It is one of our ‘modern’ indicators; created by Gerald Appel in the late 70s. It is essentially a two-part tool that traders can utilize.

  1. Provides a quick look to see the direction and trend of your market using two lines/moving averages: the MACD line and a signal line.
  2. It provides a divergence detection tool using a zero line and histogram.

The MACD line and the Signal Line

The first of these parts of the MACD is probably the one used most often, the MACD line and the signal line. General strategies related to the MACD is that you should consider taking a buy when the MACD line crosses above the signal line and sell when the MACD crosses below the signal line. Additionally, some strategies suggest more conservative entries based on when the MACD crosses the middle line (0-line).

The Histogram

The second part of the MACD, and perhaps the one that confuses many new traders, is the histogram with the 0-line. The histogram shows the difference between the MACD line and the signal line, basically, is showing the ‘gap’ between the two lines, as they grow and diverge away from one another, the histogram expands. However, the real strength of this is the ability to see divergences.

Pros and Cons

The downsides to the MACD indicator is that it is very notorious for causing whipsaws in traders. Whipsaws can be avoided by not using the MACD as your sole indicator of trade signals. The MACD is an excellent tool to help confirm your trades in a trending market, but it is not suitable for a ranging market. If you are a new trader, the MACD is a fantastic tool to help you train and learn about how indicators work. Spend some time watching markets live on smaller time frames and look at how the MACD works and moves with that market. You will notice things you like (i.e., identifying the trend and strength of that trend) and the things you don’t like (i.e., too many signals/crosses on short time frames).

A word of caution

I would caution against using the MACD in your trading. The MACD is an old indicator, and it is most useful as a tool for analysis on daily timeframes or weekly time frames. Because it is so well known and used so much by new traders, it is used against new traders. It is one of those indicators use to entice new traders into using – like bait. Just like moving averages, the MACD has several strategies that involve a crossover. A crossover strategy is simple to understand and easy to learn the strategy and so many new traders try to use this as one of their first strategies – but it doesn’t work. It may seem like it works, but it doesn’t. Again, the MACD is an indicator that is entirely lagging in nature. It is showing what has already happened, not what will happen. It’s most effective use will be a tool for detecting divergences – but even then, there are better indicators and oscillators out there for detecting divergences.