Trading with Divergences
Almost all forms of technical analysis involve the use of lagging indicators – or lagging analysis. There are very few indicators that use any type of leading analysis. That is because we don’t know what will happen. All we can do is interpret what kind of future behavior may occur based on past events – this is the basis of all psychology and significant portions of medicine: we can only predict future behavior by analyzing past behavior. Now, just because most of the tools and theories used in technical analysis are lagging in nature – it doesn’t mean that there is no method of leading analysis.
Divergences are one method of turning lagging analysis into leading analysis – it’s not 100% accurate, but divergences can detect anomalies and differences in normal price behavior. Divergences are useful in identifying when a significant trend may be ending or when a pullback may continue in the prior trend direction. Let’s review some of those now.
Divergences are easily one of the most complex components to learn in technical analysis. First, they are challenging to identify when you are starting. Second, it can be confusing trying to remember which divergence is which and if you compare highs or lows. It is essential to know those divergences themselves are not sufficient to decide whether or not to take a trade – they help confirm trades.
When we look for divergences, we are looking for discrepancies between the directions of highs and lows in price against another indicator/oscillator. The RSI is the oscillator used for this lesson. We are going to review the four main types of divergences:
- Bullish Divergence
- Bearish Divergence
- Hidden Bullish Divergence
- Hidden Bearish Divergence
Bullish divergence
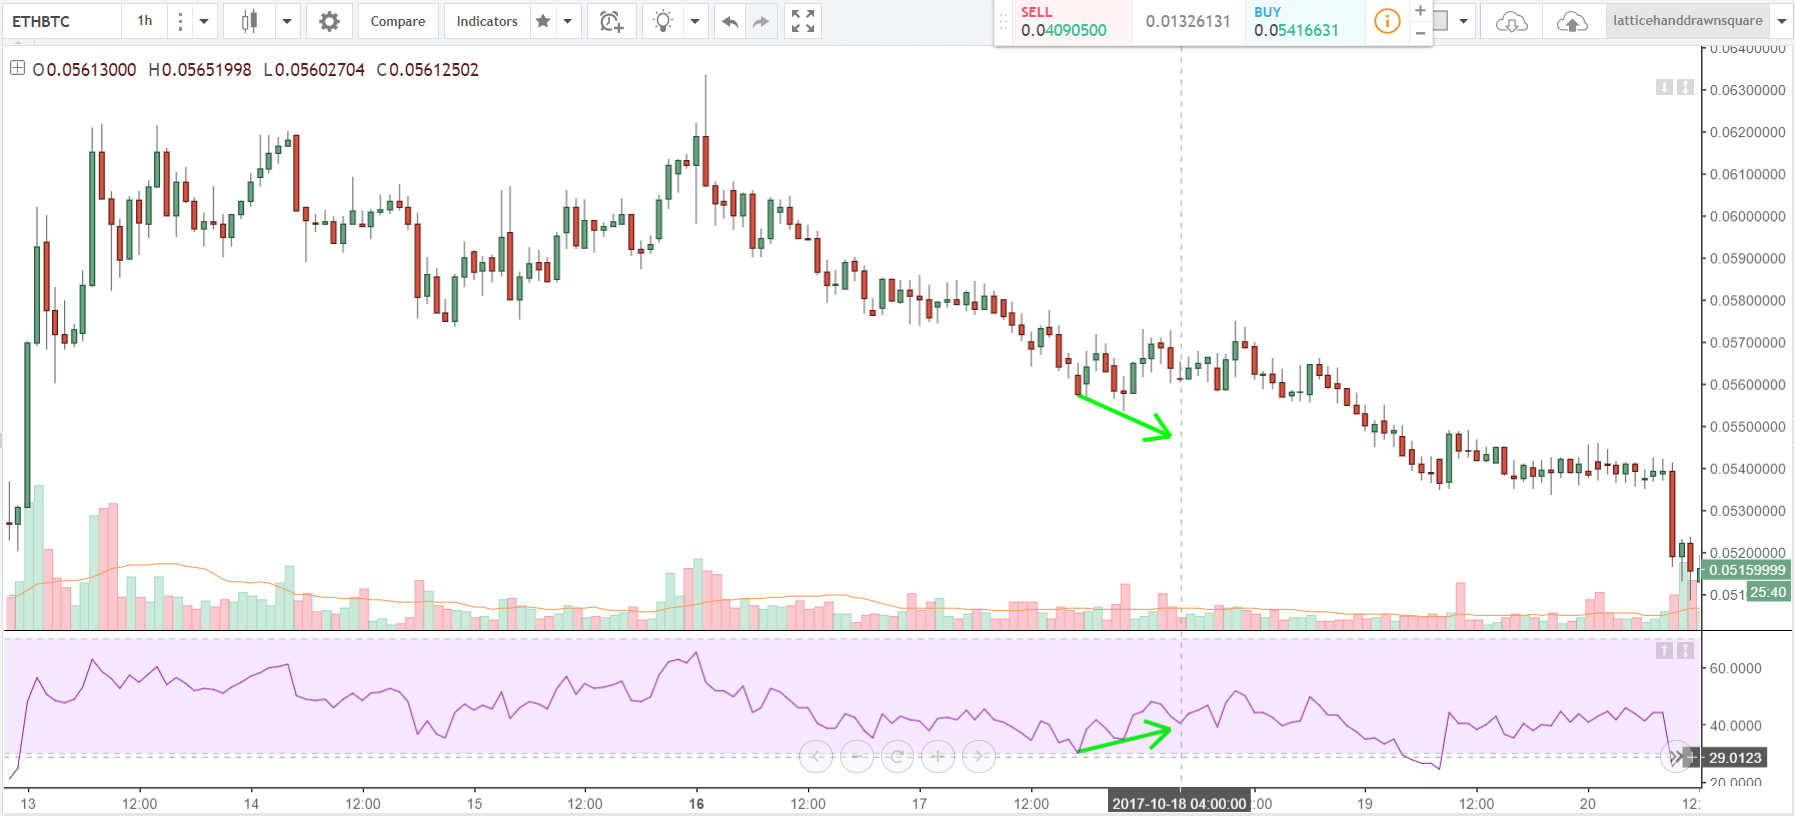
A bullish divergence occurs, generally, at the end of a downtrend. In all forms of bullish divergences, we compare swing lows in price and the oscillator. For a bullish divergence to happen, we should observe price making new lower lows and the oscillator making new higher lows. When bullish divergence occurs, prices will usually rally or consolidate.
Bearish divergence
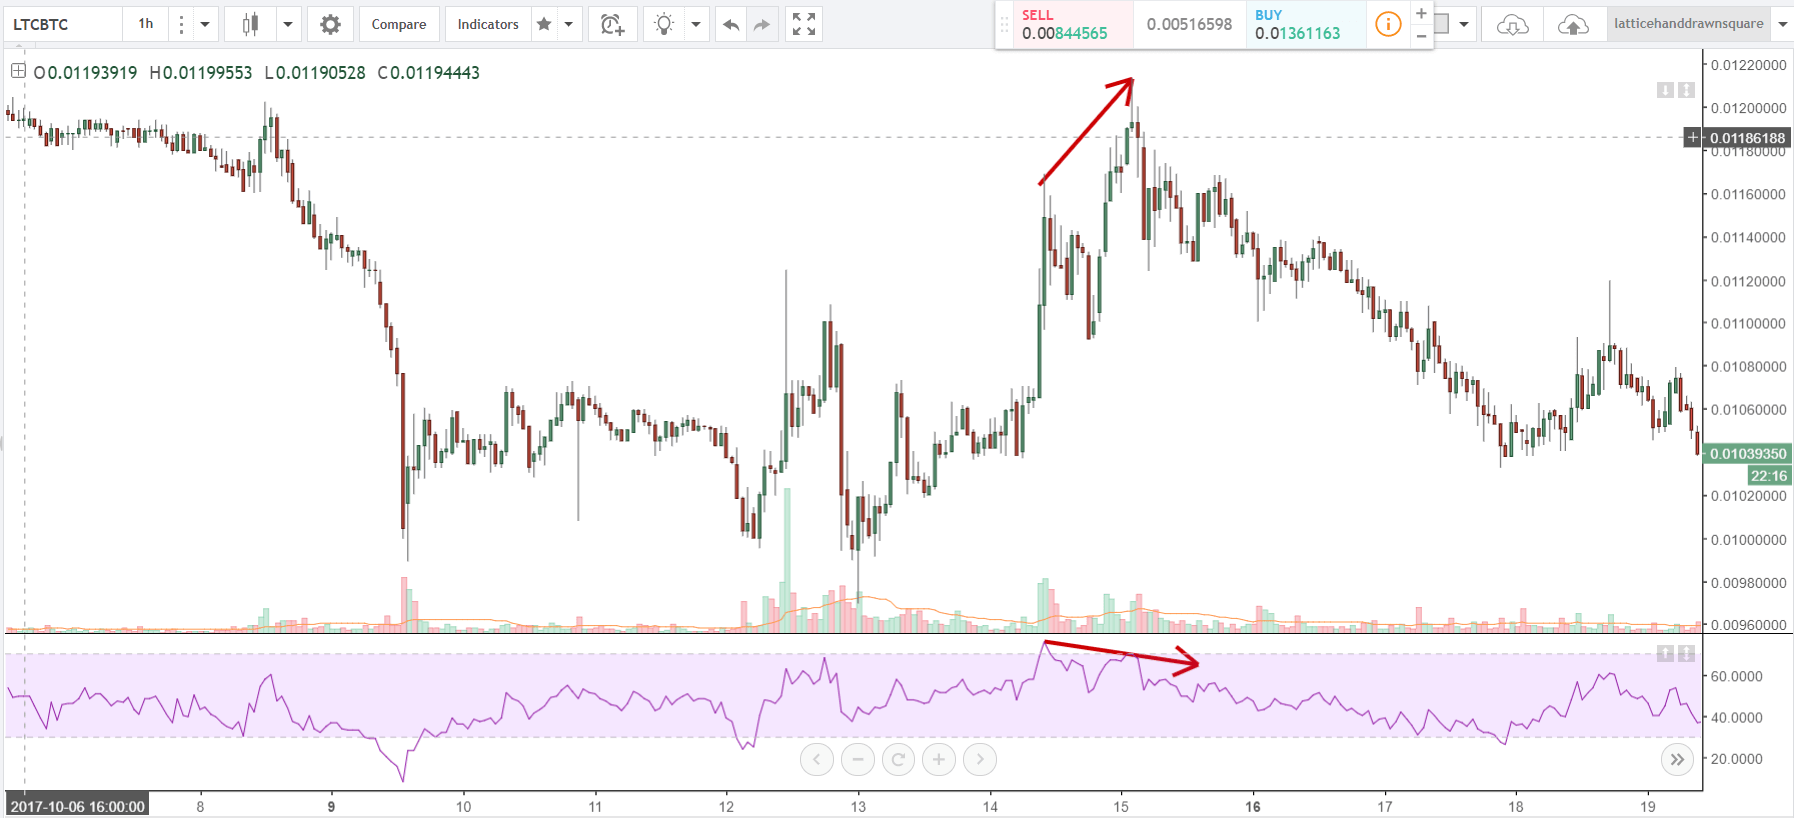
A bearish divergence is the inverse of a bullish divergence. A bearish divergence occurs near the end of an uptrend and gives a warning that the trend may change. In all forms of bearish divergence, we compare swing highs in price and the oscillator. For a bearish divergence to happen, we should observe price making new higher highs and the oscillator making new lower highs.
Hidden divergences
The last two divergences are known as hidden divergences. Hidden does not mean that it is difficult to see or hard to find – rather, it shows where a short term change in direction is actually a continuation move. Think of it as a pullback or a throwback in a larger uptrend or downtrend. Hidden divergences tell you of a probable continuation of a trend, not a broad trend change. If you combine these with common pullback and throwback patterns such as flags and pennants, then the identification and strength of a hidden divergence can yield extremely positive results.
Hidden Bullish Divergence
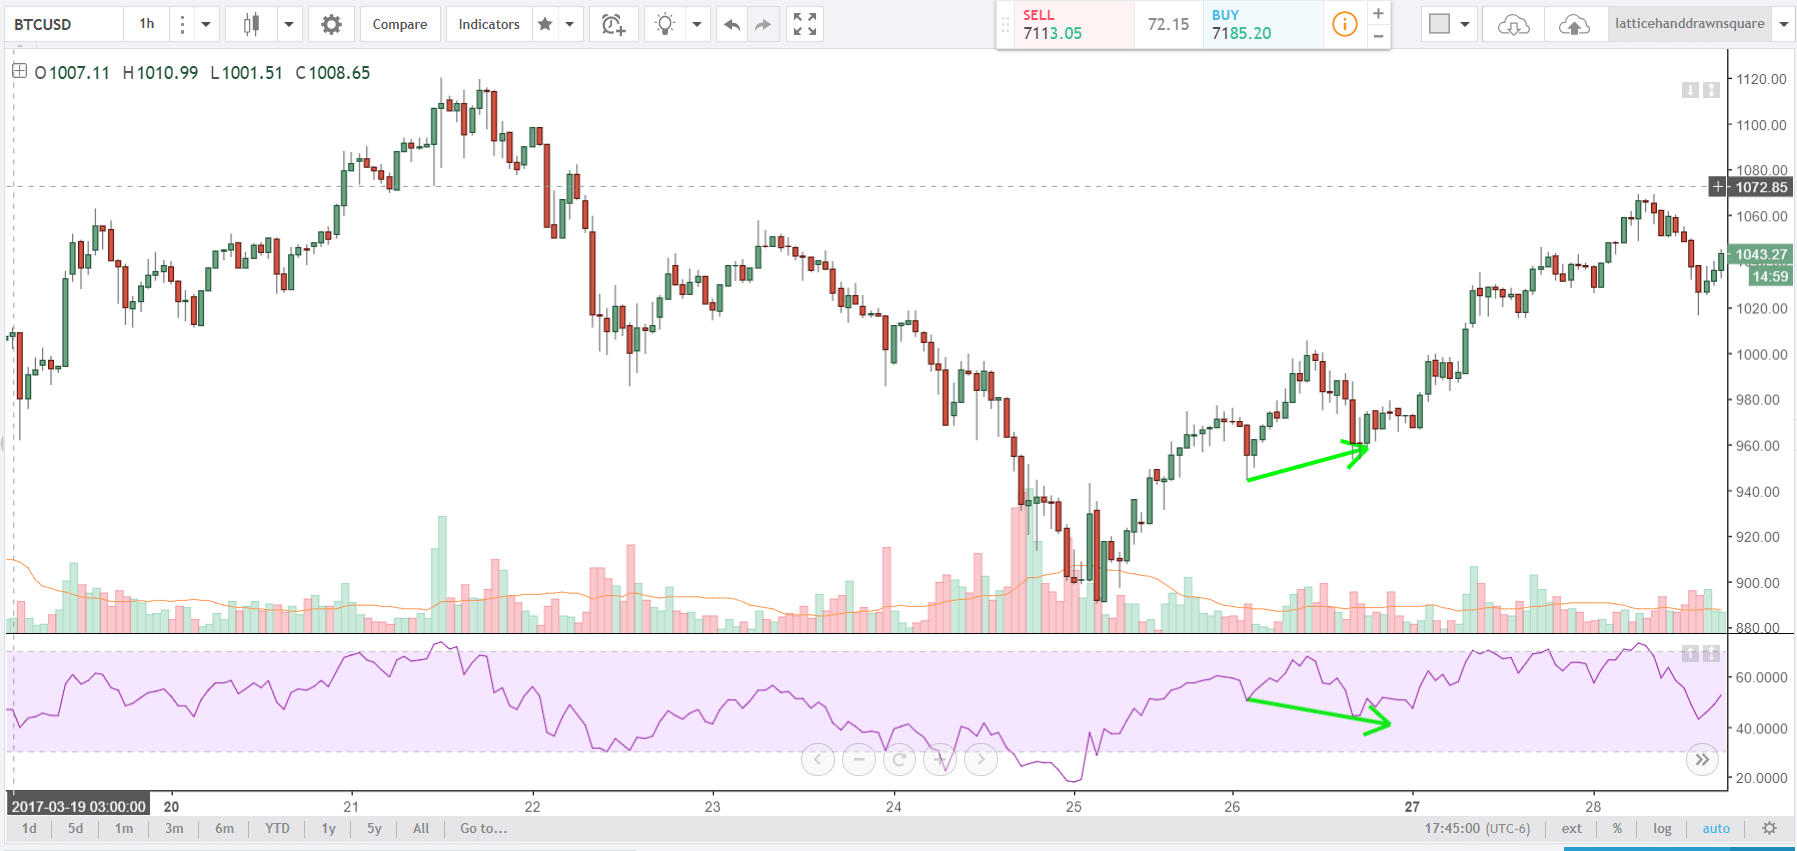
A hidden bullish divergence can appear in uptrends and downtrends but is only valid if there is an existing uptrend. It’s easier to think of hidden bullish divergences as pullbacks or continuation patterns. For hidden bullish divergences, we should observe price making new higher lows and the oscillator making new lower lows. The expected price behavior is a continuation of higher prices.
Hidden Bearish Divergence
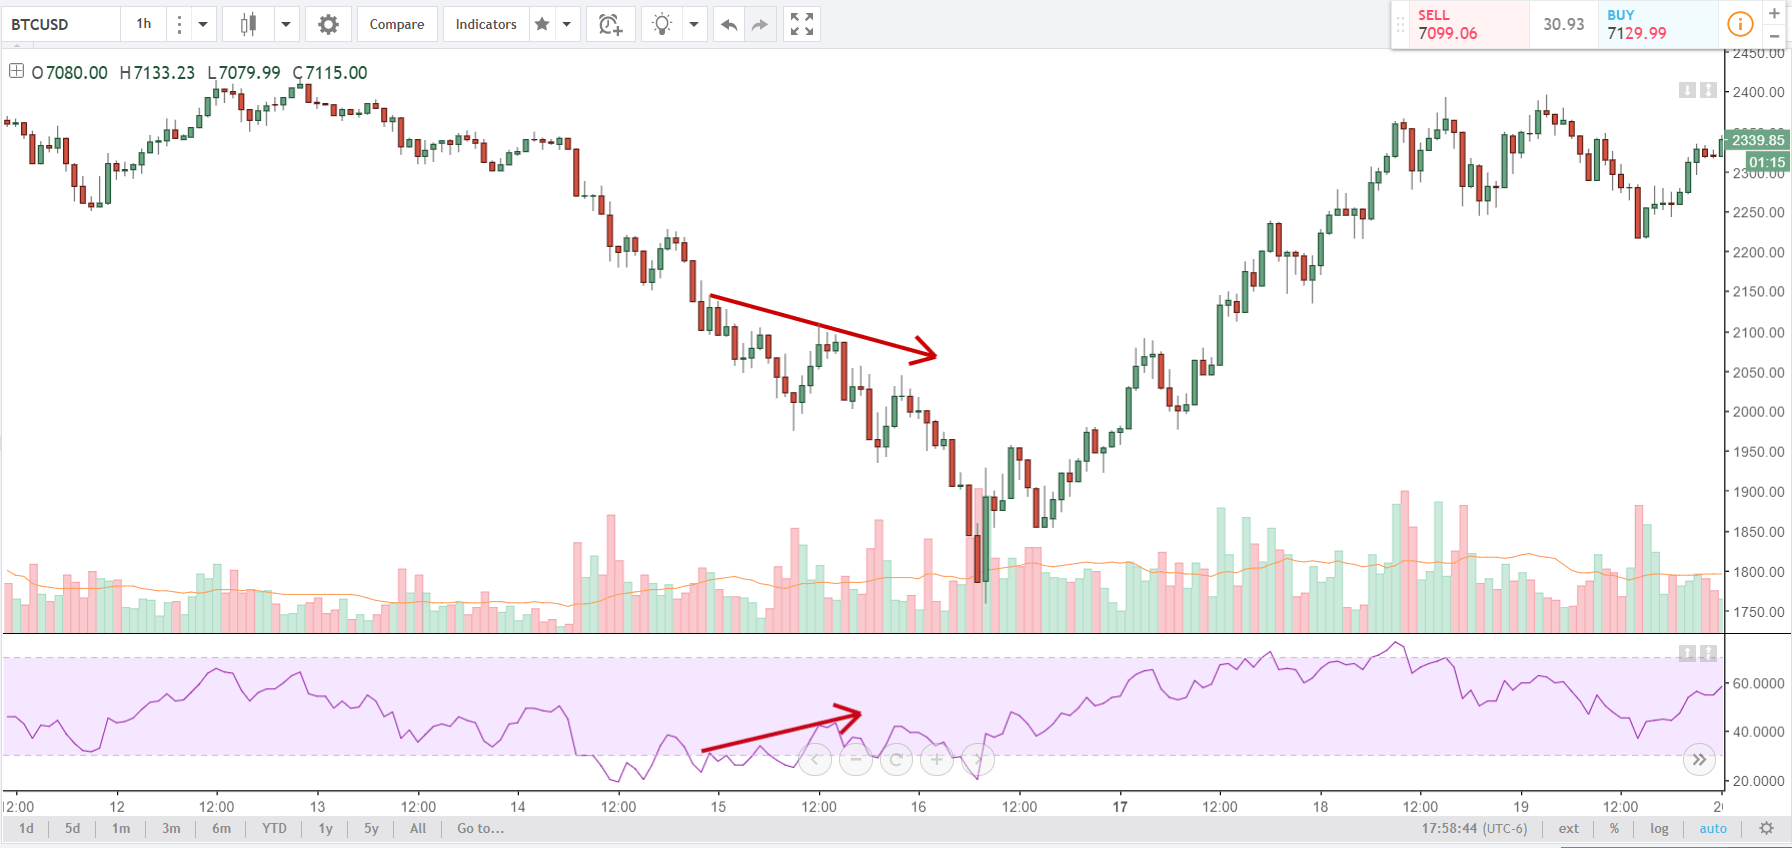
Our final divergence is hidden bearish divergence. Just like hidden bullish divergence, hidden bearish divergence can appear in both uptrends and downtrends but is only valid in an existing downtrend. Hidden bearish divergence is identified when price makes lower highs, and the oscillator makes new higher highs. We should observe a resumption in the prior downtrend when hidden bearish divergence is identified.
Key Points
Regular Bullish Divergence
- End of a downtrend.
- Often the second swing low.
- Price makes new Lower Lows, but the oscillator makes Higher Lows.
- Trend changes to the upside.
Regular Bearish Divergence
- End of an uptrend.
- Often the second swing high.
- Price makes Higher Highs, but the oscillator makes Lower Highs.
- Trend changes to the downside.
Hidden Bullish Divergence
- Valid only during an uptrend.
- Price makes Higher Lows, but the oscillator makes a Lower Low.
- The trend should continue to the upside.
Hidden Bearish Divergence
- Valid only during a downtrend.
- Price makes Lower Highs, but the oscillator makes Higher Highs.
- The trend should continue to the downside.
Final words
It may be confusing trying to remember which divergence is which and you’ll find yourself asking questions such as, “do I use highs on this divergence or lows?” It’s easier to think about measuring divergences like this:
All Bullish divergences are going to compare lows to lows – lows in price and lows in an oscillator.
All Bearish divergences are going to compare highs to highs – highs in price and highs in an oscillator.


