Introduction
In the previous lesson, we discussed regular divergence and its types. In this lesson, we shall continue with the second type of divergence – hidden divergence. The concept of divergence in this type remains the same but differs in the indication it provides.

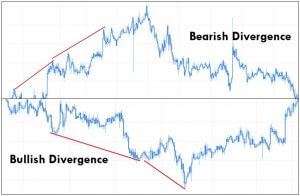
What is the Hidden Divergence?
In a trending market, the prices make higher highs or lower lows. In addition to that, it sets in higher lows or lower highs as well. When the market prepares to reverse, the lower low or higher high turns to equal high or equal low. The higher lows or lower highs become the other way round. And in the new leg of the trend, if there is divergence, it is referred to as hidden divergence.
In simple terms, hidden divergence is used to indicate trend continuation in the middle of a trend or typically at the beginning of a new trend.
Types of Hidden Divergence
There are two types of Hidden divergence based on the direction it indicates:
- Hidden Bullish Divergence
- Hidden Bearish Divergence
Let’s understand how each of them is formed with examples as well.
Hidden Bullish Divergence
In a downtrend, the market makes lower lows and lower highs. In preparation for a reversal, it leaves a higher low instead of a lower low. Also, there could be a higher high or equal high. In this price action, if there is a lower low in the oscillator, it indicates a hidden bullish divergence. It signals that the price could continue to go north.
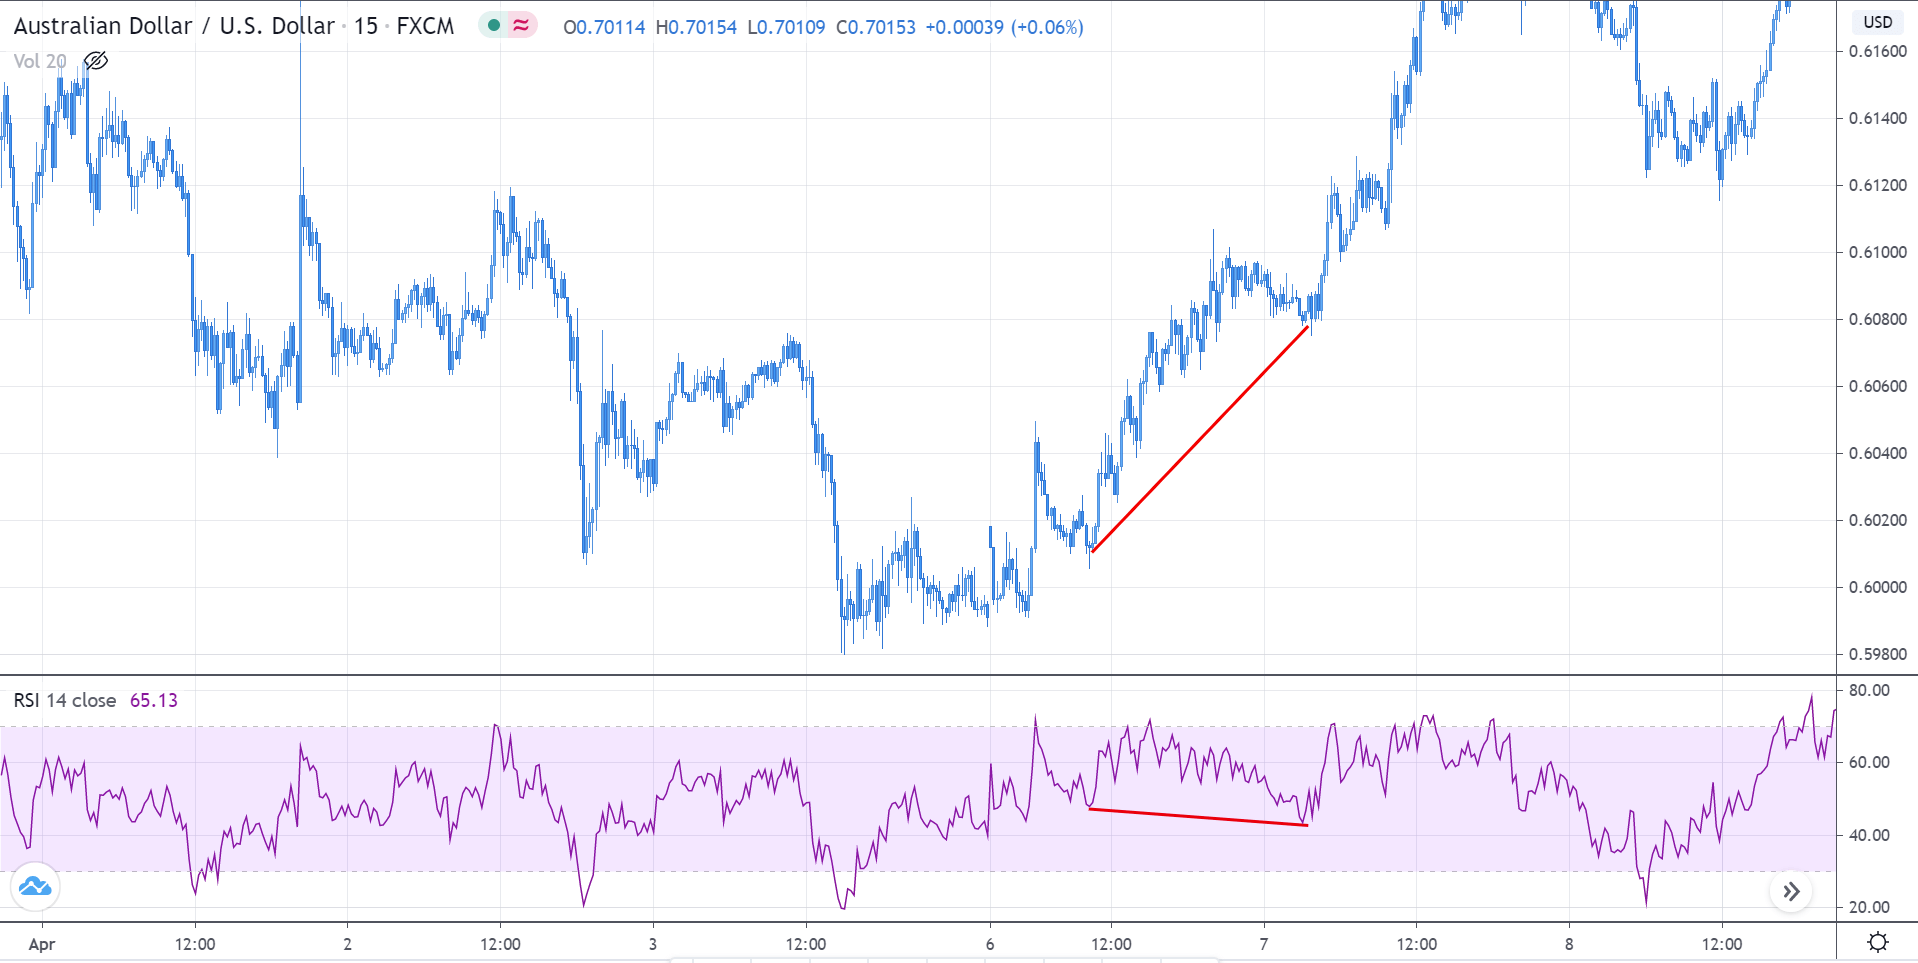
In the above chart of AUD/USD, we can see that the market is coming from a downtrend. Later, the market does not hold at S&R to make a new lower low but makes a higher low. Looking at the indicator, it leaves a lower low. Hence, showing divergence and indicating that the market has turned into an uptrend and will possibly continue its move up.
Hidden Bearish Divergence
In the market goes into a transition from an uptrend to a downtrend, the price which was making higher highs now starts to make lower highs. In addition, the oscillator puts in a higher high for the lower high in the price chart. Thus, showing a hidden bearish divergence. It is an indication that the market is going to continue in a downtrend.
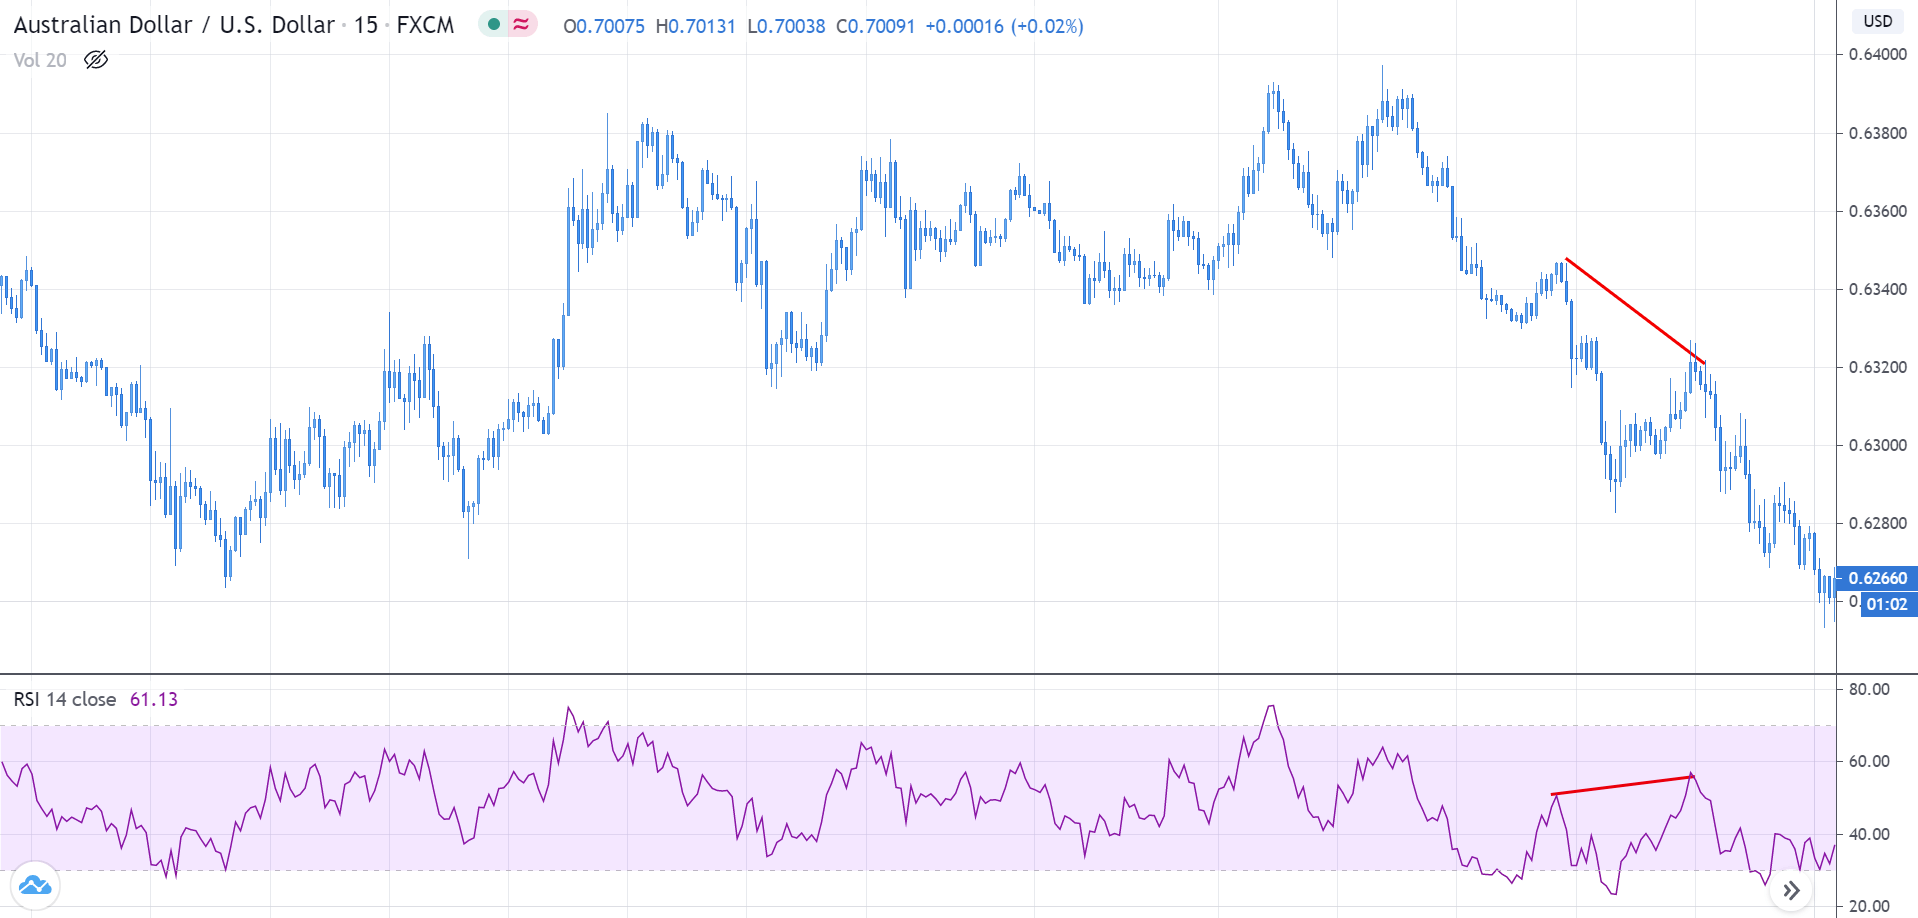
In the above chart of AUD/USD, the market was initially coming from an uptrend making higher highs. Later, it turned directions and made a higher low instead of a higher high. But the RSI made a higher high for the same move. Thus, indicating divergence and most probable continuation of the downtrend. [wp_quiz id=”77847″]