Categories
Forex Course

133. Divergence Cheat Sheet and Summary

Introduction

The previous chapters dealt with the interpretation of divergence, its types, strategies, and the rules involved in it. In this article, we have provided a cheat sheet that will cover all the divergence topics in short.

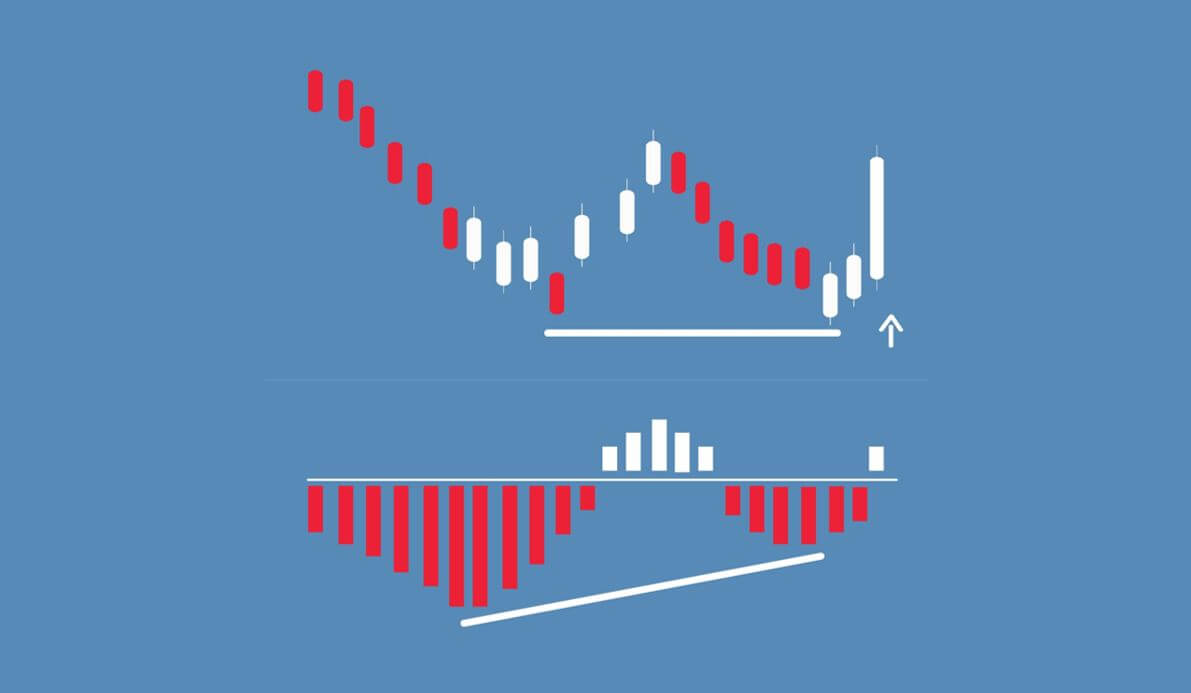
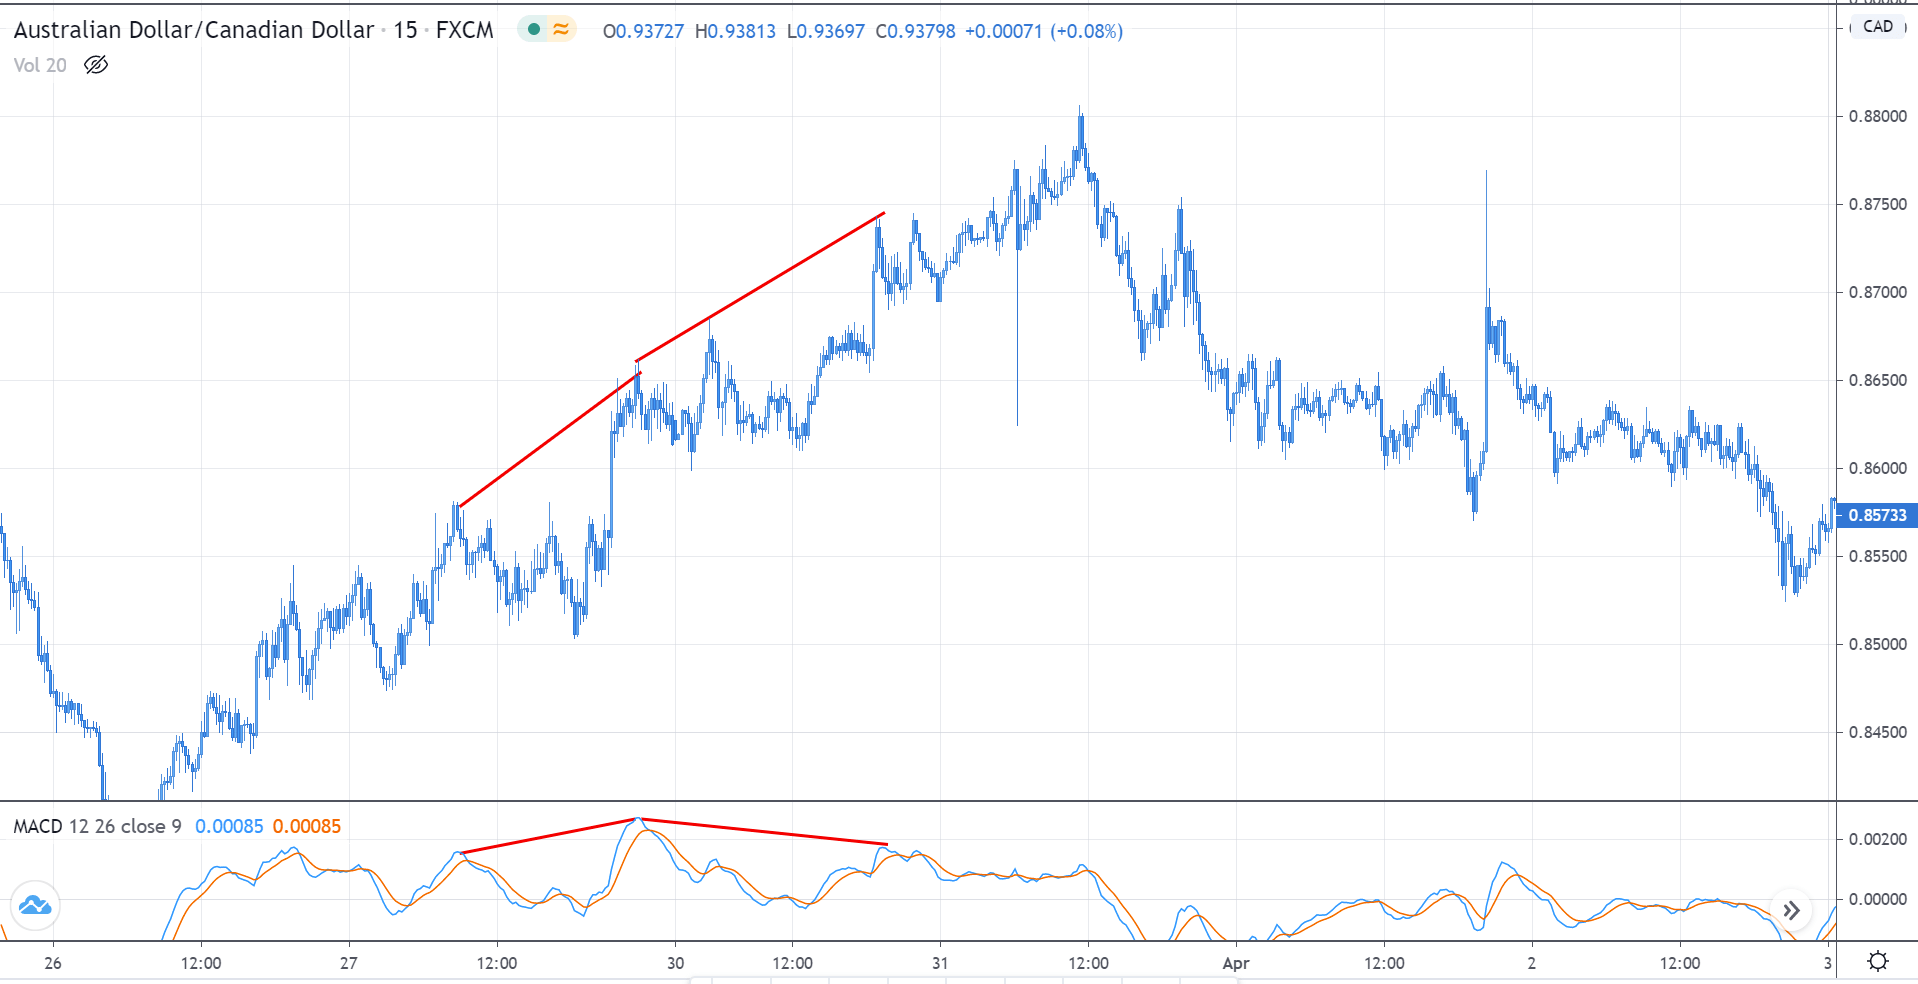
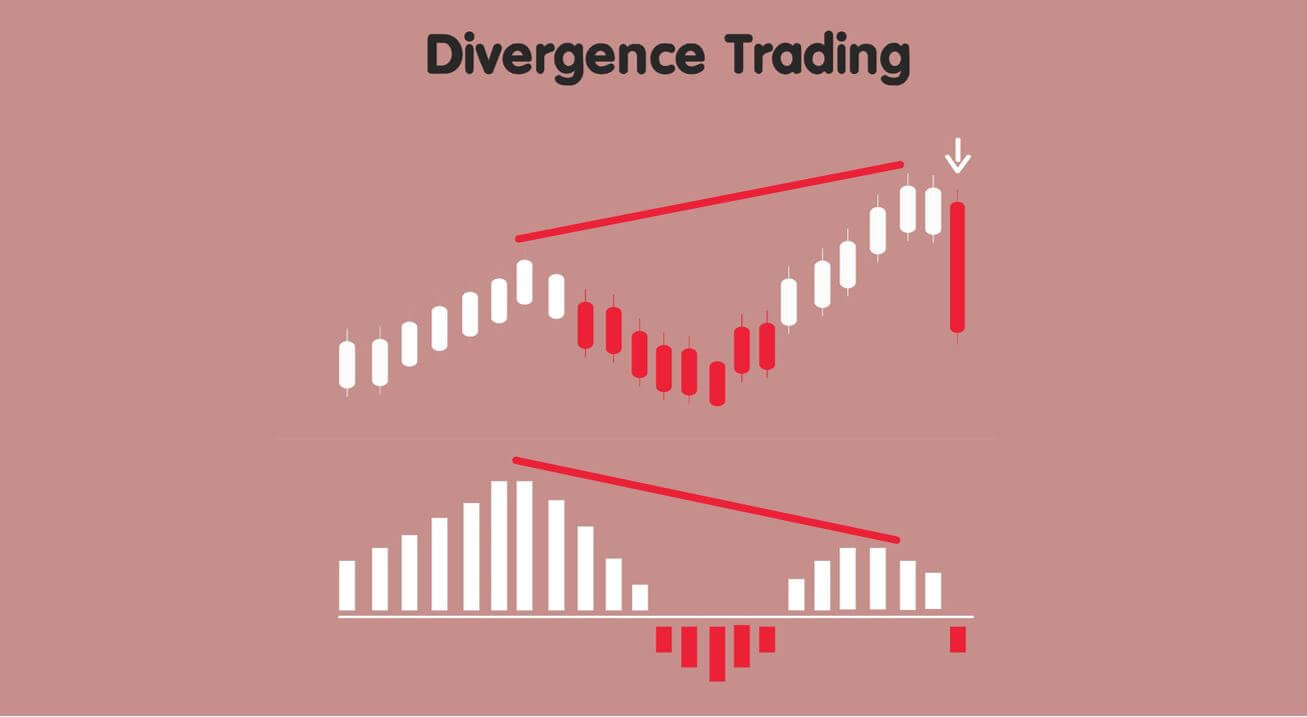
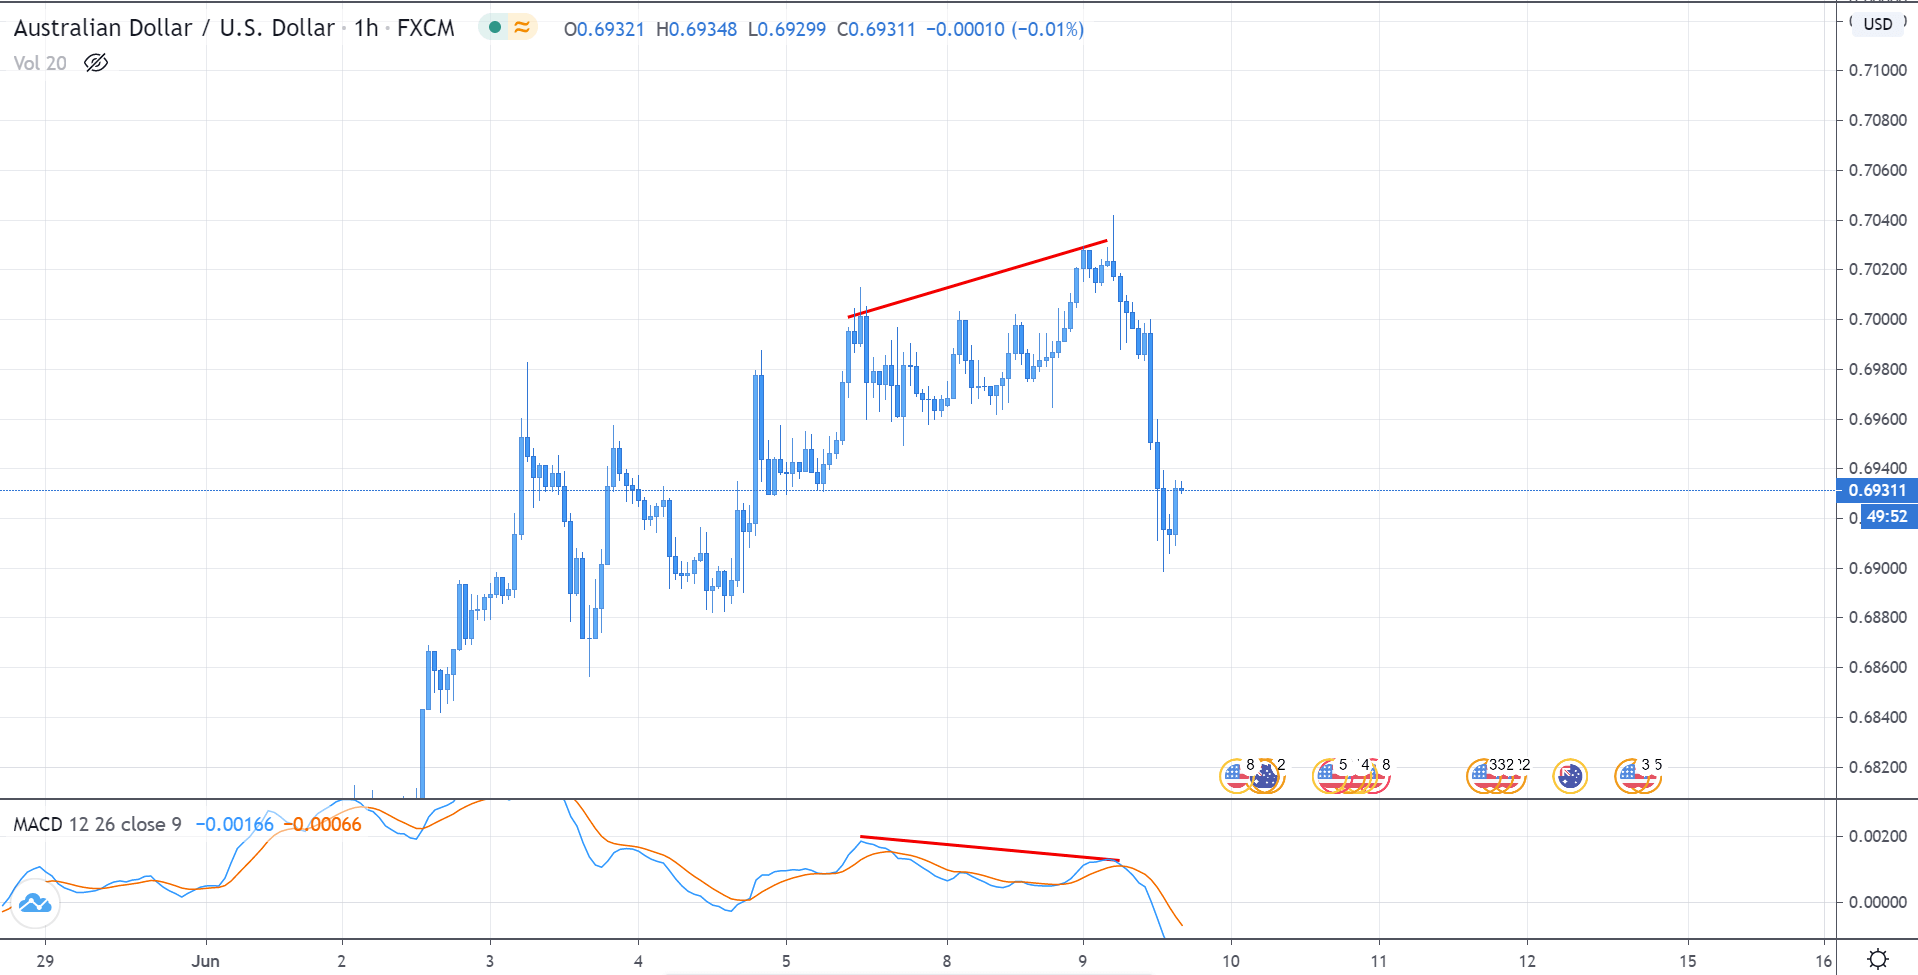
Divergence: This a concept in technical trading that determines if the market is going to reverse or continue the trend. It is identified when the price and the indicator move in opposite directions.

Based on the direction it will prevail in, there are two types of divergence:

  1. Regular Divergence
  2. Hidden Divergence

Each of them is divided into types – Bullish and Bearish, based on the direction they are biased. Here is a quick cheat sheet for trading Regular and Hidden Divergence.

Regular Divergence

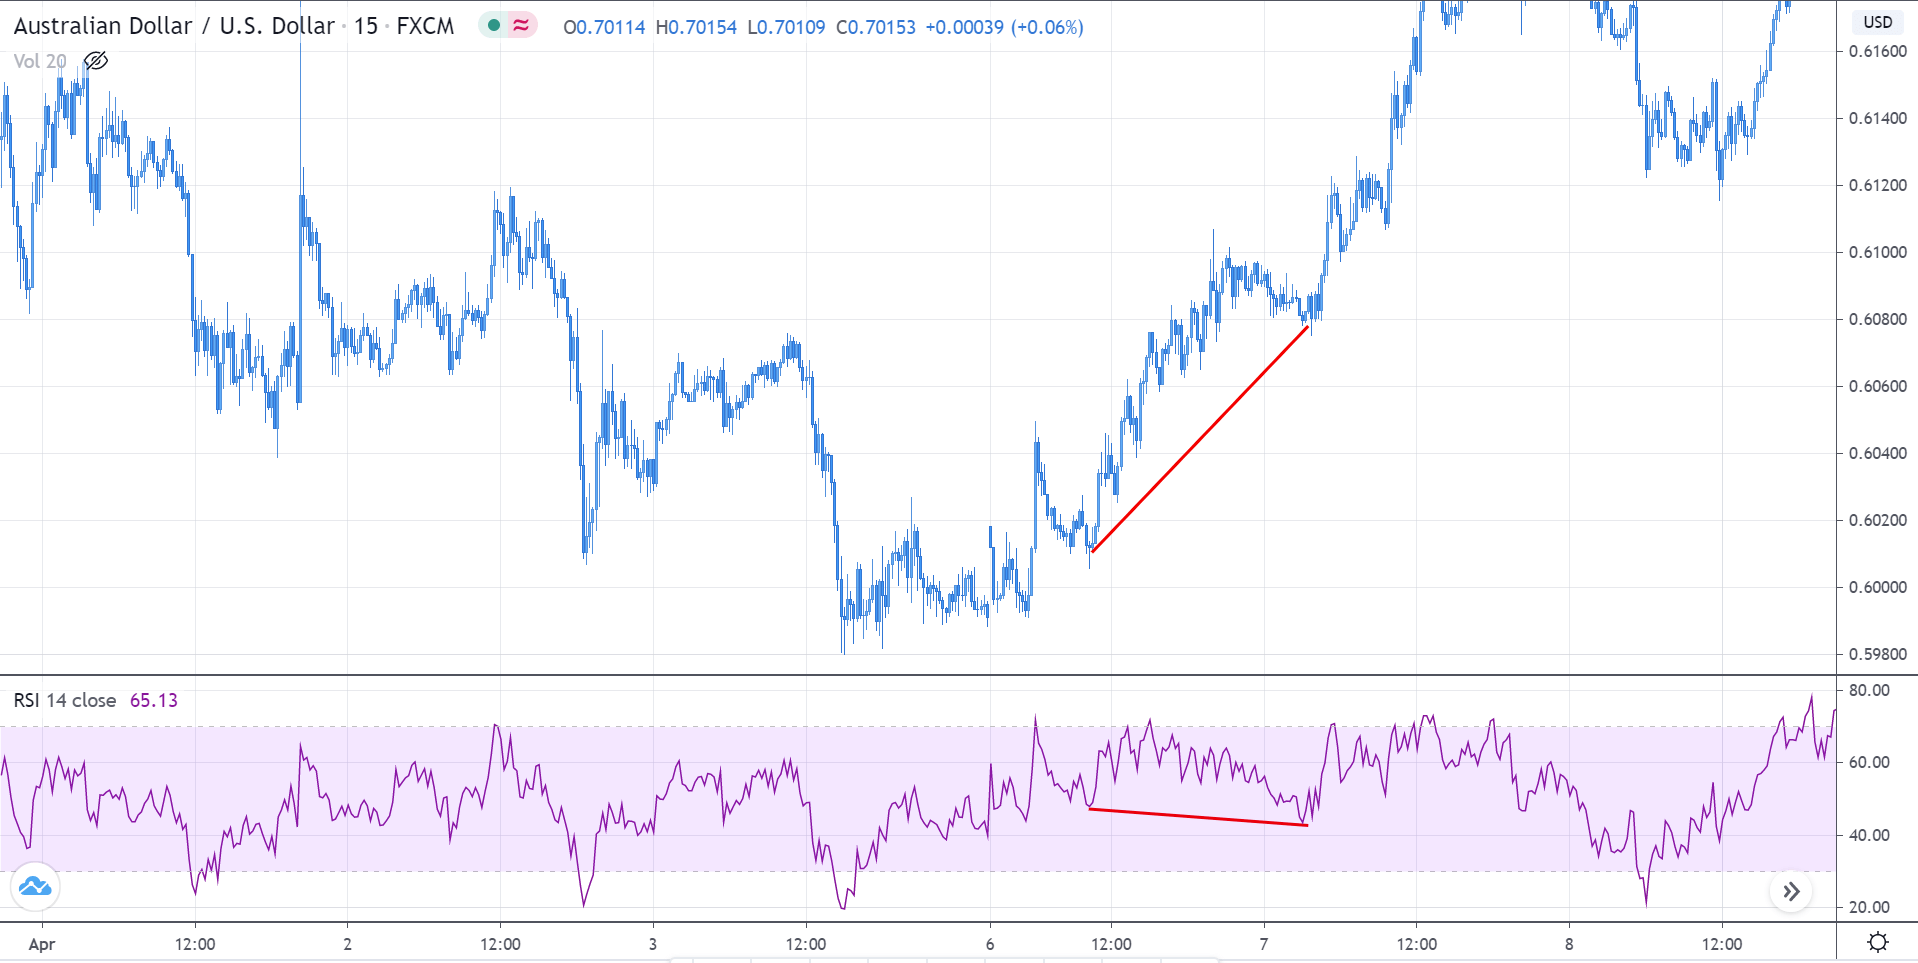
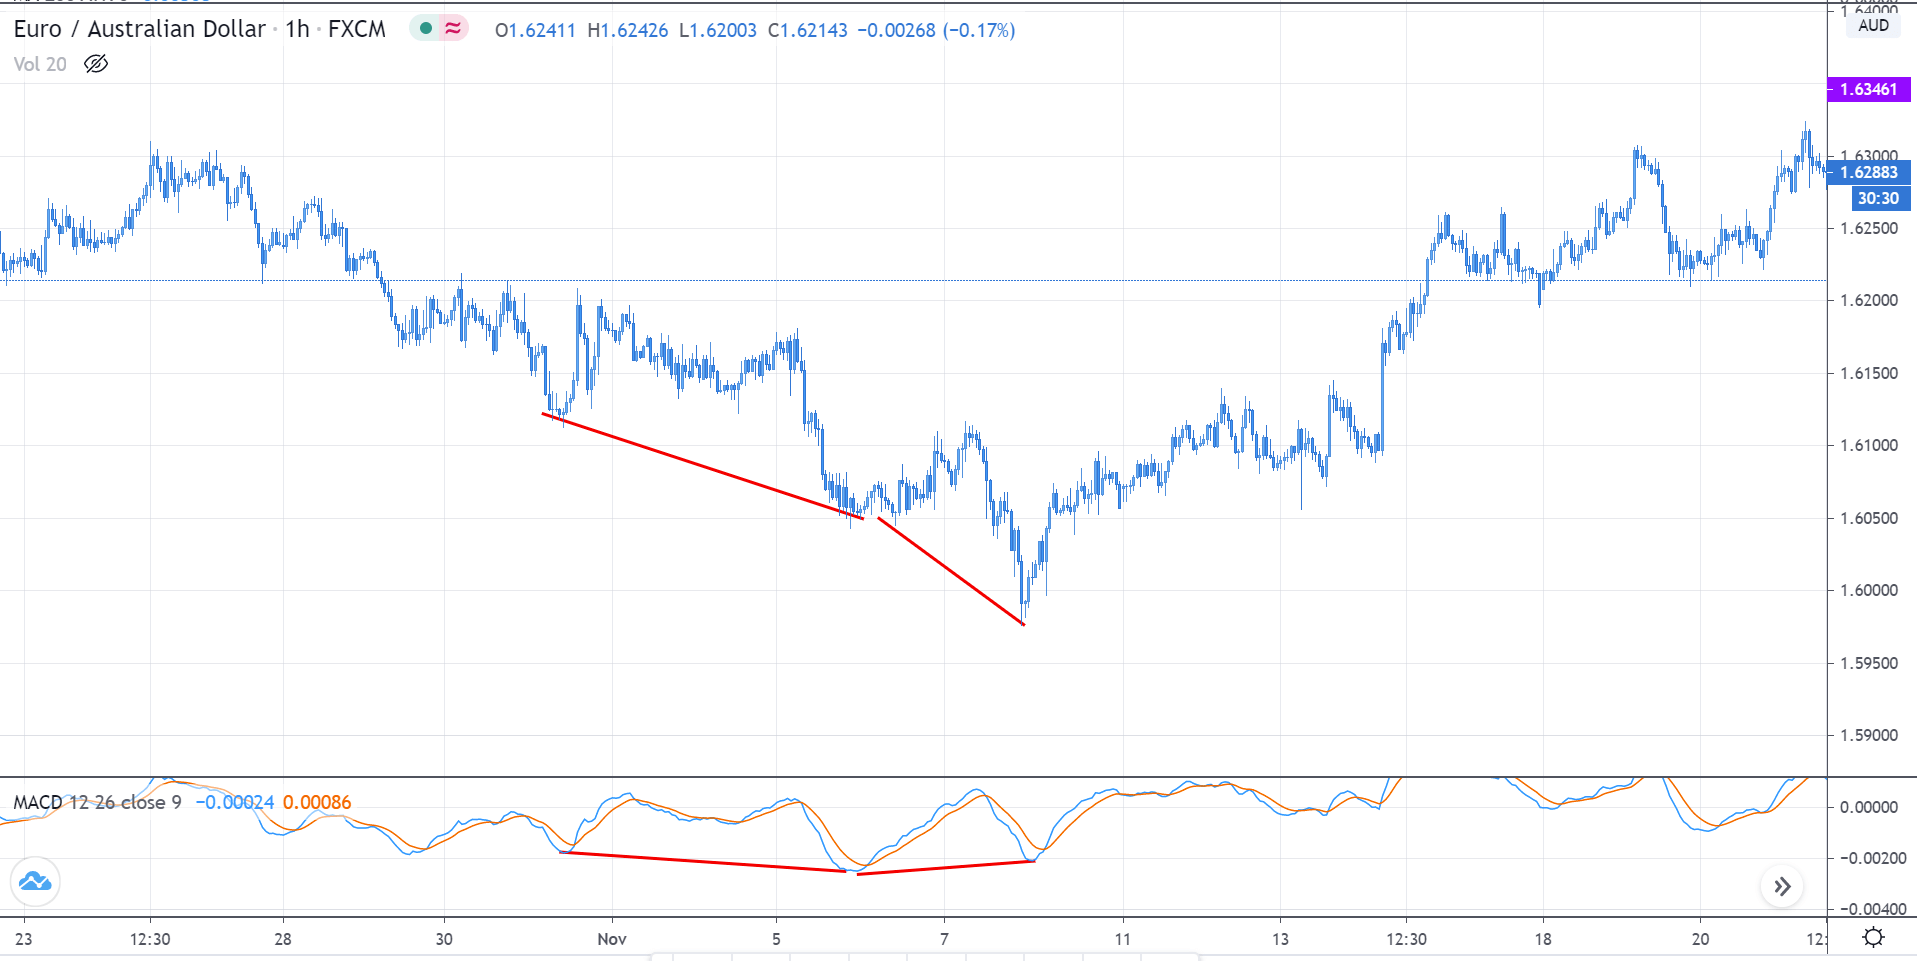
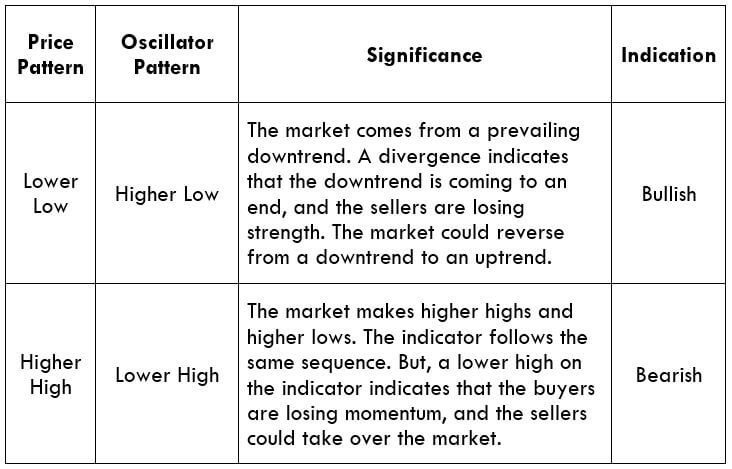
Regular divergence is divergence, which indicates a reversal in the market. These occur during the end of a trend and are quite easy to spot.
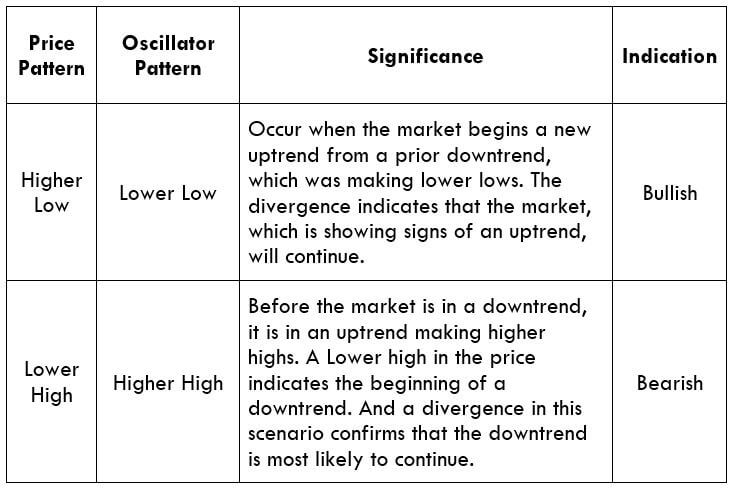
Hidden Divergence

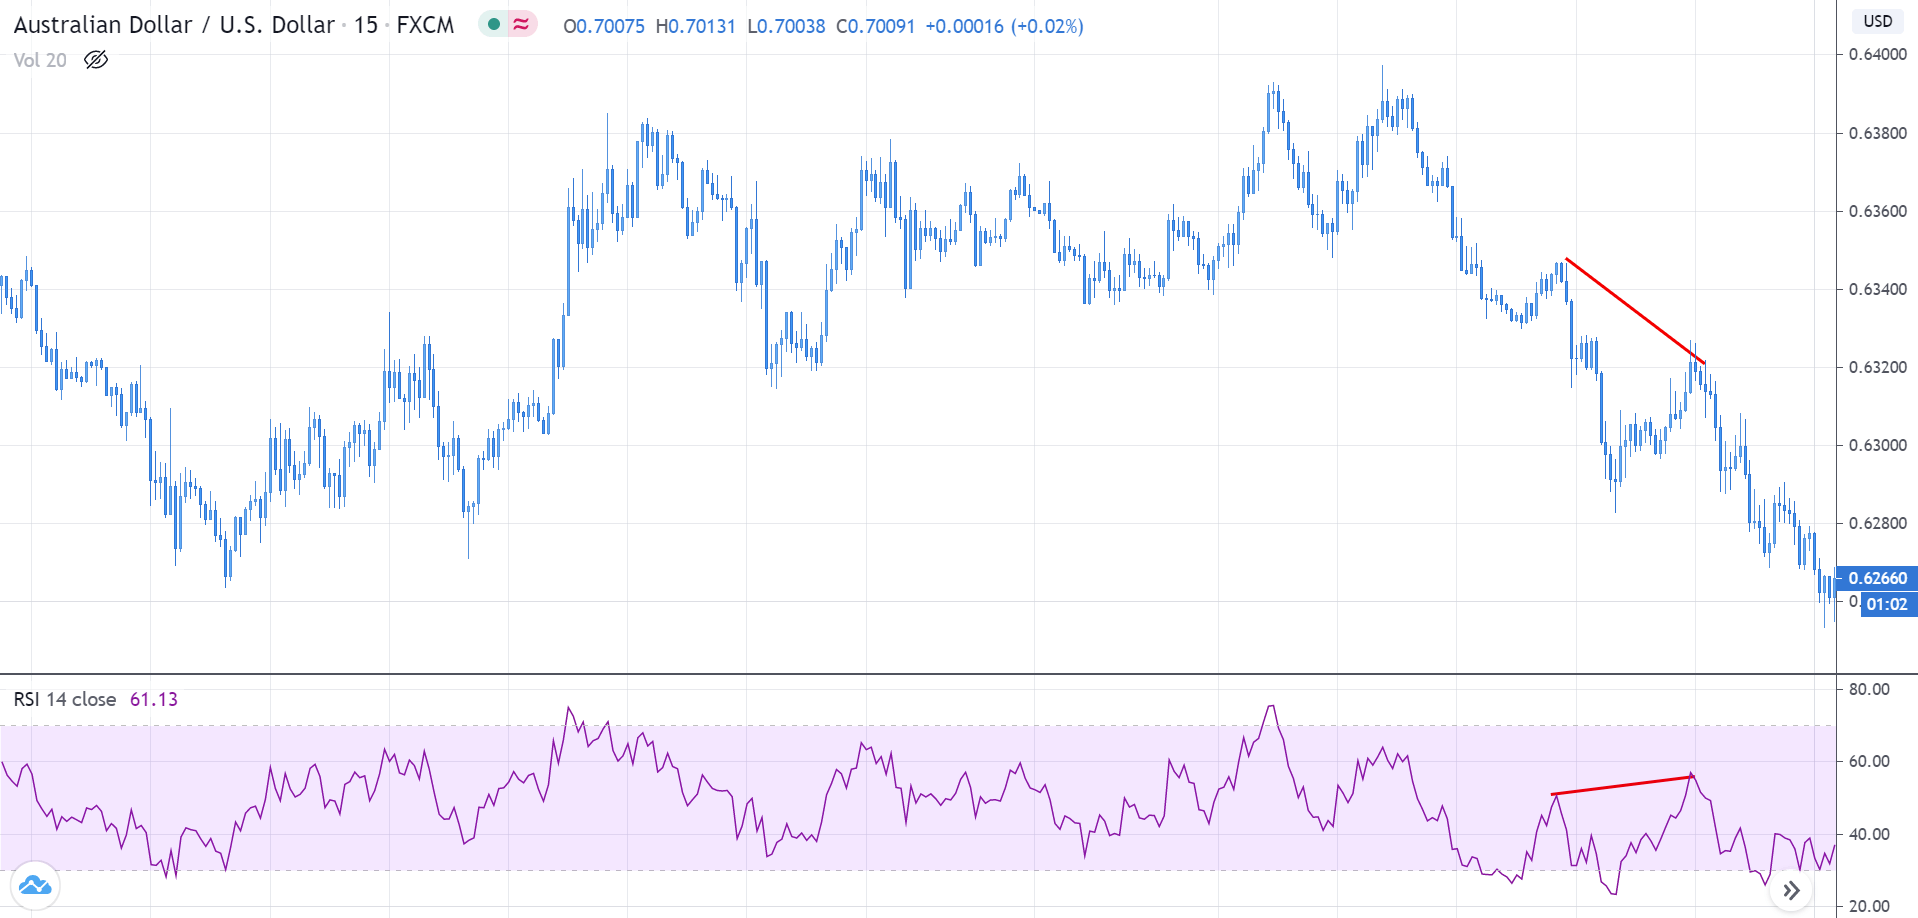
Hidden divergence indicates a possible trend continuation. These usually occur at the beginning of a new trend and are comparatively tricky to spot.

Not all indicators can be used to spot divergence. Only momentum oscillators indicate a divergence in the market. Some of the most used momentum oscillators to determine divergence include Commodity Channel Index (CCI), Relative Strength Index (RSI), Stochastic, and William %R.

Divergence is a trading concept that works exceptionally well in some cases but fails to give the right indication sometimes. Thus, traders must follow every rule that is discussed in the previous article. We hope you found this course of Divergence trading informative and useful. Happy trading!

Categories
Forex Course

129. Learning The Concept Of Hidden Divergence

Introduction

In the previous lesson, we discussed regular divergence and its types. In this lesson, we shall continue with the second type of divergence – hidden divergence. The concept of divergence in this type remains the same but differs in the indication it provides.

What is the Hidden Divergence?

In a trending market, the prices make higher highs or lower lows. In addition to that, it sets in higher lows or lower highs as well. When the market prepares to reverse, the lower low or higher high turns to equal high or equal low.  The higher lows or lower highs become the other way round. And in the new leg of the trend, if there is divergence, it is referred to as hidden divergence.

In simple terms, hidden divergence is used to indicate trend continuation in the middle of a trend or typically at the beginning of a new trend.

Types of Hidden Divergence

There are two types of Hidden divergence based on the direction it indicates:

  • Hidden Bullish Divergence
  • Hidden Bearish Divergence

Let’s understand how each of them is formed with examples as well.

Hidden Bullish Divergence

In a downtrend, the market makes lower lows and lower highs. In preparation for a reversal, it leaves a higher low instead of a lower low. Also, there could be a higher high or equal high. In this price action, if there is a lower low in the oscillator, it indicates a hidden bullish divergence. It signals that the price could continue to go north.

In the above chart of AUD/USD, we can see that the market is coming from a downtrend. Later, the market does not hold at S&R to make a new lower low but makes a higher low. Looking at the indicator, it leaves a lower low. Hence, showing divergence and indicating that the market has turned into an uptrend and will possibly continue its move up.

Hidden Bearish Divergence

In the market goes into a transition from an uptrend to a downtrend, the price which was making higher highs now starts to make lower highs. In addition, the oscillator puts in a higher high for the lower high in the price chart. Thus, showing a hidden bearish divergence. It is an indication that the market is going to continue in a downtrend.

In the above chart of AUD/USD, the market was initially coming from an uptrend making higher highs. Later, it turned directions and made a higher low instead of a higher high. But the RSI made a higher high for the same move. Thus, indicating divergence and most probable continuation of the downtrend.

[wp_quiz id=”77847″]
Categories
Forex Course

128. Interpreting Regular Divergence

What is Regular Divergence?

Markets move in trend, channels, and ranges. For any market to undergo a change in the direction, it must happen as a transition. For example, a market that has to transit from an uptrend to a downtrend, it has to go from an uptrend to a channel, to a range, and then begin the downtrend. That is, at one point in time, the market does not hold at support & resistance, and stops making higher highs. And this market reversal is indicated by the regular divergence.

Types of Regular Divergence

There are two types of regular divergence:

  • Regular Bullish Divergence
  • Regular Bearish Divergence

Let’s understand each of them with the help of live charts

Regular Bullish Divergence

This type of divergence is used to give a bullish signal in the market. When the market is in a downtrend, making lower lows and lower highs, the oscillator follows the same path. At one point, the price chat makes a lower low, but the oscillator makes a lower high. The oscillator does the opposite of what the price did. And this referred to as bullish divergence. Here is an example of the same.

In the above chart of EUR/AUD, reading the market from the left, we see that it was in a downtrend. As the prices were making lower lows, the indicator followed the same. But later, when it made another lower low, the MACD made a higher low, indicating divergence in the market. When it left higher low, we see that the price did not make any lower low from the S&R level. And finally, the market reversed and began to move north.

Regular Bearish Divergence

Regular bearish divergence is used to forecast bearishness in the market. In an uptrend, the market makes higher highs and higher lows. The oscillator indicators follow the same trajectory as well. But, if the price makes a higher high and oscillator does the opposite (lower high), then it is referred to as a bearish divergence. It is an indication that something is not right with the uptrend, and there are possibilities of a trend reversal.

In the above chart of AUD/CAD, we see that the market made a higher high, and the MACD indicator made a higher high as well, indicating that the uptrend is still intact. But the second time when the market made a higher high, the indicator put a lower high—indicating that there is something wrong with the uptrend and could be a possible reversal. In hindsight, we infer that the market failed to make higher highs and then reversed.

Note that divergence provides an indication that there could be a possible reversal in the market. It does not give a signal to buy or sell. The reversal must be solely based on your strategy. Divergence is only used to confirm the strategy and increase odds in your favor.

[wp_quiz id=”77668″]
Categories
Forex Course

127. Getting started with ‘Divergence Trading’

Introduction

There are several types of technical traders in the forex industry. Some trade based on price action while some trade using indicators. Price action traders typically do not use any indicator, but the Divergence is an exception to it. Divergence is an indicator concept that can yield immense risk to reward if used correctly. It is a powerful tool that helps traders catch the absolute peak and trough of the market.

What is Divergence?

Generally, the meaning of Divergence is to move apart. And the meaning of trading is no different. In forex, Divergence is a scenario when the price charts do not agree with the movement of the indicator. In a sense, if the price moves in one direction, the indicator moves in the other direction.

Formation of Divergence

Divergence can be found by comparing the price action on the charts with an oscillator indicator. Typically, Divergence is formed in trending markets. That is, they occur in markets that move making higher highs and or lower lows.

Consider a market a market making higher highs and higher lows. The job of an oscillator indicator is to follow the price action. Thus, the indicator should also follow an upward trajectory. But, if the charts make higher highs and the indicator makes an equal or higher low, then we conclude that there is a divergence in the market.

Significance of Divergence

Divergence is used to signify that there is something not right in the market and the uptrend. In an uptrend, for instance, the market breaks above the recent resistance (high), makes a new high, retraces to the Support & Resistance level, and continues the same cycle. But when the market makes a higher high with Divergence, there is a high possibility that the market might not hold at the S&R level. The market could reverse or might drop slightly below the S&R and then continue the uptrend.

Indicators used to Identify Divergence

Divergences can be identified using oscillator indicators. An oscillator, going by the name, moves between two levels – overbought and oversold. Typically, a level above 70-80 is considered overbought, and a level below 20-30 indicates an oversold market.

Following are the most commonly used indicators to identify Divergence

  1. Relative Strength Index (RSI)
  2. Stochastic Indicator
  3. Moving Average Convergence Divergence (MACD)

Types of Divergence

Based on the direction of the market, there are two types of Divergence:

Regular Divergence

This is the most used type of Divergence and very easy to spot. They are found at the top or bottom of a trend and are used to give a reversal signal. Regular Divergence can again be split into two types: Bullish Divergence | Bearish Divergence.

Hidden Divergence

Hidden divergences are relatively trickier to spot. Converse to regular Divergence, hidden Divergence is used for a trend continuation indication. They are typically found in the middle of a trend. Hidden divergences, too, can be divided into two types: Hidden Bullish divergence | Hidden Bearish Divergence.

That’s about the introduction to divergences. In the next lesson, we shall elaborate on each of the divergence types.

[wp_quiz id=”77516″]