Categories
Forex Basic Strategies

Generating Profitable Forex Signals Using The ‘Indicator-Price Action’ Combo Strategy

Introduction

Few strategies discussed previously focussed on chart patterns and indicators. Now let us a strategy that is based on two of the most powerful indicators in technical analysis. We already know how to trade using these indicators separately. But using any technical indicator in isolation will not generate a great amount of profit.

Therefore, it becomes necessary to combine at least two indicators and use them in conjunction to produce signals. In today’s article, we not only combine two indicators but also provide a price action edge to it that will make this one of the best strategies of all time. This particular strategy gives traders an insight into both volatility and momentum in the forex market.

The two indicators we will using are Bollinger Band (BB) and MACD. Using the two indicators together can assist traders in taking high probability trades as they gauge the direction and strength of the existing trend, along with volatility. Let us find out the specifications of the strategy and how we imbibe concepts of price action here.

Time Frame

The strategy is designed for trading on longer-term price charts such as the 4 hours and ‘Daily.’ This means the strategy is suitable for the swing to long-term traders.

Indicators

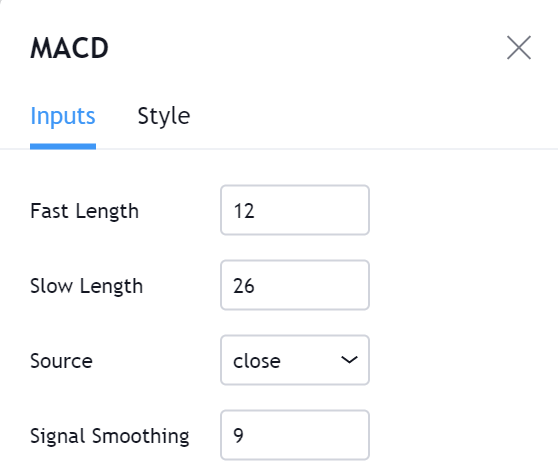
As mentioned earlier, we use Bollinger Band and MACD indicators in the strategy with their default settings.

Currency Pairs

We can apply this strategy to both major and minor currency pairs. However, pairs that are not volatile should be avoided.

Strategy Concept

In this strategy, we first identify the trend of the market and see if the price is moving in a channel or not. When looking for a ‘long’ setup, the price must move in a channel below the median line of the Bollinger band. The lesser time price spends above the median line of the Bollinger band better for the strategy.

The reason behind why we chose to have the price below the Bollinger band is to verify that the price is moving into an ‘oversold’ zone. When price moves into the zone of ‘overbought’ or ‘oversold,’ it means a reversal is nearing in the market. Similarly, in a ‘short’ setup, the price should initially move in an upward channel above the median line of the Bollinger band. This indicates that the price is approaching an ‘overbought’ area.

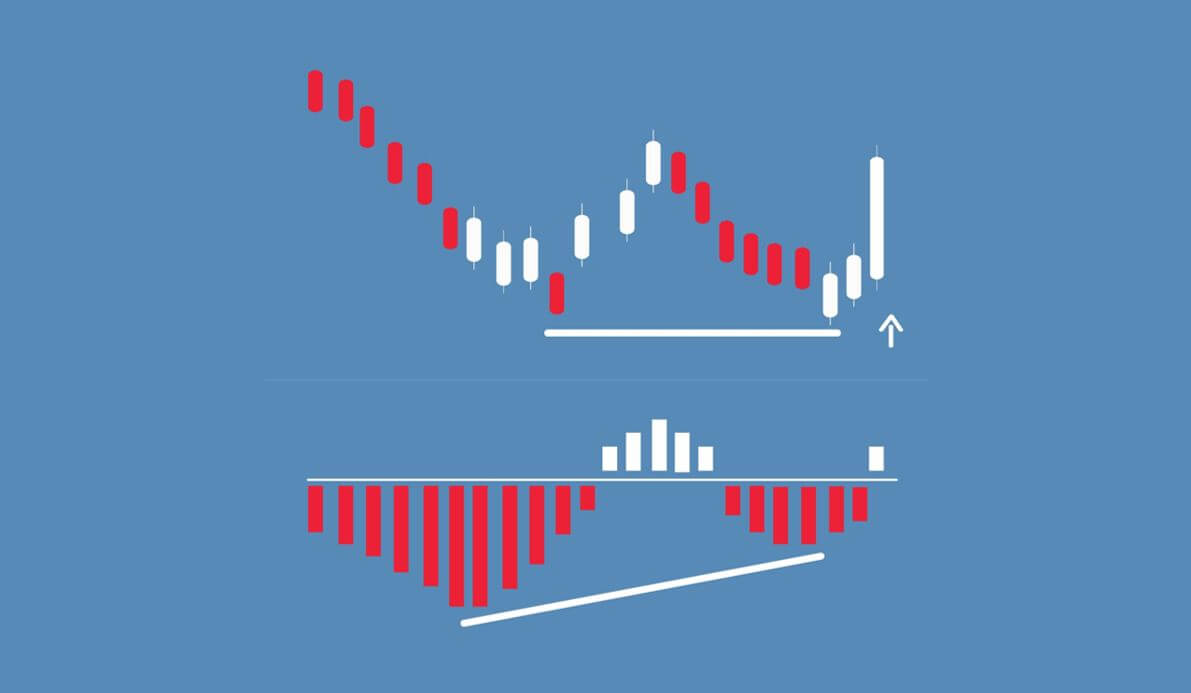
The MACD indicator shows when a true reversal is taking place in the market. The histogram tells about the momentum and strength of the reversal. Depending on the level of the bars, we ascertain the strength of the reversal. Not only is the strength of the reversal important, but also the ’highs’ and ‘lows’ it makes. Once price crosses previous highs and lows, we enter the market at an appropriate ‘test.’ Let us understand in detail about the execution of the strategy.

Trade Setup

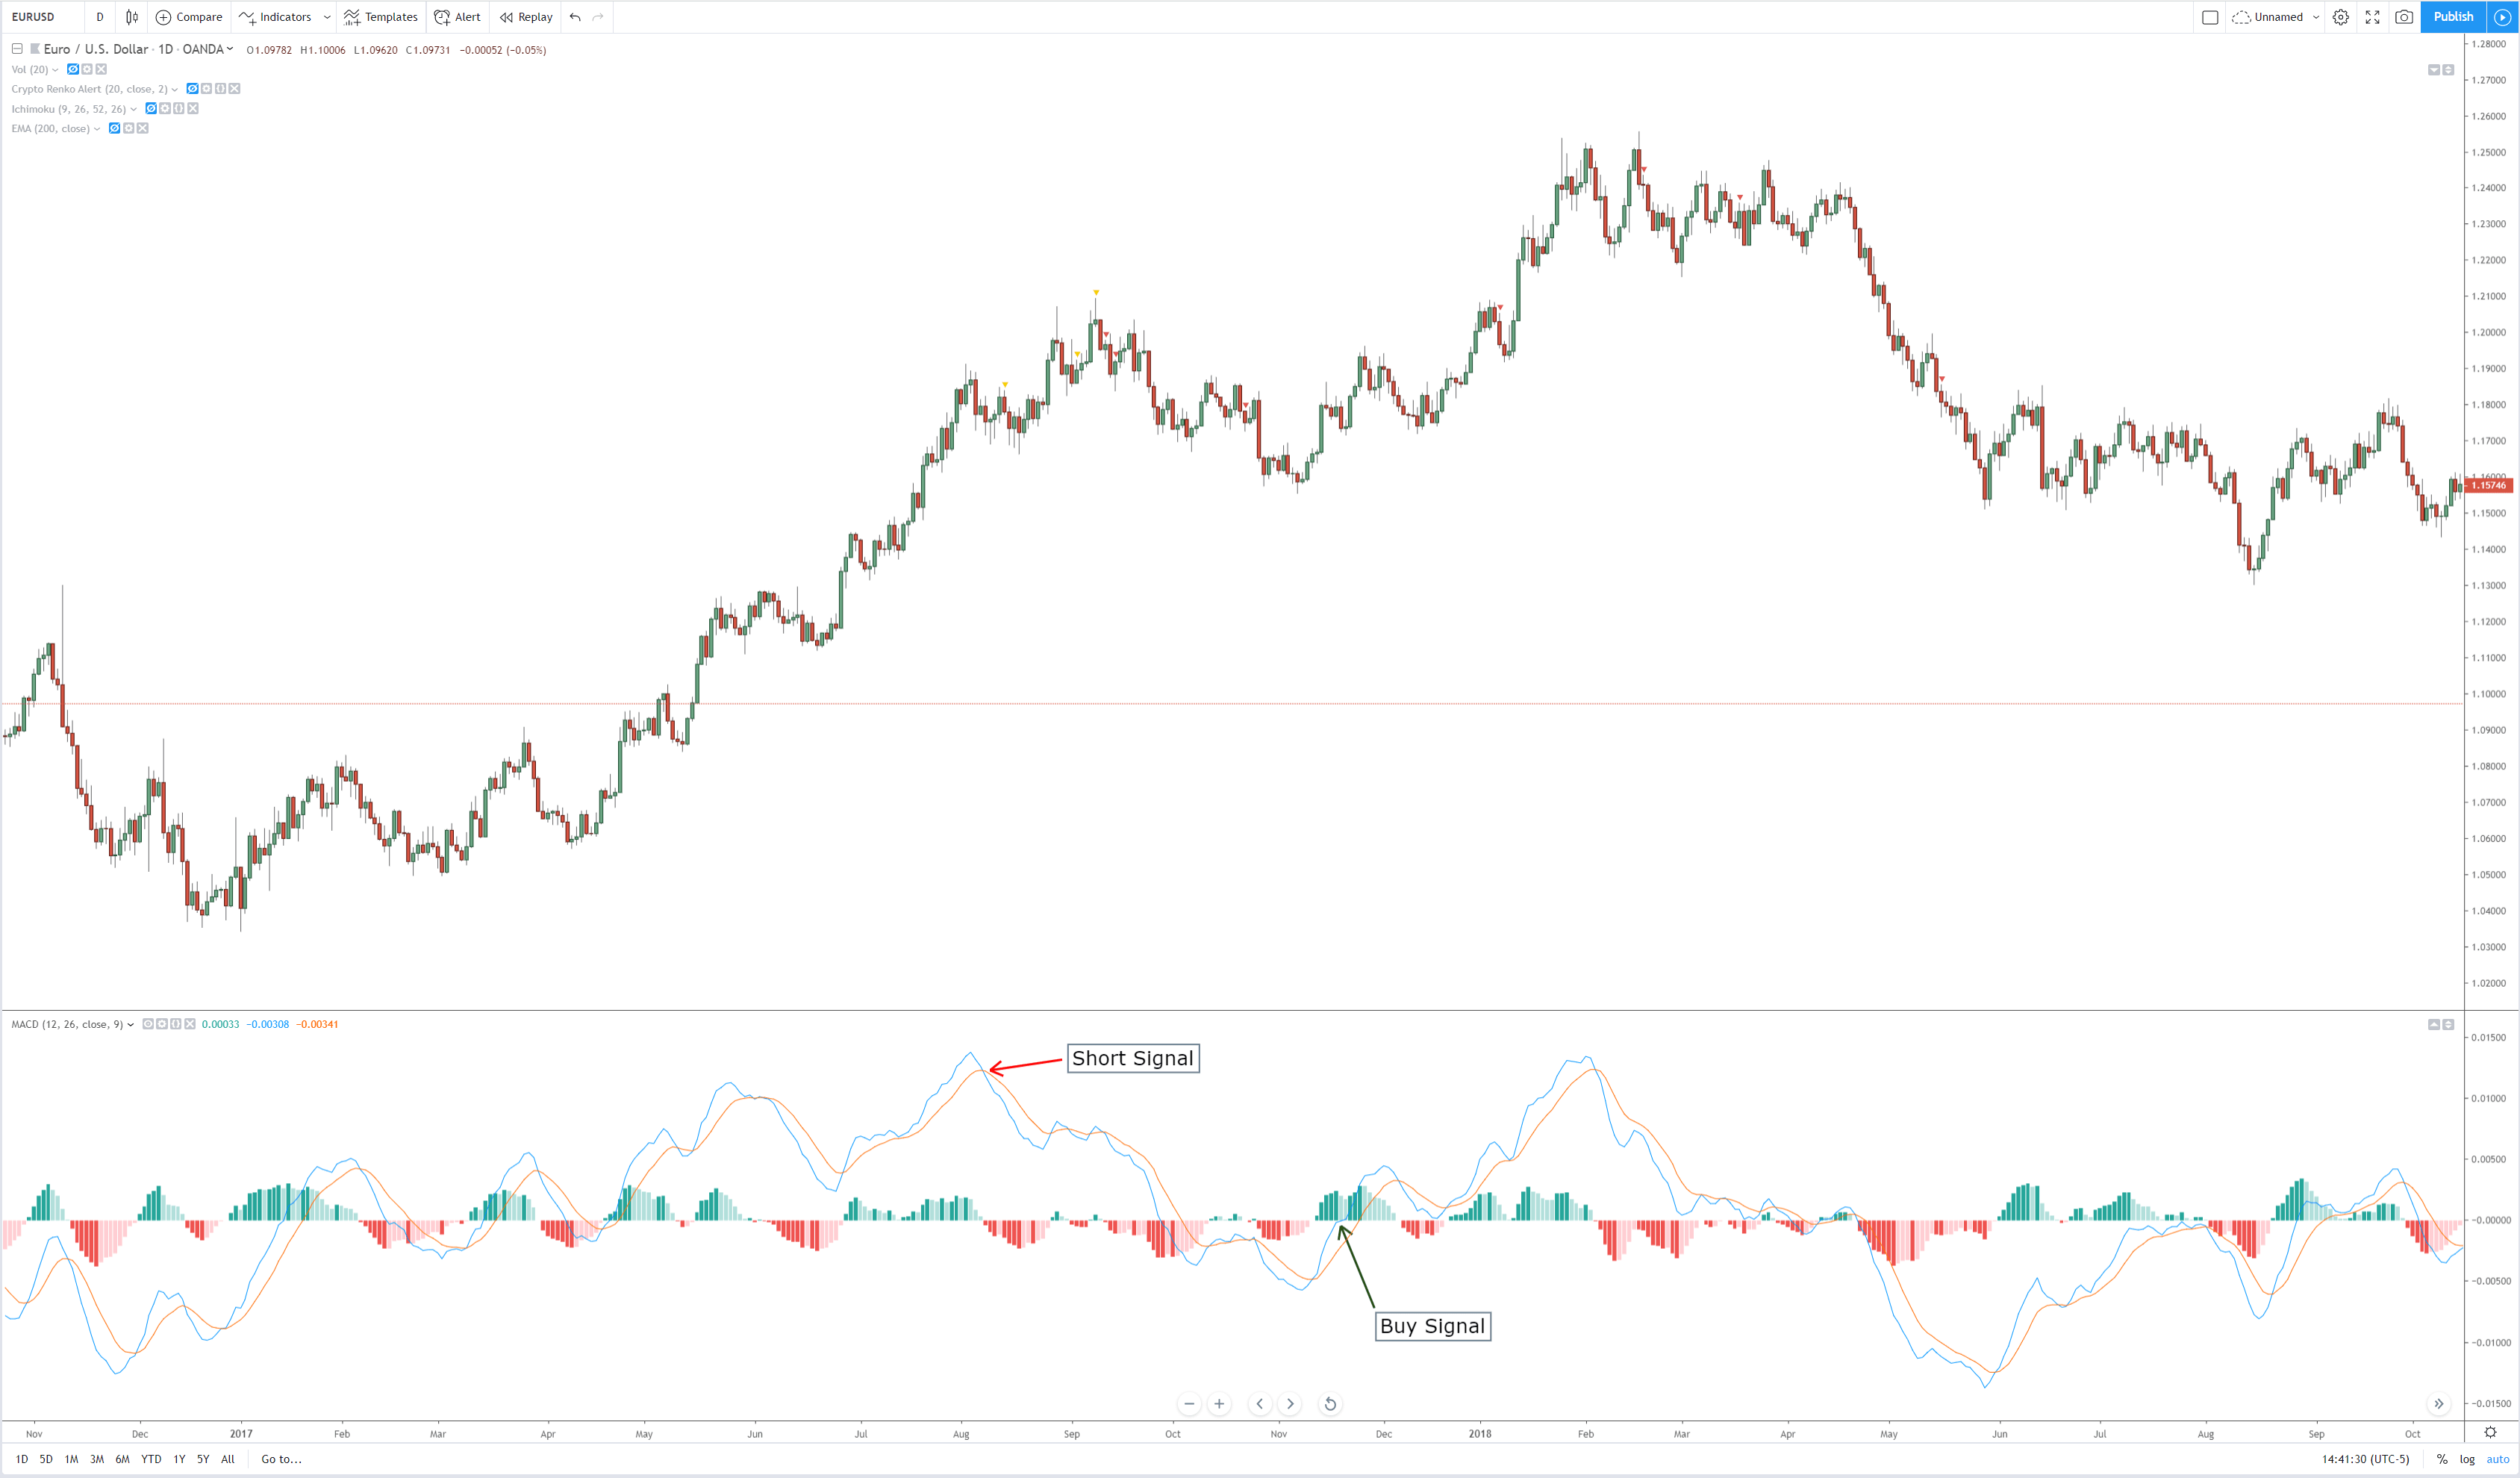
In order to execute the strategy, we have considered the 4-hour chart of the GBP/JPY pair, where we will be illustrating a ‘long’ trade. Here are steps to execute the strategy.

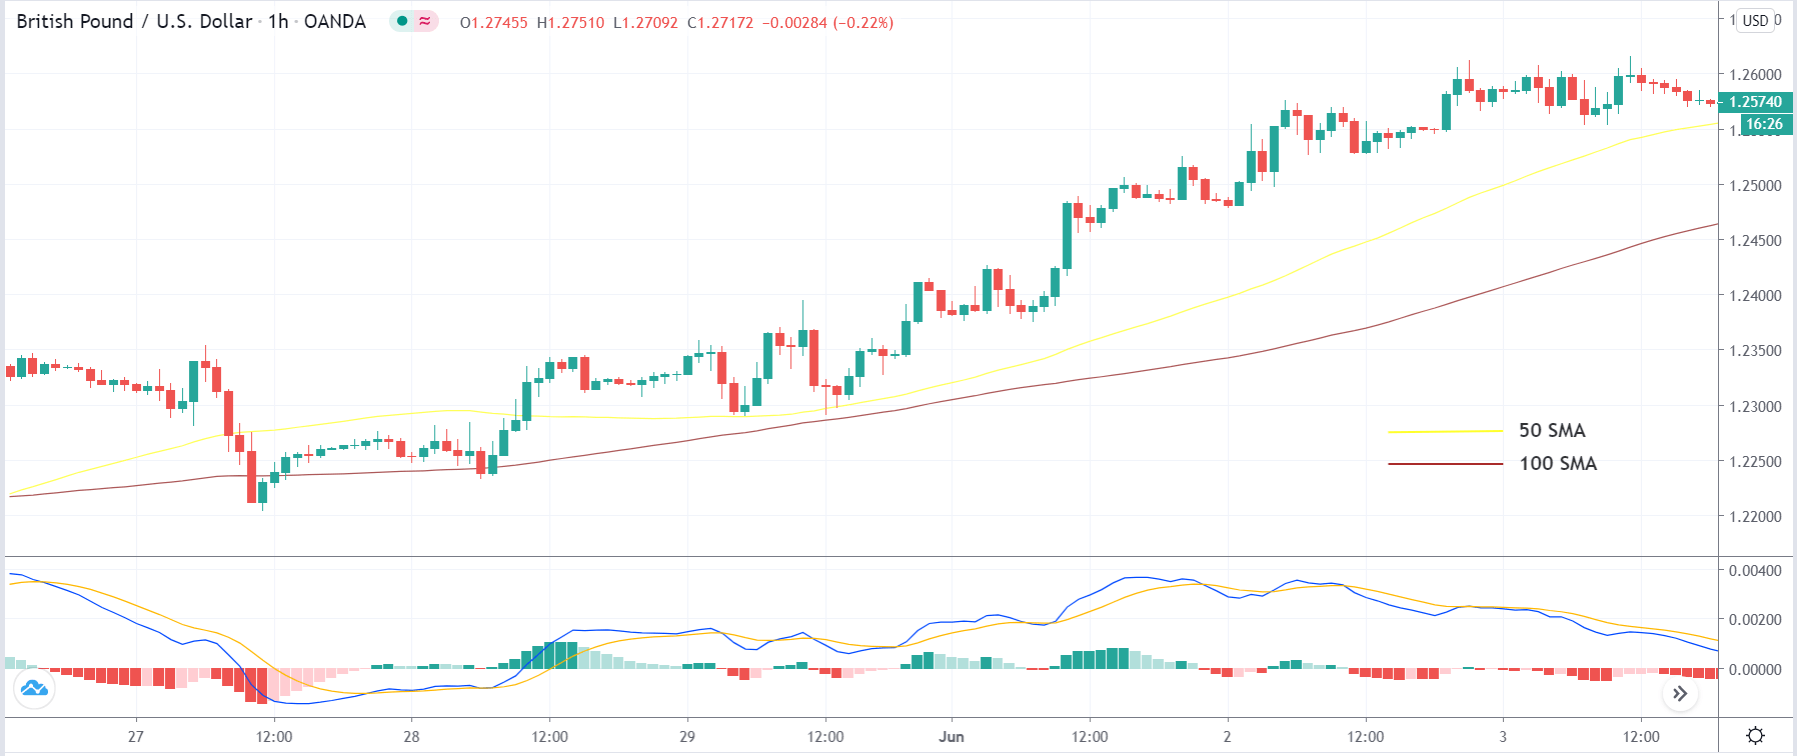
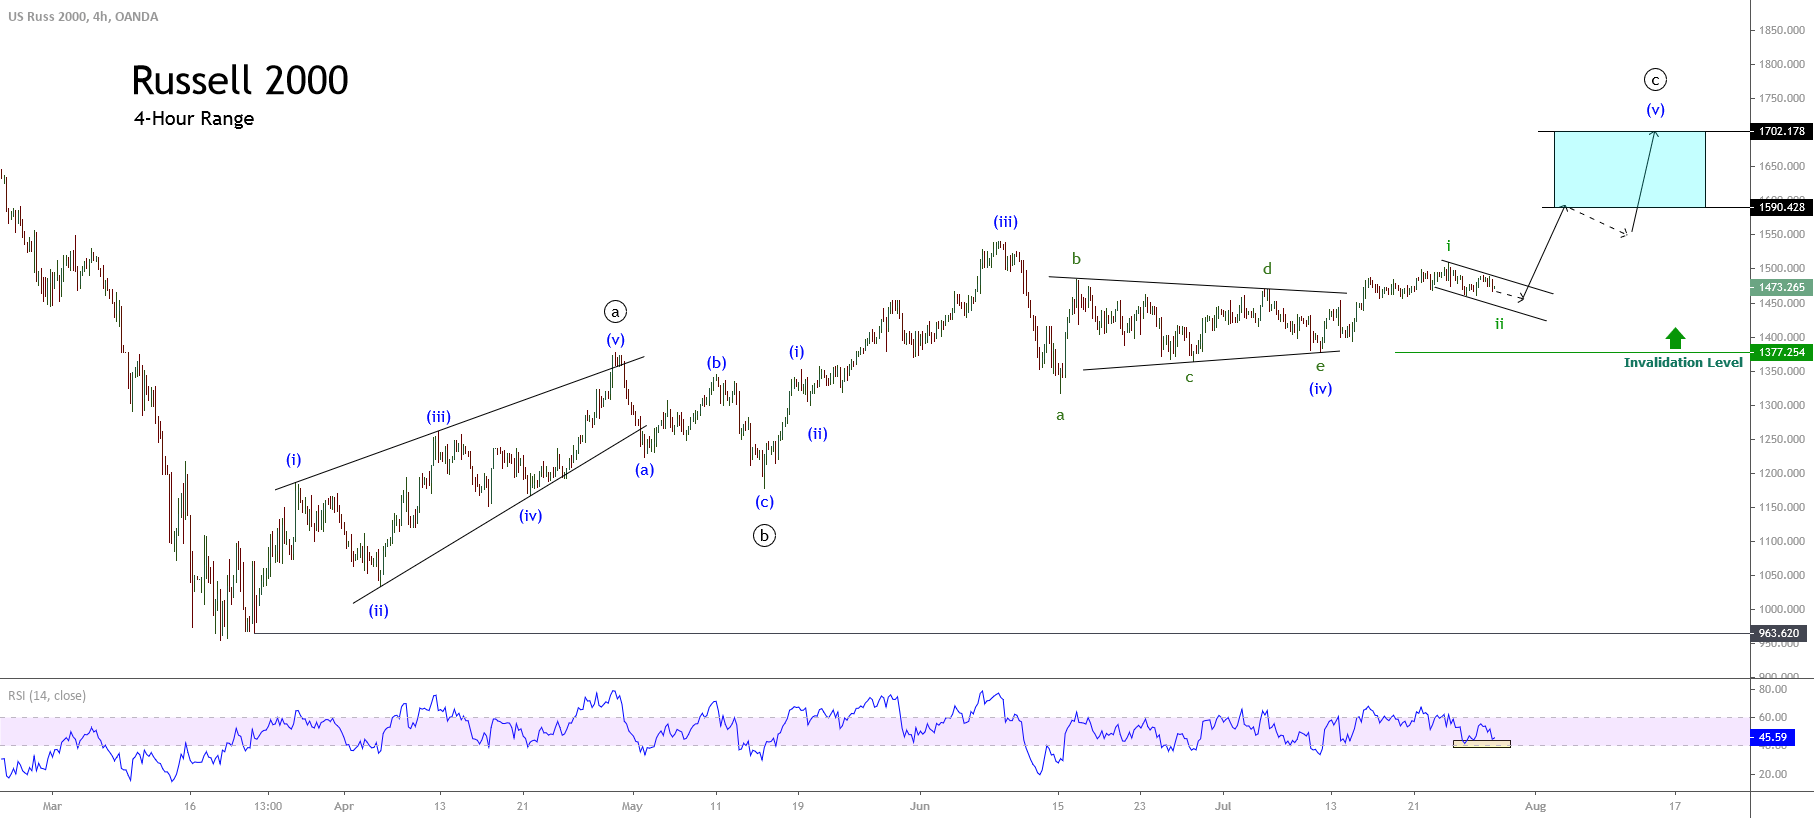
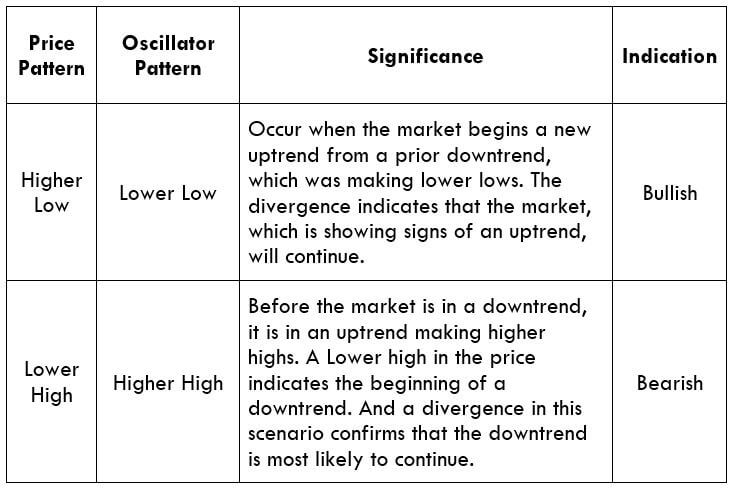
Step 1: Firstly, we have to identify the trend of the market. In a ‘long’ trade setup, we need to look for series of ‘lower lows’ and ‘lower highs’ below the median line of the Bollinger band, and in a ‘short’ trade setup, we need to look for series of ‘higher highs’ and ‘higher lows’ above the median line of Bollinger band. When this is confined in the channel, the trend becomes very clear, and reversal can easily be identified.

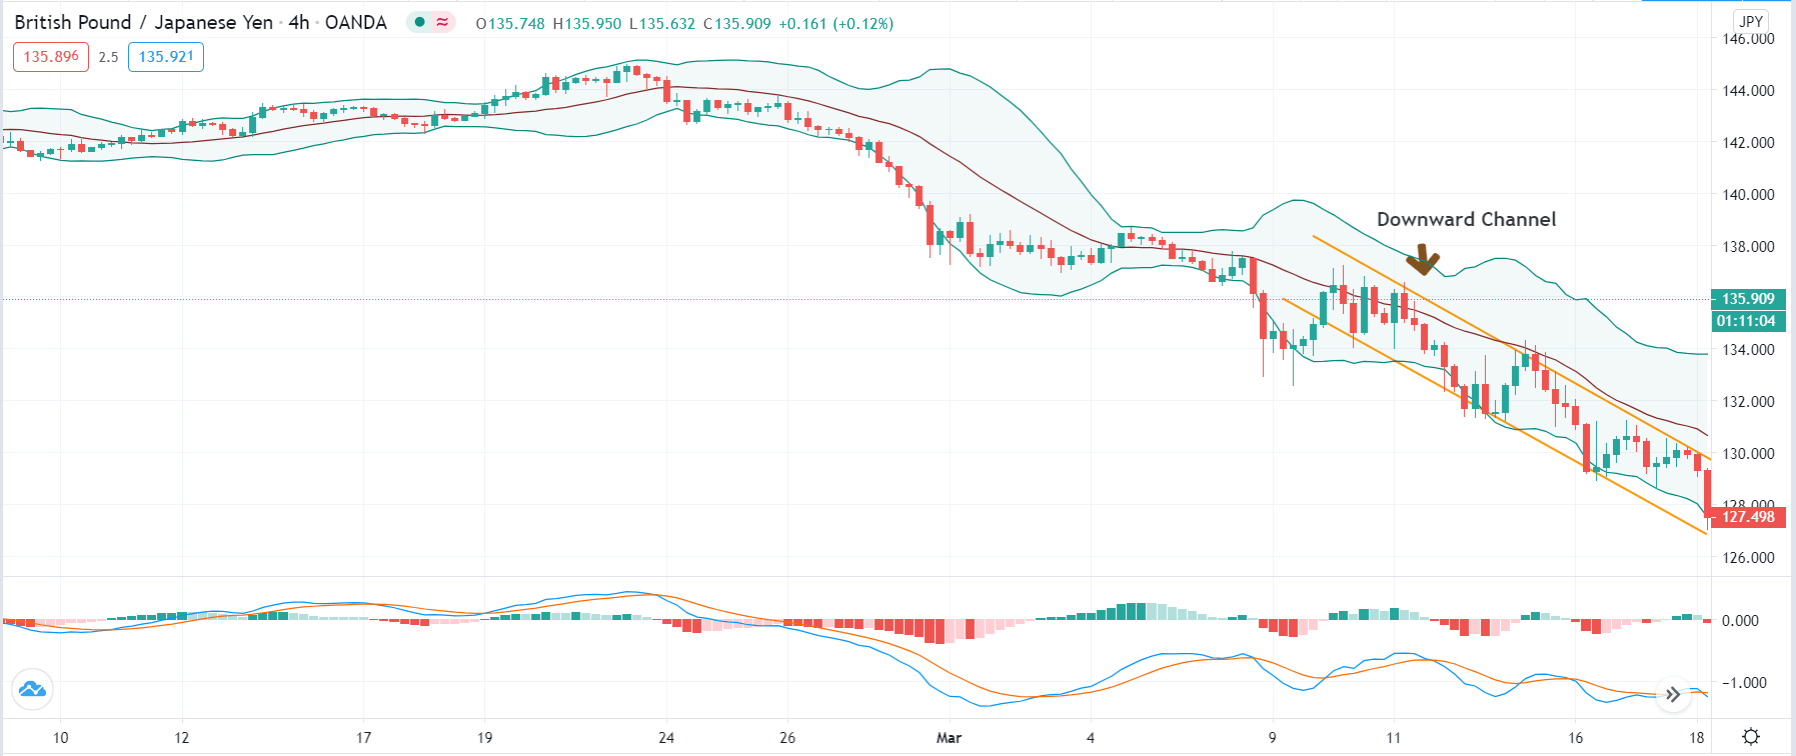
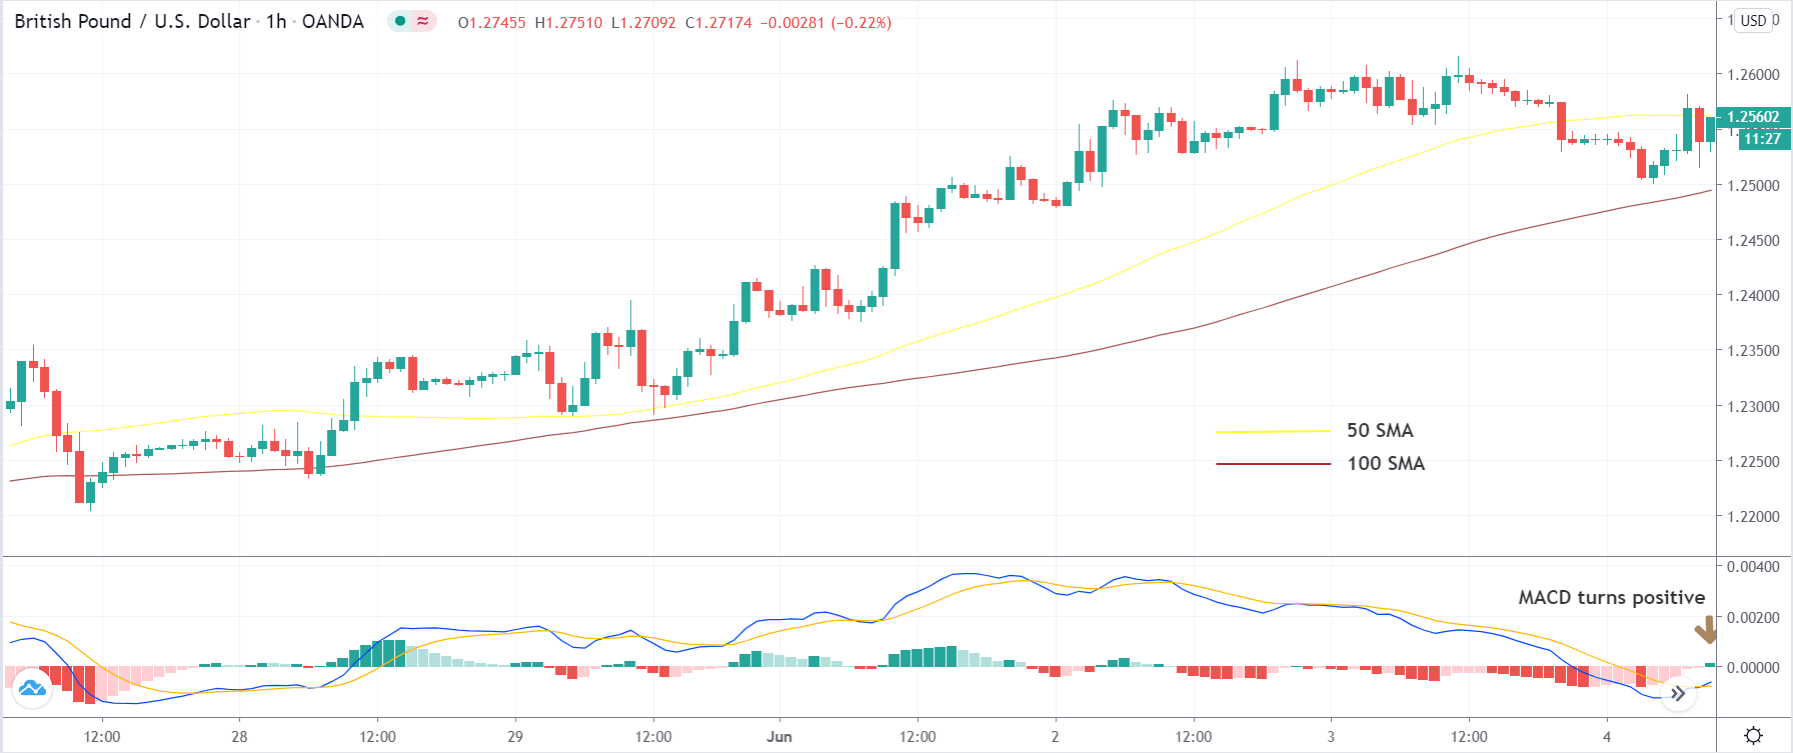
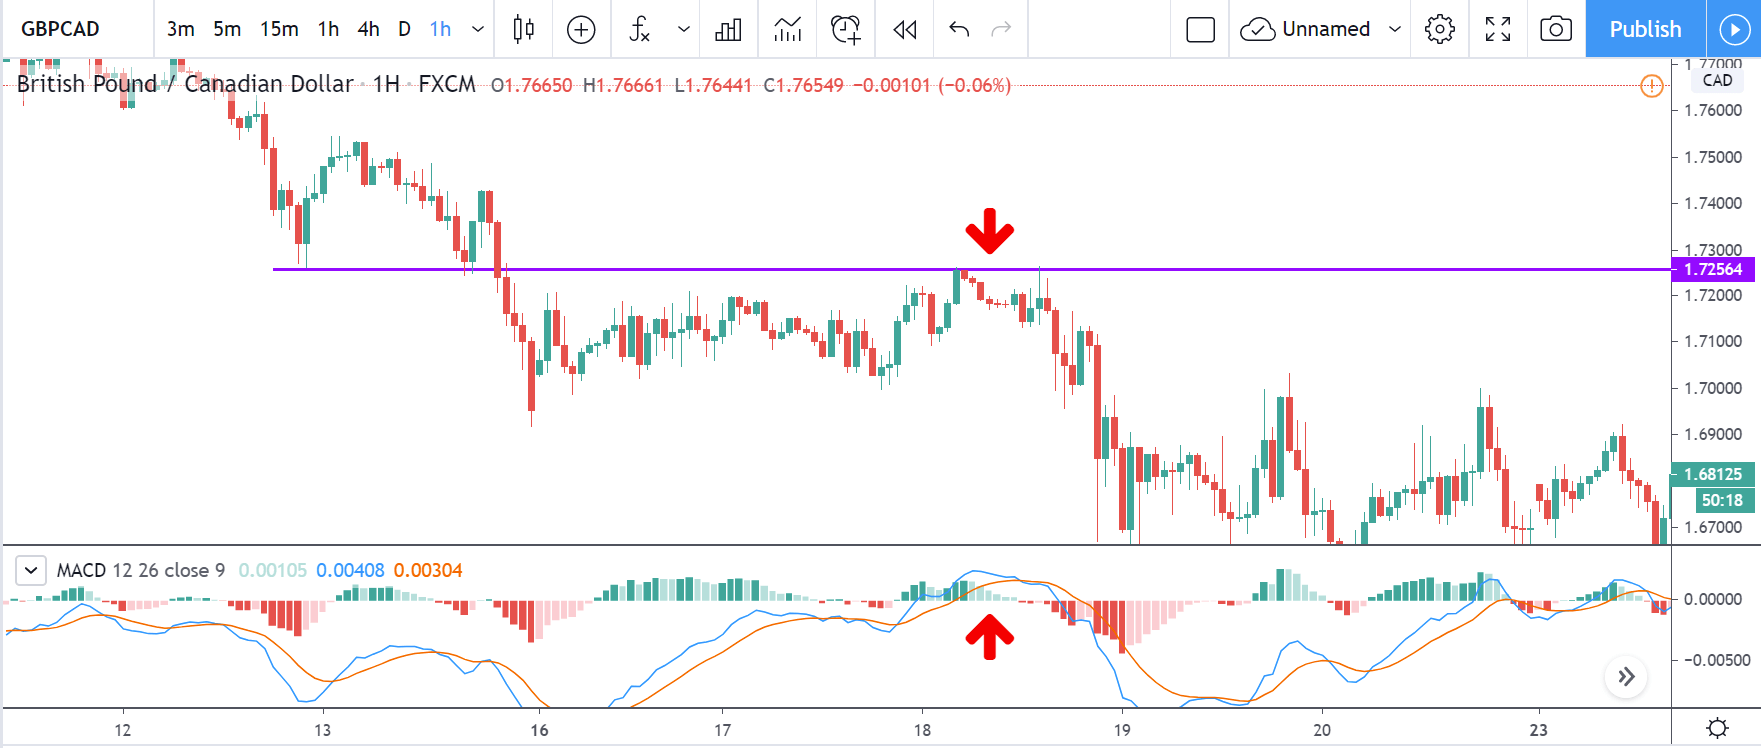
Step 2: We say that an upward reversal has taken place when we notice a bullish crossover in MACD along with a positive histogram. While in an uptrend, we say that a reversal has occurred when we notice a bearish crossover in MACD along with a negative histogram. Once reversal becomes eminent in the market, it is necessary to confirm that the reversal is ‘true,’ and thus, we could take a trade in the direction of the reversal.

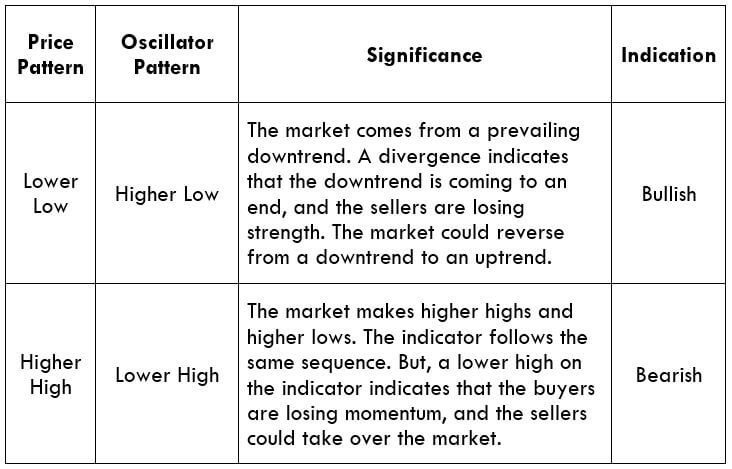
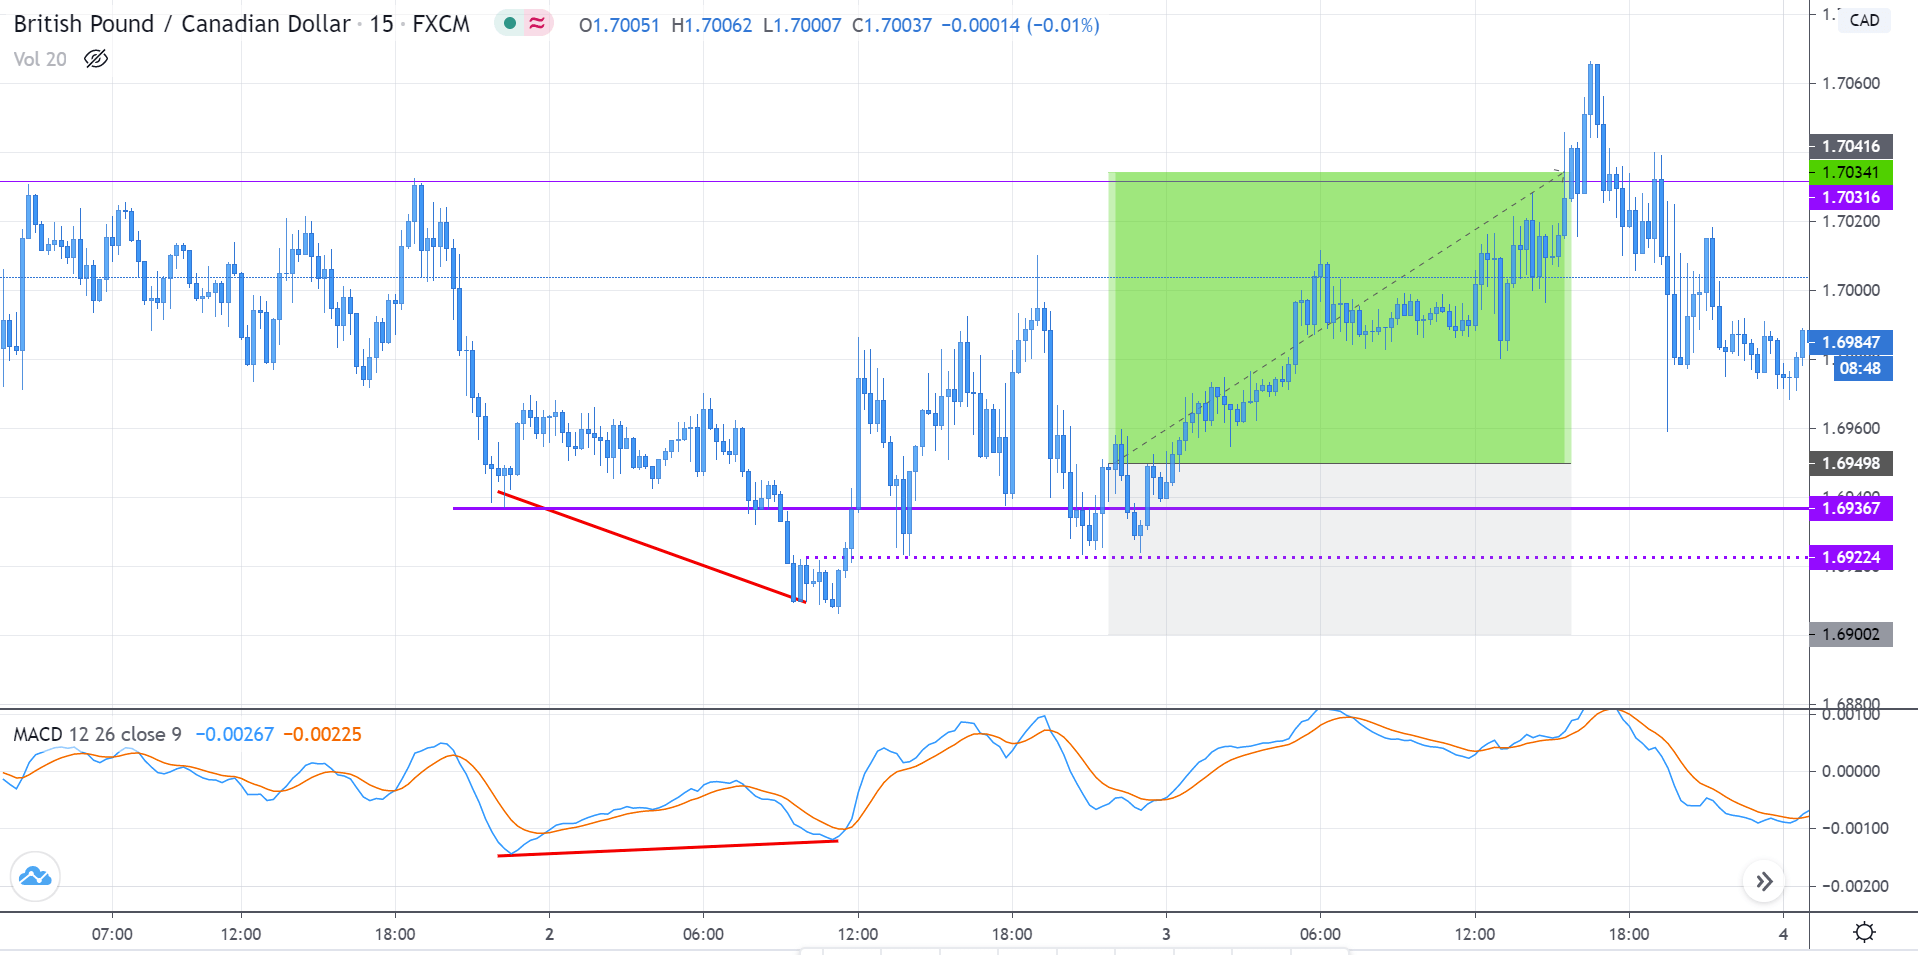
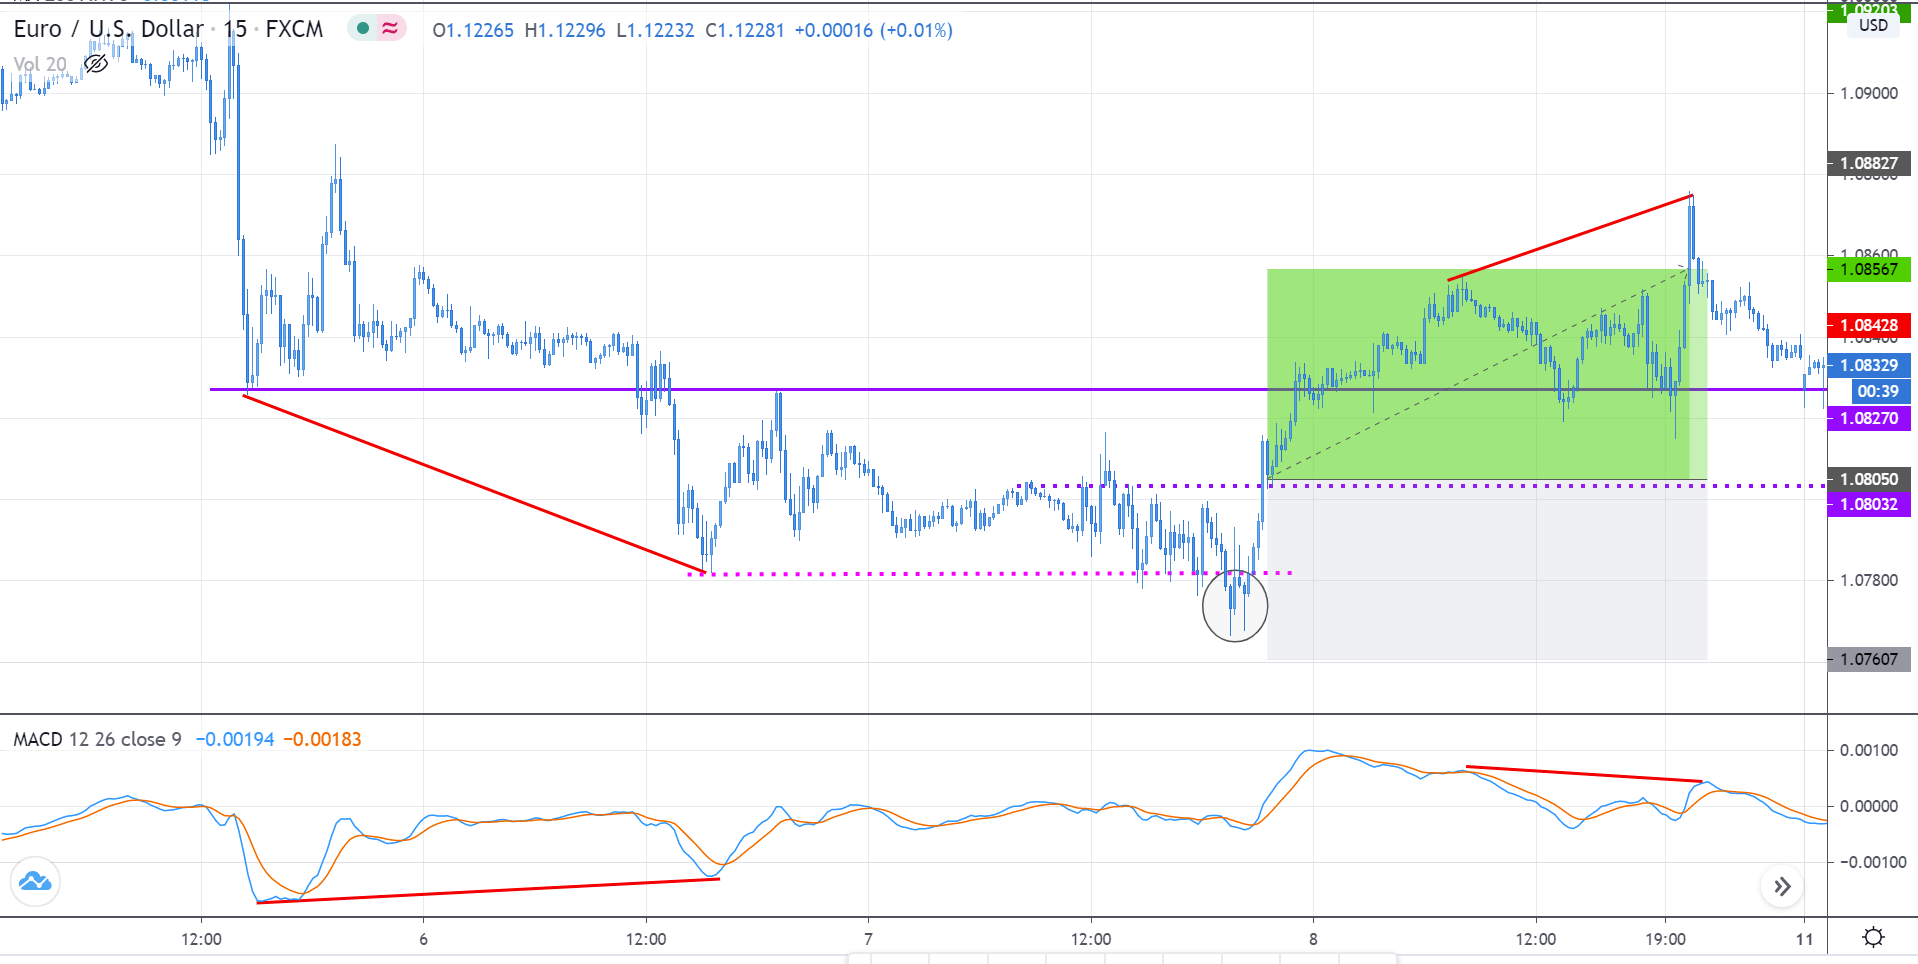
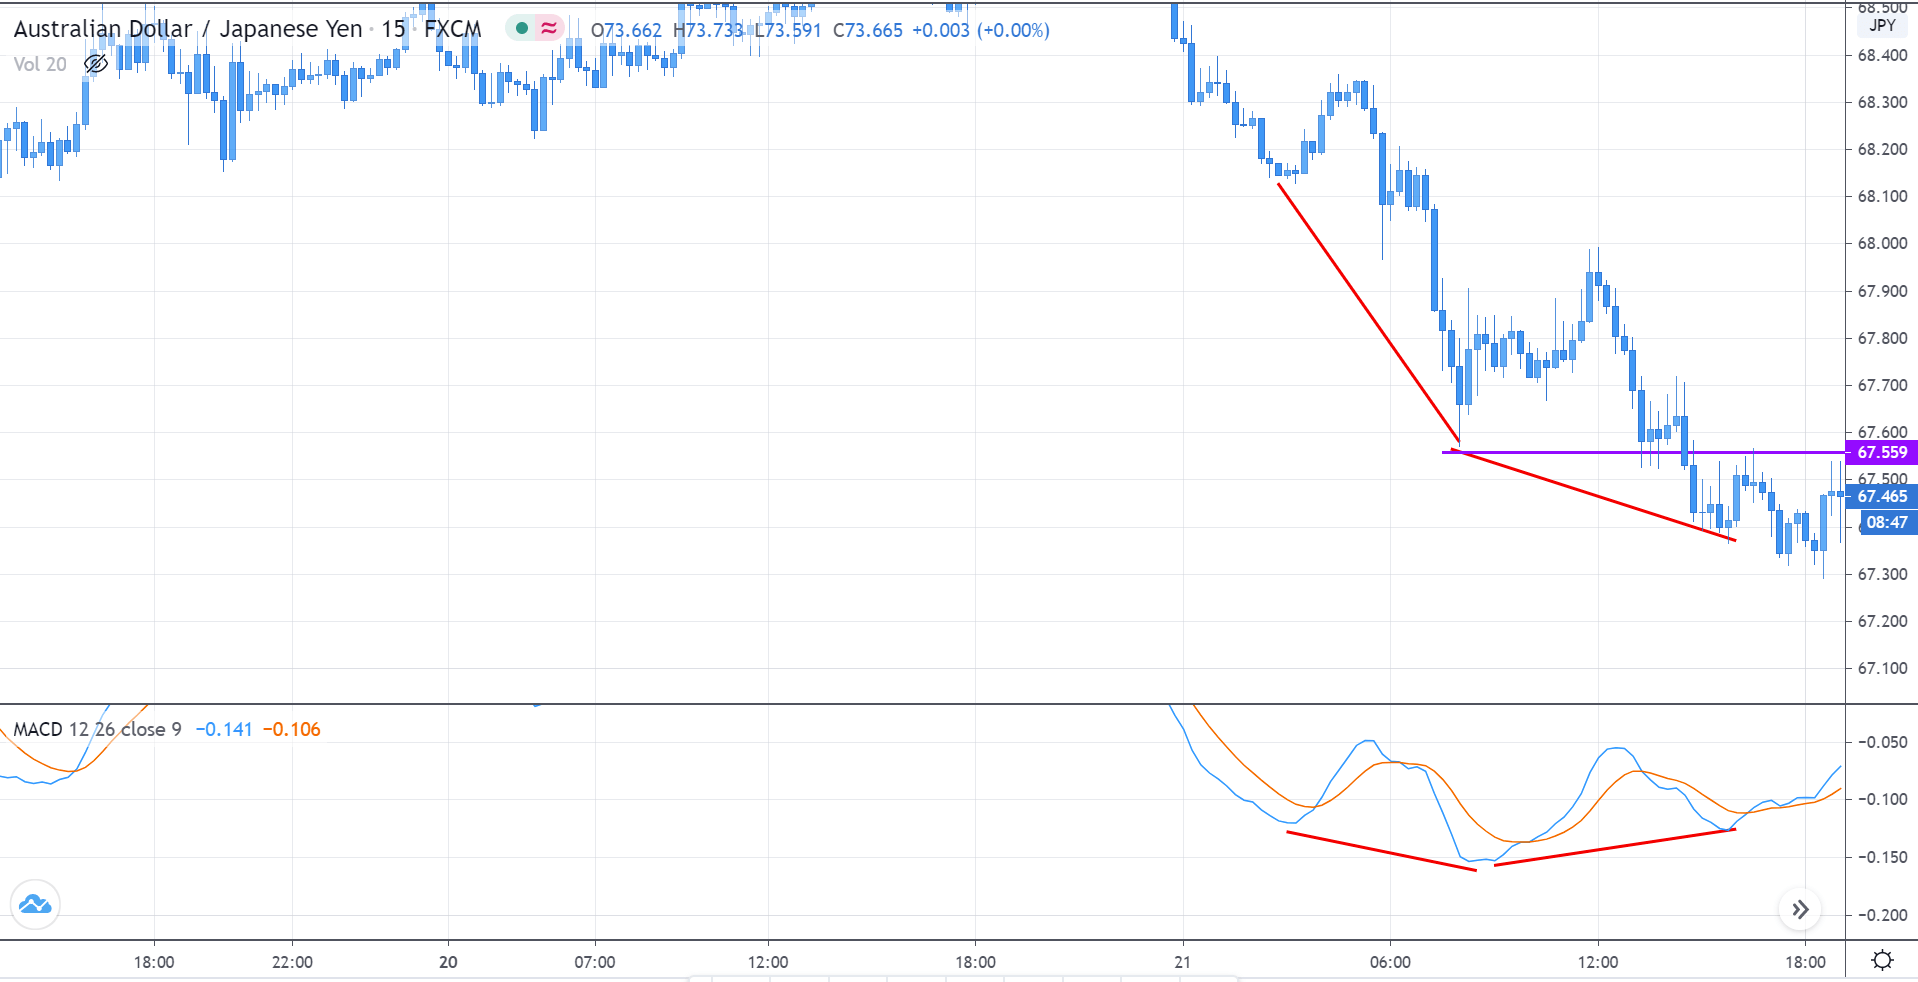
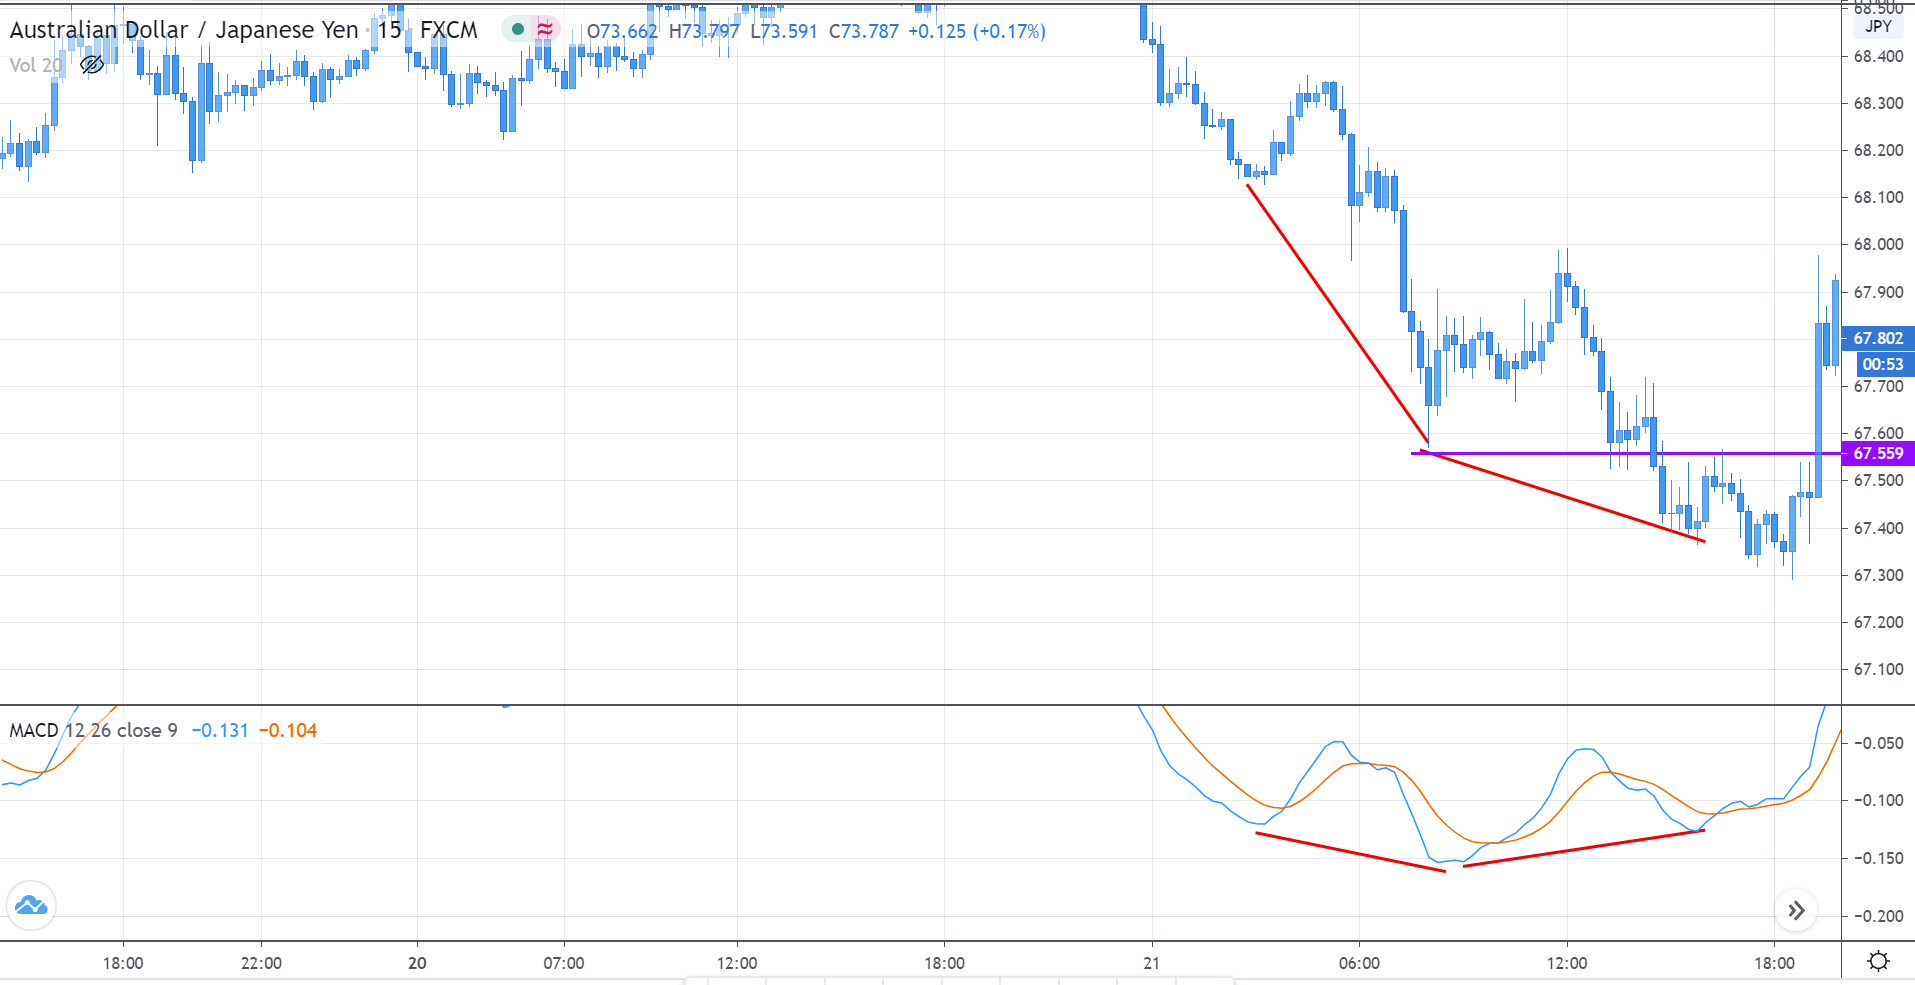
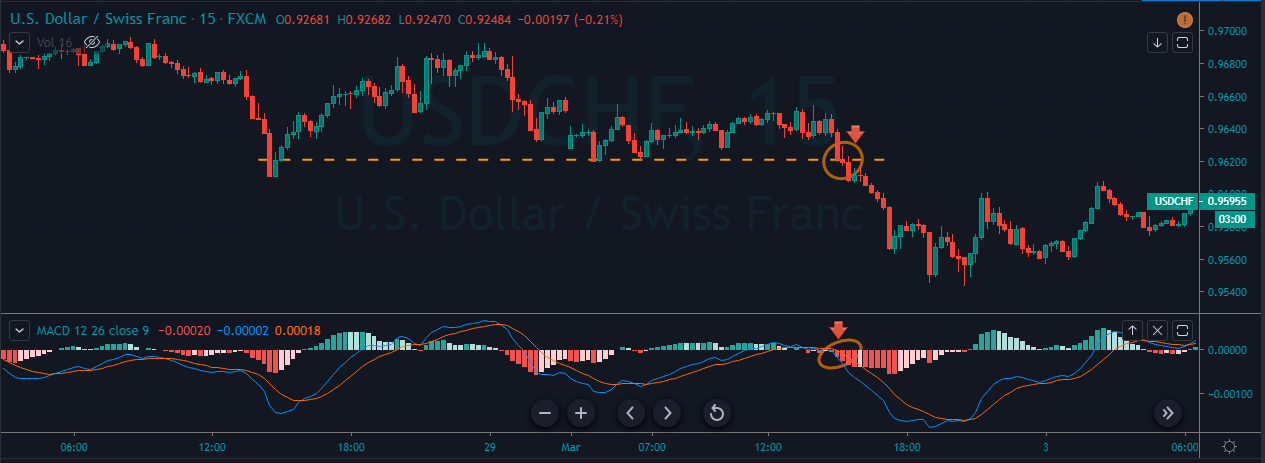
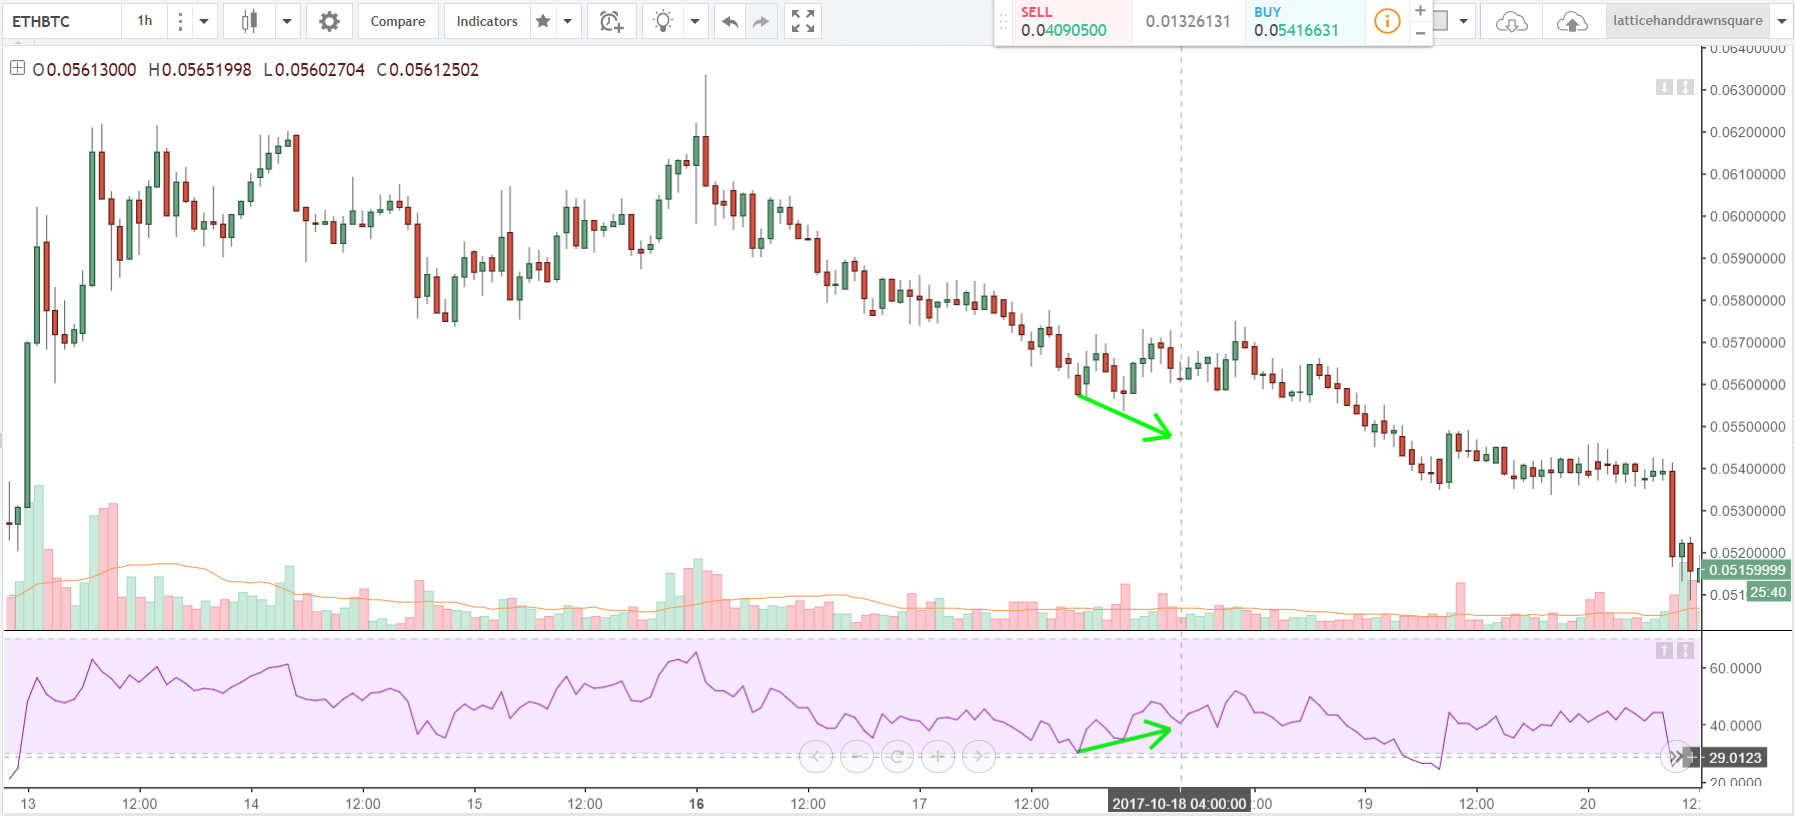
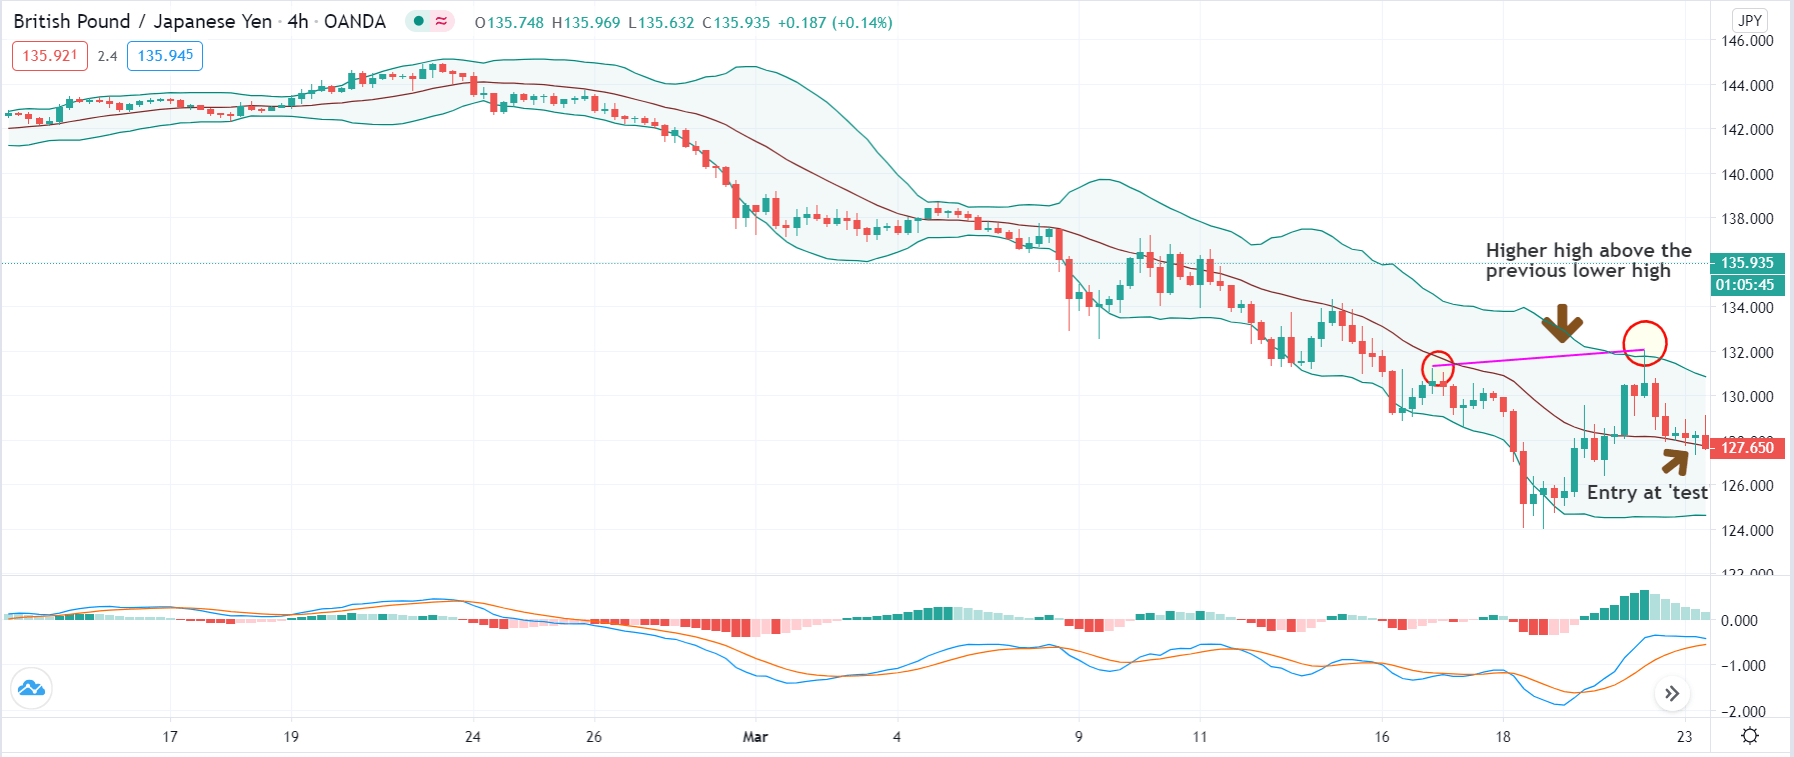
The below image shows a downtrend reversal, as indicated by MACD.

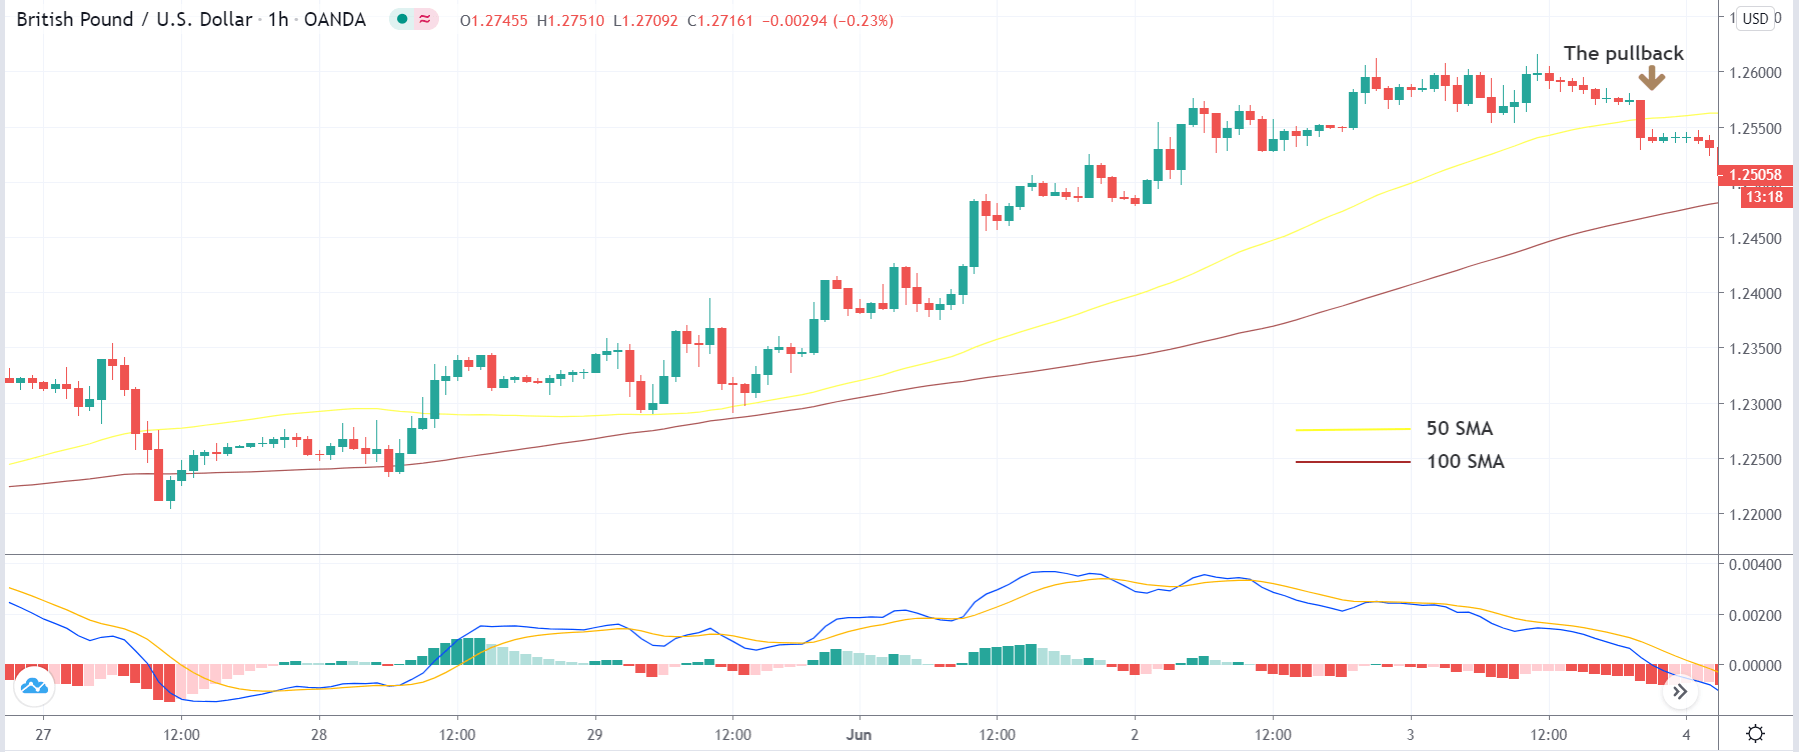
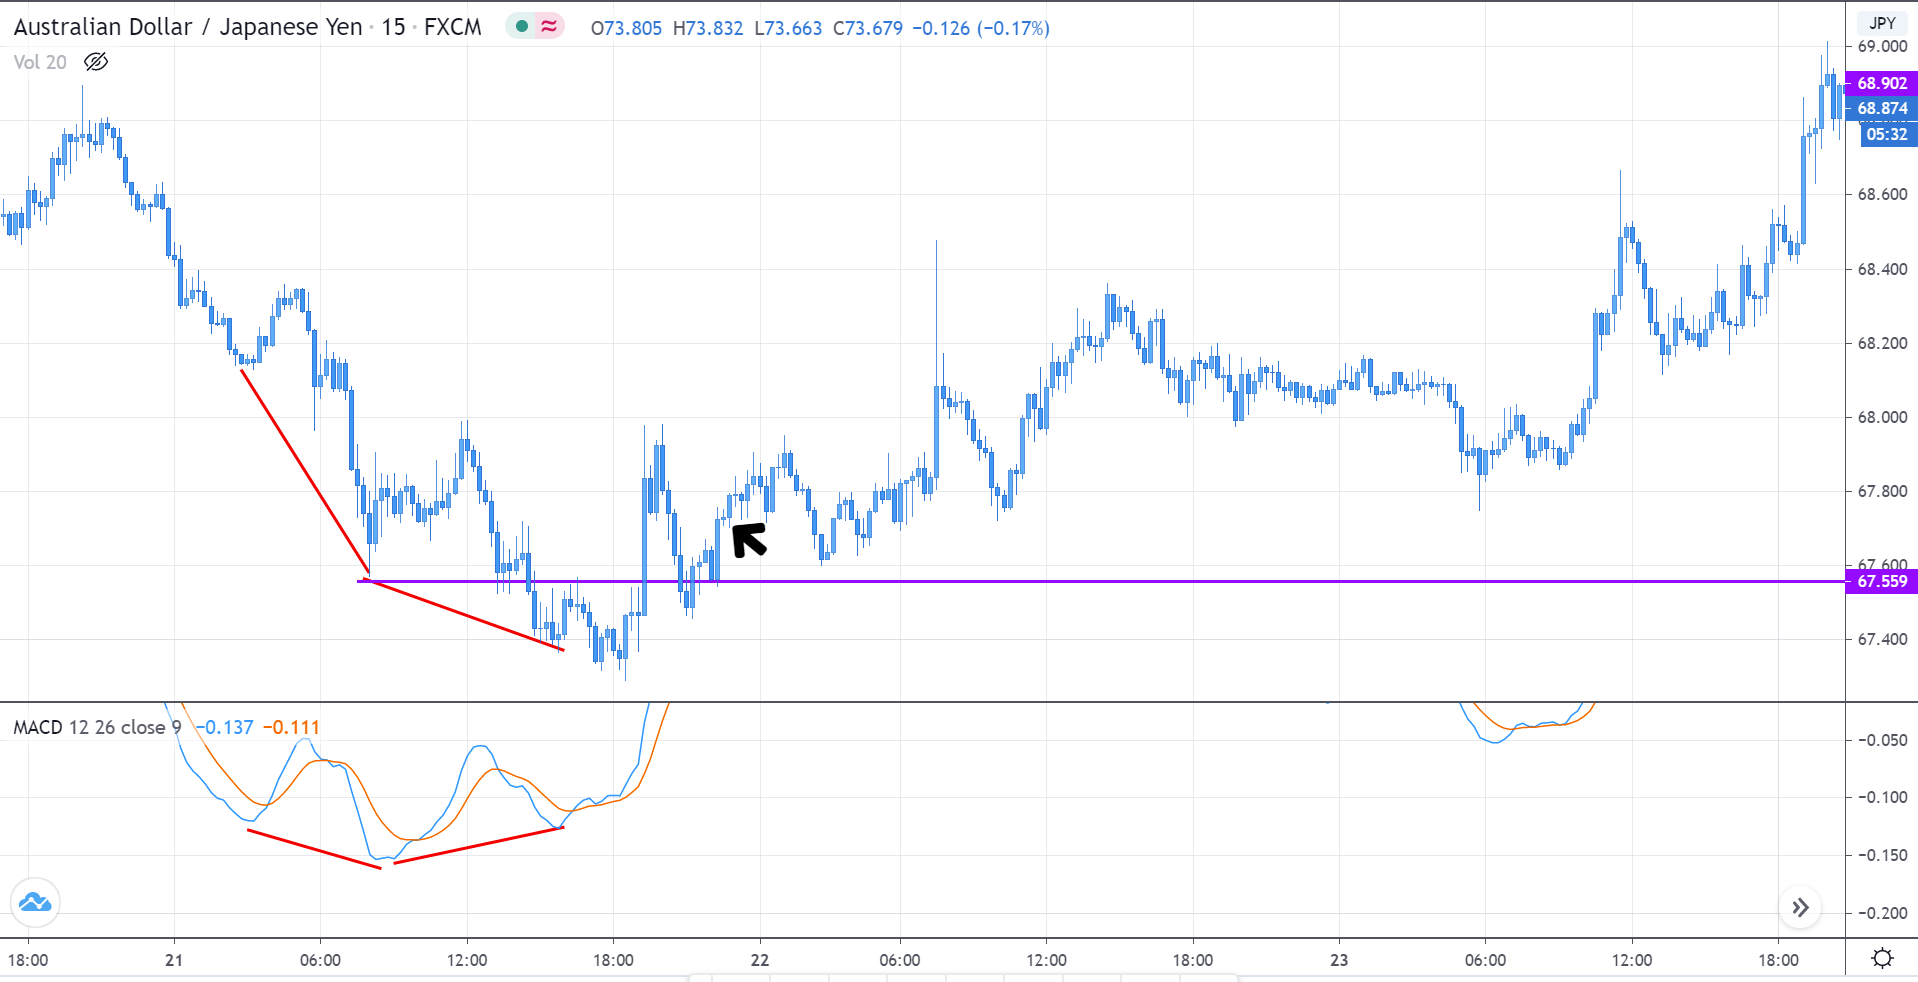
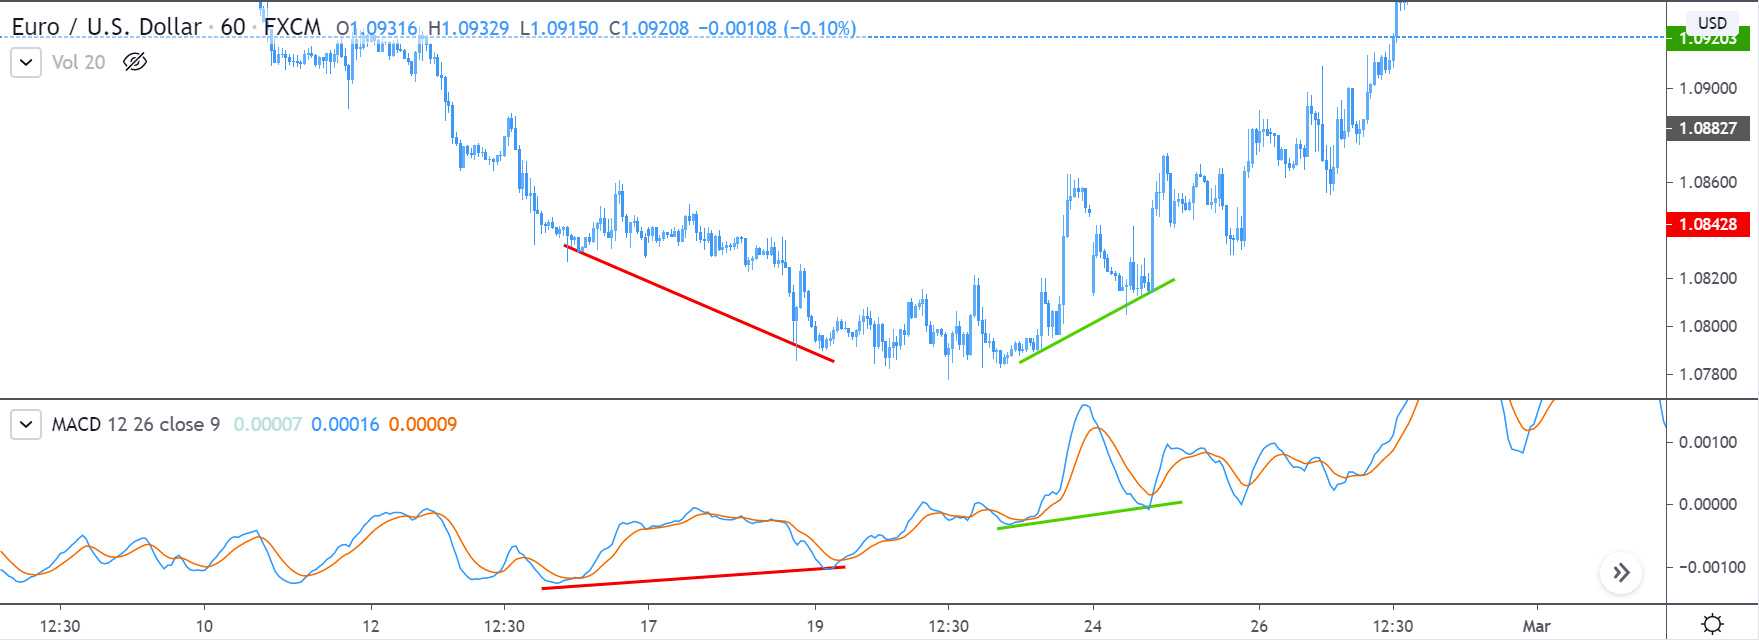
Step 3: In this step, we should make sure that the price makes a ‘high’ that is above the previous ‘lower high,’ in an upward reversal. While in a downward reversal (reversal of an uptrend), the price should make a ‘low’ that is lower than the previous ‘higher low.’ When all these conditions are fulfilled, we can say that the reversal is real, and now we will look to trade the reversal.

We enter the market for a ‘buy’ or ‘sell’ when price ‘tests’ the median line of the Bollinger band after the reversal and stays above (‘buy’) or below (‘sell’).

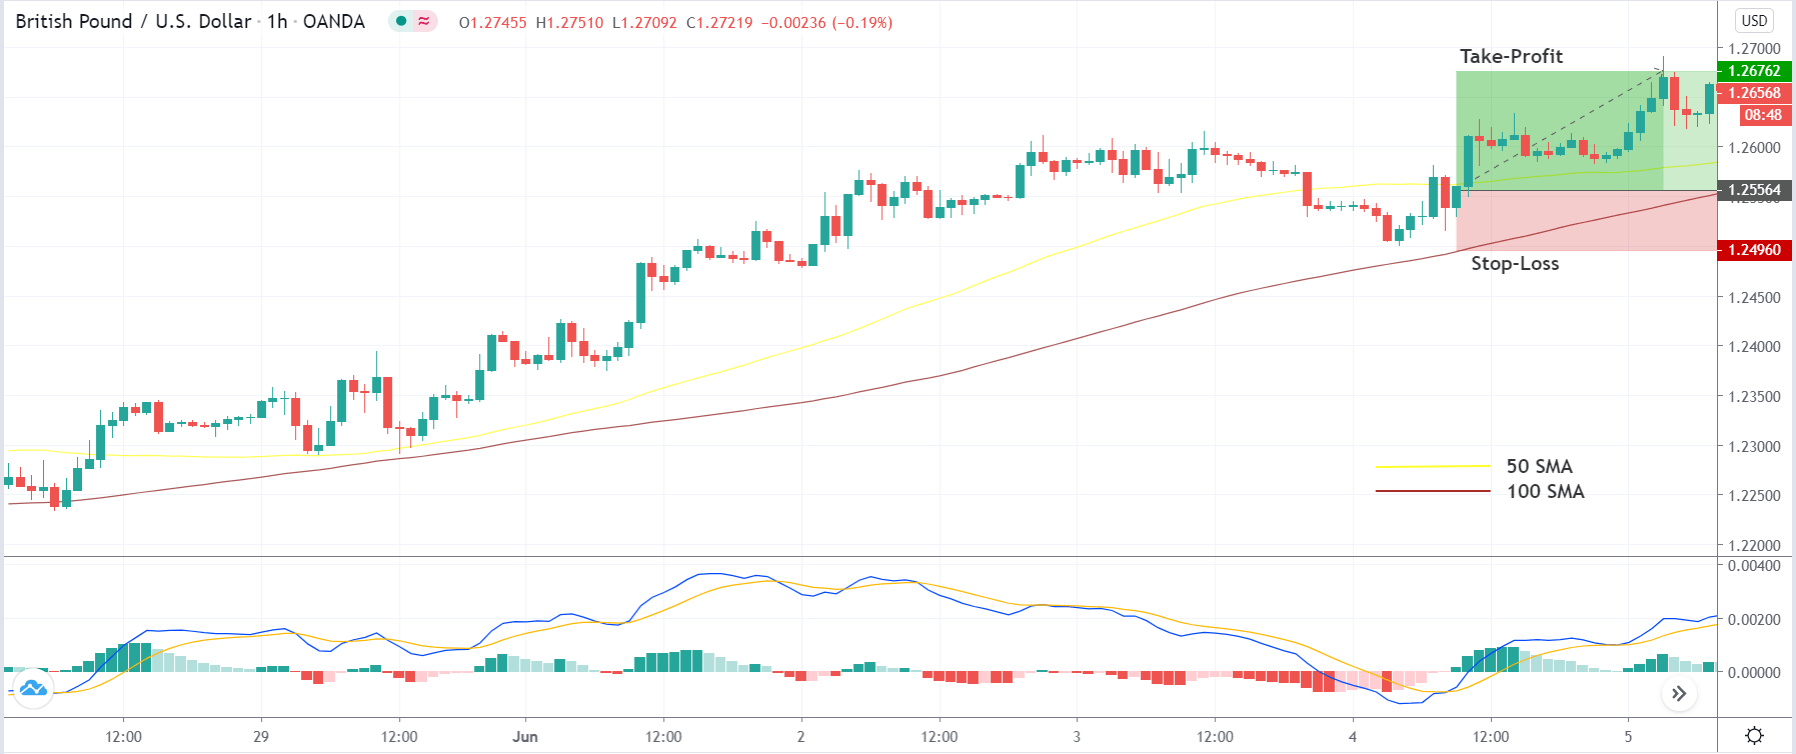
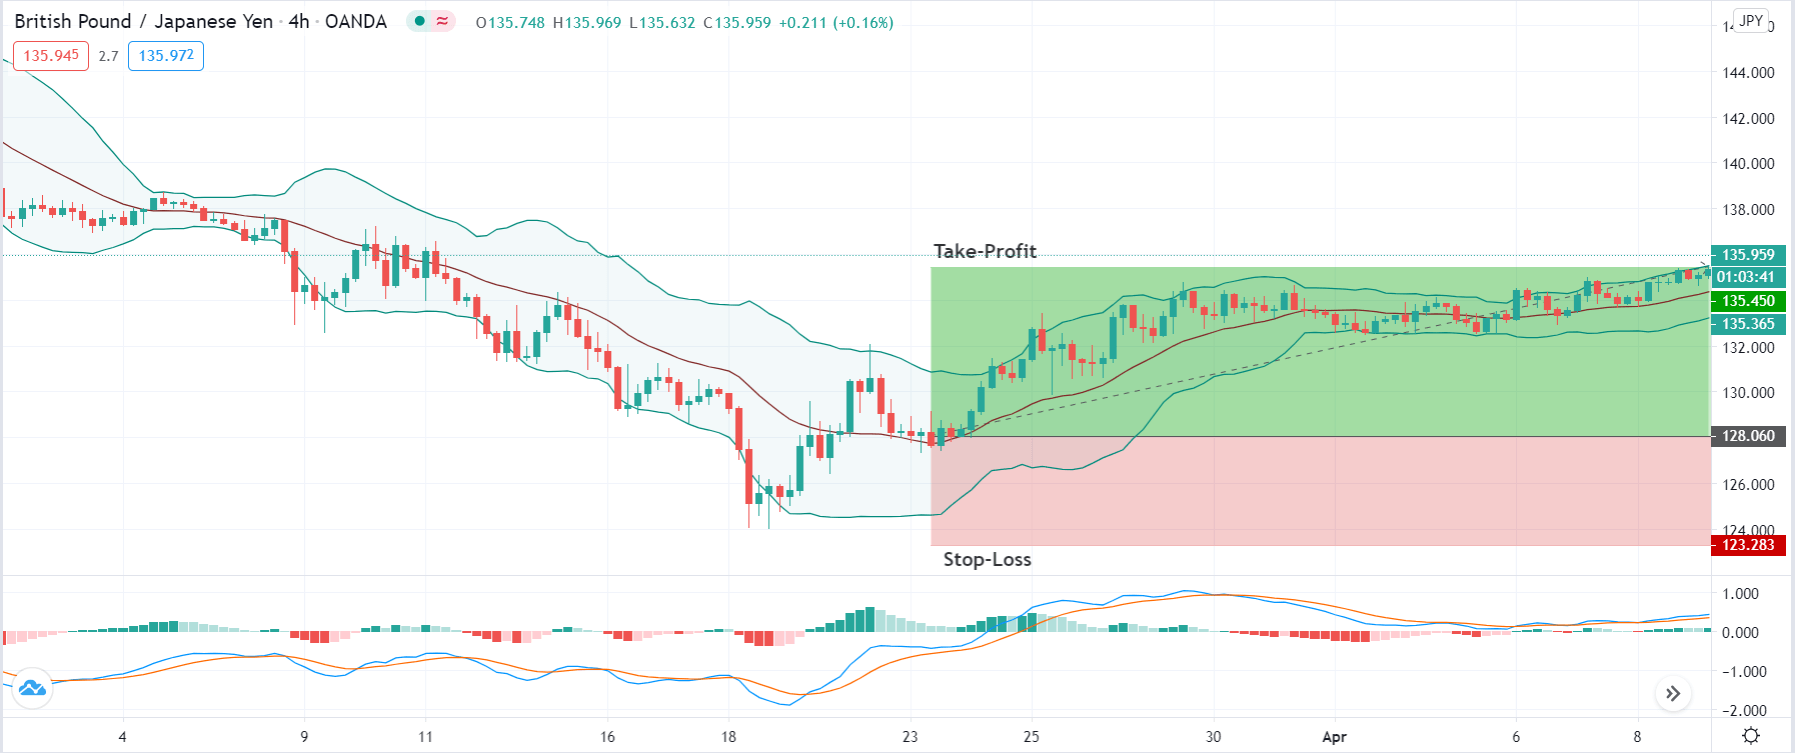
Step 4: Finally, after entering the trade, we need to define appropriate levels of stop-loss and ‘take-profit’ for the trade. The rules of stop-loss are pretty simple, where it will be placed below the lowest point of the downtrend in a ‘long’ position and above the highest point of the uptrend in a ‘short’ position. ‘Take-profit’ will be set such that the risk-to-reward (RR) of the trade is at least 1:1.5. Once the price starts moving in our favor, we will put our stop-loss to break-even and extend our take-profit level.

Strategy Roundup

The combination of the Bollinger band and MACD is not suitable for novice traders. Since it involves complex rules and indicators, we need prior experience of using the indicators and charts before we can apply the strategy successfully. Traders should pay attention to every rule of the strategy to gain the maximum out of it. As there many rules and conditions, there is a tendency among traders to skip some rules, but it is not advisable.

Categories
Forex Basic Strategies

Trading The Most Simple Yet Profitable ‘MACD Combo Strategy’!

Introduction

Theoretically, trend trading is easy. All we need to do is keep buying as long as we see the price rising and keep selling as long as we see the price breaking lower. In practice, it is far more difficult to do it. When looking for such opportunities, many questions arise in our minds, such as:

  • What is the direction of the market?
  • After spotting the trend, how long is the retracement going to last?
  • When is the trend going to end?

The greatest fear for traders is getting into a trend too late. That is, when the trend is coming to an end. Despite these difficulties yet, trend trading is considered to be the least risky and most popular styles of trading. When a trend develops, it can last for hours, days, and even months, depending on the time-frame.

Time Frame

The MACD Combo strategy works well on the 1-hour time frame. After gaining enough experience on the 1-hour time frame, we can also try the strategy on lower time frames.

Indicators

In this strategy, we will be using the following indicators

  1. 50 SMA
  2. 100 SMA
  3. MACD with default settings

Currency Pairs

This strategy applies only to major currency pairs. Some of the preferred pairs are EUR/USD, USD.JPY, GBP/USD, GBP/JPY, and few others. We need to make sure that whichever currency pair we are selecting, it should be fairly liquid.

Strategy Concept

The strategy we have developed answers all of the above questions. It also gives us clear entry and exit signals. This strategy is called the MACD combo. We use two forms of moving averages for the strategy: the 50 simple moving average (SMA) and the 100 SMA. The 50 and 100 input of SMA is suitable for trading on the 1-hour time frame chart. The input will change depending on the time-frame we choose to trade.

The 50 SMA provides a signal for entering a trade, while 100 SMA ensures that we are working in a clear trending market. The main idea of the strategy is that we buy or sell only when the prices cross the moving average in the direction of the trend. The basic concept of the strategy may appear similar to the “momo” strategy but is far more patient and uses longer-term moving averages on hourly charts to capture larger profits.

When this strategy is used on the daily (D) time frame wit the same indicator settings, it gives a larger risk to reward. Hence, this strategy is appropriate for long-term investors and swing traders.

Trade Setup

In order to explain the strategy, we have considered the chart of GBP/USD, where we will be using the strategy on the 1-hour time frame. Here are the steps to execute the MACD combo strategy.

Step 1

The first step of the strategy is to determine the market direction. This means we need to establish the trend of the market. As this is a trend trading strategy, the market must trend in a single direction before we can apply it. In an uptrend, the price should adequately trade above the 50 SMA and 100 SMA for a long period of time. Similarly, for a downtrend, the price should trade below both the SMAs.

In the below image, we see that the market is in a strong uptrend. Hence, we will look for ‘buy’ opportunities.

Step 2

The next step is to wait for a price retracement or a ‘pullback’ to join the trend at this discounted price. We say that the pullback is valid if the price crosses the closest SMA and stays below that SMA at least for a period of4-5 candles. But we need to make sure that the price does not cross below the next SMA. If that happens, the trend gets invalidated, and it may signal a reversal of the trend.

The below image shows that the pullback has crossed the first SMA (50 Period) and has stayed there for more than 5 hours.

Step 3

In this step, we will use the MACD indicator to enter the market. In case of an uptrend, we enter the market for a ‘buy’ as soon as the MACD indicator turns positive. Similarly, in a downtrend, we enter the market for a ‘sell’ when the MACD indicator turns negative. A conservative trader may enter the market after it moves above the SMA.

We can see in the below image that we are going ‘long’ soon after the MACD shows up a green bar. This is an aggressive form of ‘entry’ which requires experience to be able to spot them.

Step 4

In this step, we determine the stop-loss and take-profit for the strategy. Stop-loss is placed below the swing ‘low’ in case of a ‘long’ trade and above the swing’ high’ in case of a ‘short’ trade. Since we are trading with the trend, we will take our profits at the new ‘higher high‘ or ‘lower low’ depending on the momentum of the market. This is the reason behind high risk to reward of trades done using this strategy.

In this case, the risk to reward of the trade is 1:2, which is above the normal range.

Strategy Roundup

Traders implementing the MACD combo strategy should make sure that they only apply the strategy on currency pairs that are typically trending. Also, it is smart to check the crossover’s strength below or above the first moving average. We can also make use of the ADX indicator to check the momentum of the pullback. It is important to check the momentum of the trend and the pullback when trend trading.

Categories
Forex Market Analysis

Russell 2000 Technical Overview

The U.S. stock index Russell 2,000 and the S&P 500 shows a divergence in its long-term trend. While the S&P 500 reaches fresh highs recovering from its 2020’s losses, the Russell 2000 index remains negative.

As the previous chart illustrates, Russell 2000 continues moving below its 24-month moving average while the S&P 500 already moves on the bullish side. This market context could lead Russell 2000 to see more declines in the coming weeks, although, currently the short-term bias is still hinting to further advances.

Market Sentiment Overview

This year, the index that groups the 2,000 most prominent small-cap U.S. companies sheds near 11.5% (YTD), dragged by the pandemic lockdown.

The following chart exposes to Russell 2000 in its daily timeframe. On the figure, we distinguish the price moving above the 60-day moving average, which leads us to conclude that the short-term bias still remains on the bullish side.

At the same time, from the 52-week high and low range, we note the price action continues moving bellow the 1,523.65 pts, which makes us hold our bullish bias. In this context, the possibility of a strike over the 1,523.65 pts could reveal an extreme bullish sentiment on the Russell 2000 index.

On the other hand, the absence of a bearish reversal pattern discards, for now, the probability of a plummet in the U.S. stock market.

Elliott Wave Outlook

The short-term Elliott wave perspective of the Russell 2000 index exposed in its 4-hour chart reveals the recovery experienced by the U.S. stock market from last March 23rd when the price found fresh buyers at 963.62 pts.

In the previous chart, we observe a first five-wave structural sequence corresponding to a leading diagonal pattern identified as wave ((a)) of Minute degree labeled in black. The first five-wave sequence topped at 1,376.52 pts where the price started to develop a corrective move in three waves corresponding to wave ((b)) in black, which found support at 1,177.26 pts on May 14th.

Once the second wave ended, the price began a new rally, which remains in progress. After the third wave of Minuette degree labeled in blue, Russell 2000 developed a correction identified as a triangle pattern. After the breakout of the upper guideline b-d, the U.S. index resumed its short-term upward trend.

Currently, the price action remains consolidating in a wave ii of Subminuette degree identified in green. In this context, the RSI oscillator continues moving above the 40-level, which leads us to confirm the retracement and the bullish bias of Russell 2000.

Finally, the upward continuation could drive to Russell 2000 toward 1,590.42 and even extend its gains until 1,702.17 pts. On the other hand, the bullish scenario will remain valid while the price continues above 1,377.25 pts.

Categories
Forex Course

133. Divergence Cheat Sheet and Summary

Introduction

The previous chapters dealt with the interpretation of divergence, its types, strategies, and the rules involved in it. In this article, we have provided a cheat sheet that will cover all the divergence topics in short.

Divergence: This a concept in technical trading that determines if the market is going to reverse or continue the trend. It is identified when the price and the indicator move in opposite directions.

Based on the direction it will prevail in, there are two types of divergence:

  1. Regular Divergence
  2. Hidden Divergence

Each of them is divided into types – Bullish and Bearish, based on the direction they are biased. Here is a quick cheat sheet for trading Regular and Hidden Divergence.

Regular Divergence

Regular divergence is divergence, which indicates a reversal in the market. These occur during the end of a trend and are quite easy to spot.

Hidden Divergence

Hidden divergence indicates a possible trend continuation. These usually occur at the beginning of a new trend and are comparatively tricky to spot.

Not all indicators can be used to spot divergence. Only momentum oscillators indicate a divergence in the market. Some of the most used momentum oscillators to determine divergence include Commodity Channel Index (CCI), Relative Strength Index (RSI), Stochastic, and William %R.

Divergence is a trading concept that works exceptionally well in some cases but fails to give the right indication sometimes. Thus, traders must follow every rule that is discussed in the previous article. We hope you found this course of Divergence trading informative and useful. Happy trading!

Categories
Forex Course

131. Timing Your Entry While Trading Divergence

Introduction

Divergence is a powerful tool in trading. It works like a charm when used correctly. However, traders enter right after they spot a divergence, which is an incorrect method to trade it. Early entry can lead to spikes or wrong comprehension; as a result, executing your stop loss. Thus, precise entries are as crucial as understanding divergence. This shall go over some tips and tricks to not enter early in a trade.

The Double Confirmation Rule

When we spot a regular divergence, the market does not reverse immediately. The majority of the time, it goes through a consolidation phase. And patiently waiting through the price action is necessary. Here is an example that explains how long a trader must wait before taking the trade.

Below is the chart of GBP against CAD on the 15mins time frame. Reading from the left, the market was in a downtrend, making lower lows and lower highs. In the second lower low, we see that the indicator failed to make a lower low but made a higher low instead. There are several ways through which the market can reverse its direction. The double confirmation rule is for the situations when the market holds above the S&R level (purple ray).

According to the rule, the price must successfully hold above the S&R level two times. This is a confirmation that the S&R level has potentially turned into Support. So, when the rule is satisfied, you can place a buy order right at the S&R level. A logical Stop Loss must be maintained a few pips below the start of the buyer who broke above the S&R. Whereas a safe Take Profit can be at a strong Supply area.

The Spike confirmation

The previous case dealt when the scenario when the market held above the S&R level. Conversely, this is a scenario when the market holds below the S&R. Let us understand the spike confirmation entry with an example from real charts. Below is the chart of EUR against USD on the 15mins time frame. Initially, the market was trending down with lower lows. From the most recent low, we see that the price moved down, but the MACD indicator is faced up, indicating divergence.

When the buyers began to pull back, they were unable to pass through the S&R level (purple line), unlike the previous example. Thus, we cannot apply the double confirmation rule. Instead, the spike confirmation is applied. The spike confirmation is applied for scenarios when the market holds below the S&R level. According to it, one must wait until the market attempts to make a lower low and fails. After the failure, one can prepare to go long.

The Logic

When the market holds below the S&R level, it means that the sellers are not done with their business. The job of a seller is to make lower lows by holding below the S&R. So, though there is divergence, we cannot ignore the fact that the sellers are still in the game. Thus, we must wait for the sellers to attempt to make a lower low. And if the price shoots right back up, it signifies that the sellers are done with their business, and the buyers have taken over the market.

Once the buyers come up strong, you can trigger a buy at the most recent S&R (dotted line). The Stop Loss will go right below the area where the sellers had failed. Take Profit can be at a potential supply area. But in this case, we see a divergence when the price made a higher high. Thus, the positions must be liquidated in the area shown in the chart.

Note that the same principles can be applied to an uptrend as well. These were only a couple of effective ways to enter using divergence. As you gain experience, you come with your own rules too.

[wp_quiz id=”78246″]

Categories
Forex Course

130. How to Effectively Trade Regular Divergence?

Introduction

The occurrence of divergence is considered by all types of traders, including traders who do not analyze charts without indicators. This is because divergence gives an edge to their trading strategy. In the previous lessons, we interpreted the meaning of divergence and also its different types. In this lesson, we shall put this knowledge into action, where an effective strategy will be discussed.

Trading a regular divergence

To recap a real quick, regular divergence is a type of divergence which indicates a reversal in the market. If it indicates a reversal to the upside, it is referred to as bullish divergence and bearish divergence for a reversal to the downside.

Spotting regular divergence

  1. Find the overall trend of the market.
  2. Mark the lower lows for a downtrend and higher highs for an uptrend on the price charts.
  3. Draw the corresponding movement on your choice of oscillator indicator.
  4. Determine if both prices and indicators are making the same sequences. If they are moving apart from each other, then we conclude that divergence has occurred.

Trade Example

Consider the below chart of AUD/JPY on the 15mins time frame. We can see that the market is in a downtrend making lower lows. For the first lower low in the price, the MACD had a lower low as well. But, for the second lower low in price, the indicator made a higher low. Thus, showing divergence in the market.

Since this is a regular bullish divergence, it indicates a reversal in the market. But, note that divergence does not give a trading signal to buy the security. An indication of a reversal must be based on the strategy. Here are some compelling points to confirm the legitimacy of a divergence.

When divergence occurs in a pair, the first factor is to measure the length and momentum of the down pushes. Comparing the first down push to the second, it is observed that the latter is smaller in length and also took a greater number of candlesticks than the former. This is a considerable indication that the downtrend is weakening.

Secondly, observe what the price does when it reaches the Support & Resistance level (purple ray). We can see that the price touched the purple ray, tried to go below the recent low, but failed to do so. This is another indication of the sellers’ weakening.

Now that the sellers are losing strength, we wait for the other party (buyers) to kick in. In the below chart, we can see the entry of the buyers with one massive bullish candlestick. This becomes our first confirmation that the big buyers are in the market.

However, it is not ideal to buy right when the buyers show up because, at times, the sellers could take over and continue to make lower lows. Thus, to confirm the reversal, the buyers must hold above the S&R level (purple ray). In the below chart, we see that the price came down, tried to go lower the S&R, didn’t succeed, and held above it. Hence, this confirms that the market has prepared for a reversal, and we can go long when the candlestick closes above the purple ray, as shown by the black arrow.

As a result, we see that the market successfully reversed its direction and began to make higher highs.

[wp_quiz id=”77943″]
Categories
Forex Course

129. Learning The Concept Of Hidden Divergence

Introduction

In the previous lesson, we discussed regular divergence and its types. In this lesson, we shall continue with the second type of divergence – hidden divergence. The concept of divergence in this type remains the same but differs in the indication it provides.

What is the Hidden Divergence?

In a trending market, the prices make higher highs or lower lows. In addition to that, it sets in higher lows or lower highs as well. When the market prepares to reverse, the lower low or higher high turns to equal high or equal low.  The higher lows or lower highs become the other way round. And in the new leg of the trend, if there is divergence, it is referred to as hidden divergence.

In simple terms, hidden divergence is used to indicate trend continuation in the middle of a trend or typically at the beginning of a new trend.

Types of Hidden Divergence

There are two types of Hidden divergence based on the direction it indicates:

  • Hidden Bullish Divergence
  • Hidden Bearish Divergence

Let’s understand how each of them is formed with examples as well.

Hidden Bullish Divergence

In a downtrend, the market makes lower lows and lower highs. In preparation for a reversal, it leaves a higher low instead of a lower low. Also, there could be a higher high or equal high. In this price action, if there is a lower low in the oscillator, it indicates a hidden bullish divergence. It signals that the price could continue to go north.

In the above chart of AUD/USD, we can see that the market is coming from a downtrend. Later, the market does not hold at S&R to make a new lower low but makes a higher low. Looking at the indicator, it leaves a lower low. Hence, showing divergence and indicating that the market has turned into an uptrend and will possibly continue its move up.

Hidden Bearish Divergence

In the market goes into a transition from an uptrend to a downtrend, the price which was making higher highs now starts to make lower highs. In addition, the oscillator puts in a higher high for the lower high in the price chart. Thus, showing a hidden bearish divergence. It is an indication that the market is going to continue in a downtrend.

In the above chart of AUD/USD, the market was initially coming from an uptrend making higher highs. Later, it turned directions and made a higher low instead of a higher high. But the RSI made a higher high for the same move. Thus, indicating divergence and most probable continuation of the downtrend.

[wp_quiz id=”77847″]
Categories
Forex Course

128. Interpreting Regular Divergence

What is Regular Divergence?

Markets move in trend, channels, and ranges. For any market to undergo a change in the direction, it must happen as a transition. For example, a market that has to transit from an uptrend to a downtrend, it has to go from an uptrend to a channel, to a range, and then begin the downtrend. That is, at one point in time, the market does not hold at support & resistance, and stops making higher highs. And this market reversal is indicated by the regular divergence.

Types of Regular Divergence

There are two types of regular divergence:

  • Regular Bullish Divergence
  • Regular Bearish Divergence

Let’s understand each of them with the help of live charts

Regular Bullish Divergence

This type of divergence is used to give a bullish signal in the market. When the market is in a downtrend, making lower lows and lower highs, the oscillator follows the same path. At one point, the price chat makes a lower low, but the oscillator makes a lower high. The oscillator does the opposite of what the price did. And this referred to as bullish divergence. Here is an example of the same.

In the above chart of EUR/AUD, reading the market from the left, we see that it was in a downtrend. As the prices were making lower lows, the indicator followed the same. But later, when it made another lower low, the MACD made a higher low, indicating divergence in the market. When it left higher low, we see that the price did not make any lower low from the S&R level. And finally, the market reversed and began to move north.

Regular Bearish Divergence

Regular bearish divergence is used to forecast bearishness in the market. In an uptrend, the market makes higher highs and higher lows. The oscillator indicators follow the same trajectory as well. But, if the price makes a higher high and oscillator does the opposite (lower high), then it is referred to as a bearish divergence. It is an indication that something is not right with the uptrend, and there are possibilities of a trend reversal.

In the above chart of AUD/CAD, we see that the market made a higher high, and the MACD indicator made a higher high as well, indicating that the uptrend is still intact. But the second time when the market made a higher high, the indicator put a lower high—indicating that there is something wrong with the uptrend and could be a possible reversal. In hindsight, we infer that the market failed to make higher highs and then reversed.

Note that divergence provides an indication that there could be a possible reversal in the market. It does not give a signal to buy or sell. The reversal must be solely based on your strategy. Divergence is only used to confirm the strategy and increase odds in your favor.

[wp_quiz id=”77668″]
Categories
Forex Course

104. Understanding the Essence of the Momentum (Using MACD Indicator)

Introduction

Momentum indicators are those indicators that determine the rate of price changes in the market. These indicators are helpful in determining the change in the market trend. In this lesson, we shall be talking about the MACD indicator, which is one of the most extensively used momentum indicators.

Moving Average Convergence Divergence – MACD

Moving Average Convergence Divergence – MACD is a momentum indicator that primarily works on the relationship between two moving averages of an instrument’s price. Precisely, it takes Exponential Moving Average into consideration for its calculation.

A misconception in the industry is that MACD is a lagging indicator. There are a set of people considering it as a leading indicator, while some see it as a lagging indicator and use it as a confirmatory tool. Note that MACD is both leading as well as lagging indicators.

MACD is said to be a leading indicator when it is used to identify oversold and overbought conditions. It indicates the possibility of a reversal when the market is actually moving in the other direction. However, this form is not widely used. On the other hand, it is said to be a lagging indicator if it is used for crossovers. One will be aware of the market trend when there is a crossover on the indictor. But when this happens, the market would have already made its move.

Also, that’s not it. The real element of momentum is added by the histogram. This true aspect of MACD reveals the difference between the MACD line and the EMA. When the histogram is positive, i.e., above the zero-midpoint line but is declining towards the midline, then it indicates a weakening uptrend. On the contrary, if the histogram is below the zero-midpoint line, but is climbing towards it, then it signifies a slowing downtrend.

Apart from this, it is also used for identifying divergence in the market. That is, indicates when there is abnormal motion in the market, hence, indicating a possible change in direction.

What is the MACD indicator composed of?

The MACD is made up of two moving averages. One of them is referred to as the MACD line, which is derived by finding the difference between the 26-day EMA and the 12-day EMA. The other is the signal line, which is typically a 9-day EMA. And there is a zero-midpoint line where the histogram is placed.

MACD as a Momentum Indicator

To understand how momentum works in MACD, consider the example given below.

Firstly, the market is in a downtrend where the purple line represents the Support & Resistance level. In other terms, this line indicates a potential sell area. Below the price chart, the MACD indicator has plotted as well. Observing closely at the histogram at the marked arrow, it is seen that the histogram was falling towards the zero-midpoint line indicating the weakness of the buyers. Also, this situation happened in the area where the sellers are willing to hit the sell. In hindsight, the MACD gave the right signal solely from the histogram.

This hence concludes the lesson on momentum indicators. We hope you found this lesson very informative. If you have questions, leave us a comment below.

[wp_quiz id=”71030″]
Categories
Forex Course

102. Brief Introduction To Momentum Indicators

Introduction

Leading and lagging indicators are not the only categorizations of technical indicators. If we dig deeper, we can find more classifications and momentum indicators are one such classification in leading indicators. Before getting into momentum indicators, let’s first define the term momentum. Momentum, in general (physics), is the product of mass and velocity. The meaning of momentum is not different in trading too.

What are the Momentum Indicators?

Momentum indicators are a type of indicator that determines the velocity or the rate at which the price changes in security. Unlike moving averages, they don’t depict the direction of the market, only the rate of price change in any timeframe.

Calculating Momentum

The formula for the momentum indicators compares the most recent close price with the close price of a user-specified time frame. These indicators are displayed as a separate line and not on the price line or bar. Calculating momentum is simple. There are two variations to it but are quite similar. In both, momentum is obtained by the comparison between the latest closing price and a closing price ‘n’ periods from the past. The ‘n’ value must be set by the user.

1) Momentum = Current close price – ‘n’ period close price

2) Momentum = (Current close price / ‘n’ period close price) x 100

The first formula simply takes the difference between the closing prices while the second version calculates the rate of change in price and is expressed as a percentage.

When the market is moving upside or downside, the momentum indicator determines how strongly the move is happening. A positive number in the first version determines strength in the market towards the upside, while a negative number signifies bearish strength.

How are Momentum Indicators useful?

As mentioned, momentum indicators show/predict the strength of the movement in prices, regardless of the direction, be it up or down. Reversals are trades where one can make a massive killing with it. And momentum indicators help traders find spots where there is a possibility of the market to reverse. This is determined using a concept called divergence, which is discussed in the subsequent section.

Momentum indicators are specifically designed to show the relative strength of the buyers and sellers. If these indicators are combined with indicators that determine the direction of the market, it could turn out to be a complete strategy.

Concept of Divergence

Consider the chart of EUR/USD given below. The MACD indicator (momentum indicator) is plotted as well. From the price chart, the market was in a downtrend, but the divergence was moving upward. It means that the indicator has diverged from the price chart and is indicating that the sellers are losing strength.

In hindsight, the market reversed its direction and started to move upwards. Hence, the MACD predicted the reversal in the market. Moving forward, when the market laid its first higher low, the MACD too was inclined upwards, indicating that the buyers are strong, and the uptrend is real. And yet again, the MACD proved itself right.

This concludes the lesson on momentum indicators. In the coming lessons, let’s get more insights over this topic. Don’t forget to take the below quiz before you go.

[wp_quiz id=”70612″]
Categories
Forex Course

82. Using The MACD Indicator To Identify Potential Trading Signals

Introduction

The MACD indicator was developed by Gerald Appel in the late 1970s. It stands for Moving Average Convergence and Divergence. MACD is quite popular, and it can be considered as one of the safest and most effective momentum indicators in the market. As the name suggests, this indicator is all about the convergence and divergence of the two moving averages. When the moving average moves away from each other, the convergence occurs. Likewise, the divergence occurs when the moving average of the indicator moves towards each other.

MACD fluctuates above and below the zero lines, unlike the RSI indicator that we discussed yesterday. Also, since MACD is an unbound indicator, it is not useful to find out the overbought and oversold market conditions. Instead, traders can look for the signal line crossovers, centerline crossovers, and divergence to trade the market.

The image below represents the MACD indicator on the GBP/USD Forex chart.

How To Trade Using The MACD Indicator?

Signal Line Crossovers

The signal line crossover is one of the most popular trading strategies designed around the MACD indicator. A bullish crossover occurs when the indicator prints a crossover below the zero-line.  Contrarily, A bearish crossover occurs when the MACD prints a crossover above the zero-line.

If you are trading the lower timeframe, these crossovers last for a few hours. But if you are trading the higher timeframe, these crossovers can last a few days or even weeks. In the below chart, we can see a buy and sell signal generated by using the MACD indicator. In simple words, crossover below the zero-line indicates a buying trade, and the crossover above the zero-line indicates a selling trade.

Trade The Zero Line By Following The Trend

When the MACD line goes above the zero-line, it means that the trend of the instrument is gaining strength. When this happens, any buying anticipation will be a good idea. Conversely, when the indicator goes below the zero-line, it indicates a strong downtrend, and going short in the market is a good idea at that point.

If we plan to go long, it is advisable to trade with the trend. In a buy trend, if the MACD line indicates a selling signal, try to ignore that signal and wait for the buy signal. The same applies to the sell-side as well. If we find any breakout or breakdown supporting the MACD signal, that increases the probability of our trade performing in our desired direction.

The below image represents a sell signal by using the MACD indicator. In a downtrend, when the price action broke the major resistance line, we can see a crossover on the MACD indicator below the zero-line. This clearly indicates the gained momentum by the sellers,, and going short from here will be a good idea. Make sure to book the profit when the MACD indicator gives the crossover to the buying side.

MACD Indicator + Double Moving Average

We have learned what Moving Averages are and how to use them on the price charts. In this strategy, we are pairing the MACD indicator with 9-period and 15-period moving averages to identify potential trading signals.

The strategy is to go long when the MACD gives a crossover below the zero-line and the moving averages crossover below the price action. Conversely, go short when the MACD indicator gives the crossover above the zero-line and the moving averages crossover above the price action. It is advisable to use this strategy in healthy market conditions, and the lower period averages work fine for intraday trading only.

As you can see in the below chart, the market was in an uptrend. Using this strategy, we have identified three buying opportunities. All of these three trading opportunities have gives us 70+ pip profit in just two days. As we know that the moving averages act as dynamic support and resistance to price action, it is safe to put the stops just below the moving average indicator and exit our position when any of the indicators give an opposite signal.

That’s about the MACD indicator and how to trade the Forex market using this indicator. If you have any questions, let us know in the comments below. Stay tuned to learn about many more technical indicators in the upcoming sections.

[wp_quiz id=”66874″]
Categories
Forex Indicators

Let’s Trade Divergences!

Trading with Divergences

Almost all forms of technical analysis involve the use of lagging indicators – or lagging analysis. There are very few indicators that use any type of leading analysis. That is because we don’t know what will happen. All we can do is interpret what kind of future behavior may occur based on past events – this is the basis of all psychology and significant portions of medicine: we can only predict future behavior by analyzing past behavior. Now, just because most of the tools and theories used in technical analysis are lagging in nature – it doesn’t mean that there is no method of leading analysis.

Divergences are one method of turning lagging analysis into leading analysis – it’s not 100% accurate, but divergences can detect anomalies and differences in normal price behavior. Divergences are useful in identifying when a significant trend may be ending or when a pullback may continue in the prior trend direction. Let’s review some of those now.

Divergences are easily one of the most complex components to learn in technical analysis. First, they are challenging to identify when you are starting. Second, it can be confusing trying to remember which divergence is which and if you compare highs or lows. It is essential to know those divergences themselves are not sufficient to decide whether or not to take a trade – they help confirm trades.

When we look for divergences, we are looking for discrepancies between the directions of highs and lows in price against another indicator/oscillator. The RSI is the oscillator used for this lesson. We are going to review the four main types of divergences:

  1. Bullish Divergence
  2. Bearish Divergence
  3. Hidden Bullish Divergence
  4. Hidden Bearish Divergence

Bullish divergence

Bullish Divergence

A bullish divergence occurs, generally, at the end of a downtrend. In all forms of bullish divergences, we compare swing lows in price and the oscillator. For a bullish divergence to happen, we should observe price making new lower lows and the oscillator making new higher lows. When bullish divergence occurs, prices will usually rally or consolidate.

Bearish divergence

Bearish Divergence

A bearish divergence is the inverse of a bullish divergence. A bearish divergence occurs near the end of an uptrend and gives a warning that the trend may change. In all forms of bearish divergence, we compare swing highs in price and the oscillator. For a bearish divergence to happen, we should observe price making new higher highs and the oscillator making new lower highs.

Hidden divergences

The last two divergences are known as hidden divergences. Hidden does not mean that it is difficult to see or hard to find – rather, it shows where a short term change in direction is actually a continuation move. Think of it as a pullback or a throwback in a larger uptrend or downtrend. Hidden divergences tell you of a probable continuation of a trend, not a broad trend change. If you combine these with common pullback and throwback patterns such as flags and pennants, then the identification and strength of a hidden divergence can yield extremely positive results.

Hidden Bullish Divergence

Hidden Bullish Divergence

A hidden bullish divergence can appear in uptrends and downtrends but is only valid if there is an existing uptrend. It’s easier to think of hidden bullish divergences as pullbacks or continuation patterns. For hidden bullish divergences, we should observe price making new higher lows and the oscillator making new lower lows. The expected price behavior is a continuation of higher prices.

Hidden Bearish Divergence

Hidden Bearish Divergence

Our final divergence is hidden bearish divergence. Just like hidden bullish divergence, hidden bearish divergence can appear in both uptrends and downtrends but is only valid in an existing downtrend. Hidden bearish divergence is identified when price makes lower highs, and the oscillator makes new higher highs. We should observe a resumption in the prior downtrend when hidden bearish divergence is identified.

Key Points

Regular Bullish Divergence
  • End of a downtrend.
  • Often the second swing low.
  • Price makes new Lower Lows, but the oscillator makes Higher Lows.
  • Trend changes to the upside.
Regular Bearish Divergence
  • End of an uptrend.
  • Often the second swing high.
  • Price makes Higher Highs, but the oscillator makes Lower Highs.
  • Trend changes to the downside.
Hidden Bullish Divergence
  • Valid only during an uptrend.
  • Price makes Higher Lows, but the oscillator makes a Lower Low.
  • The trend should continue to the upside.
Hidden Bearish Divergence
  • Valid only during a downtrend.
  • Price makes Lower Highs, but the oscillator makes Higher Highs.
  • The trend should continue to the downside.

Final words

It may be confusing trying to remember which divergence is which and you’ll find yourself asking questions such as, “do I use highs on this divergence or lows?” It’s easier to think about measuring divergences like this:

All Bullish divergences are going to compare lows to lows – lows in price and lows in an oscillator.

All Bearish divergences are going to compare highs to highs – highs in price and highs in an oscillator.

Categories
Forex Indicators

MACD – Moving Average Convergence Divergence

The MACD

Fig 1- Chart with MACD. Click on it to enlarge

The Moving Average Convergence Divergence (MACD) is probably one of the most popular and well-known oscillator indicators in any market. It is one of our ‘modern’ indicators; created by Gerald Appel in the late 70s. It is essentially a two-part tool that traders can utilize.

  1. Provides a quick look to see the direction and trend of your market using two lines/moving averages: the MACD line and a signal line.
  2. It provides a divergence detection tool using a zero line and histogram.

The MACD line and the Signal Line

The first of these parts of the MACD is probably the one used most often, the MACD line and the signal line. General strategies related to the MACD is that you should consider taking a buy when the MACD line crosses above the signal line and sell when the MACD crosses below the signal line. Additionally, some strategies suggest more conservative entries based on when the MACD crosses the middle line (0-line).

The Histogram

The second part of the MACD, and perhaps the one that confuses many new traders, is the histogram with the 0-line. The histogram shows the difference between the MACD line and the signal line, basically, is showing the ‘gap’ between the two lines, as they grow and diverge away from one another, the histogram expands. However, the real strength of this is the ability to see divergences.

Pros and Cons

The downsides to the MACD indicator is that it is very notorious for causing whipsaws in traders. Whipsaws can be avoided by not using the MACD as your sole indicator of trade signals. The MACD is an excellent tool to help confirm your trades in a trending market, but it is not suitable for a ranging market. If you are a new trader, the MACD is a fantastic tool to help you train and learn about how indicators work. Spend some time watching markets live on smaller time frames and look at how the MACD works and moves with that market. You will notice things you like (i.e., identifying the trend and strength of that trend) and the things you don’t like (i.e., too many signals/crosses on short time frames).

A word of caution

I would caution against using the MACD in your trading. The MACD is an old indicator, and it is most useful as a tool for analysis on daily timeframes or weekly time frames. Because it is so well known and used so much by new traders, it is used against new traders. It is one of those indicators use to entice new traders into using – like bait. Just like moving averages, the MACD has several strategies that involve a crossover. A crossover strategy is simple to understand and easy to learn the strategy and so many new traders try to use this as one of their first strategies – but it doesn’t work. It may seem like it works, but it doesn’t. Again, the MACD is an indicator that is entirely lagging in nature. It is showing what has already happened, not what will happen. It’s most effective use will be a tool for detecting divergences – but even then, there are better indicators and oscillators out there for detecting divergences.