Introduction
Few strategies discussed previously focussed on chart patterns and indicators. Now let us a strategy that is based on two of the most powerful indicators in technical analysis. We already know how to trade using these indicators separately. But using any technical indicator in isolation will not generate a great amount of profit.
Therefore, it becomes necessary to combine at least two indicators and use them in conjunction to produce signals. In today’s article, we not only combine two indicators but also provide a price action edge to it that will make this one of the best strategies of all time. This particular strategy gives traders an insight into both volatility and momentum in the forex market.
The two indicators we will using are Bollinger Band (BB) and MACD. Using the two indicators together can assist traders in taking high probability trades as they gauge the direction and strength of the existing trend, along with volatility. Let us find out the specifications of the strategy and how we imbibe concepts of price action here.
Time Frame
The strategy is designed for trading on longer-term price charts such as the 4 hours and ‘Daily.’ This means the strategy is suitable for the swing to long-term traders.
Indicators
As mentioned earlier, we use Bollinger Band and MACD indicators in the strategy with their default settings.
Currency Pairs
We can apply this strategy to both major and minor currency pairs. However, pairs that are not volatile should be avoided.
Strategy Concept
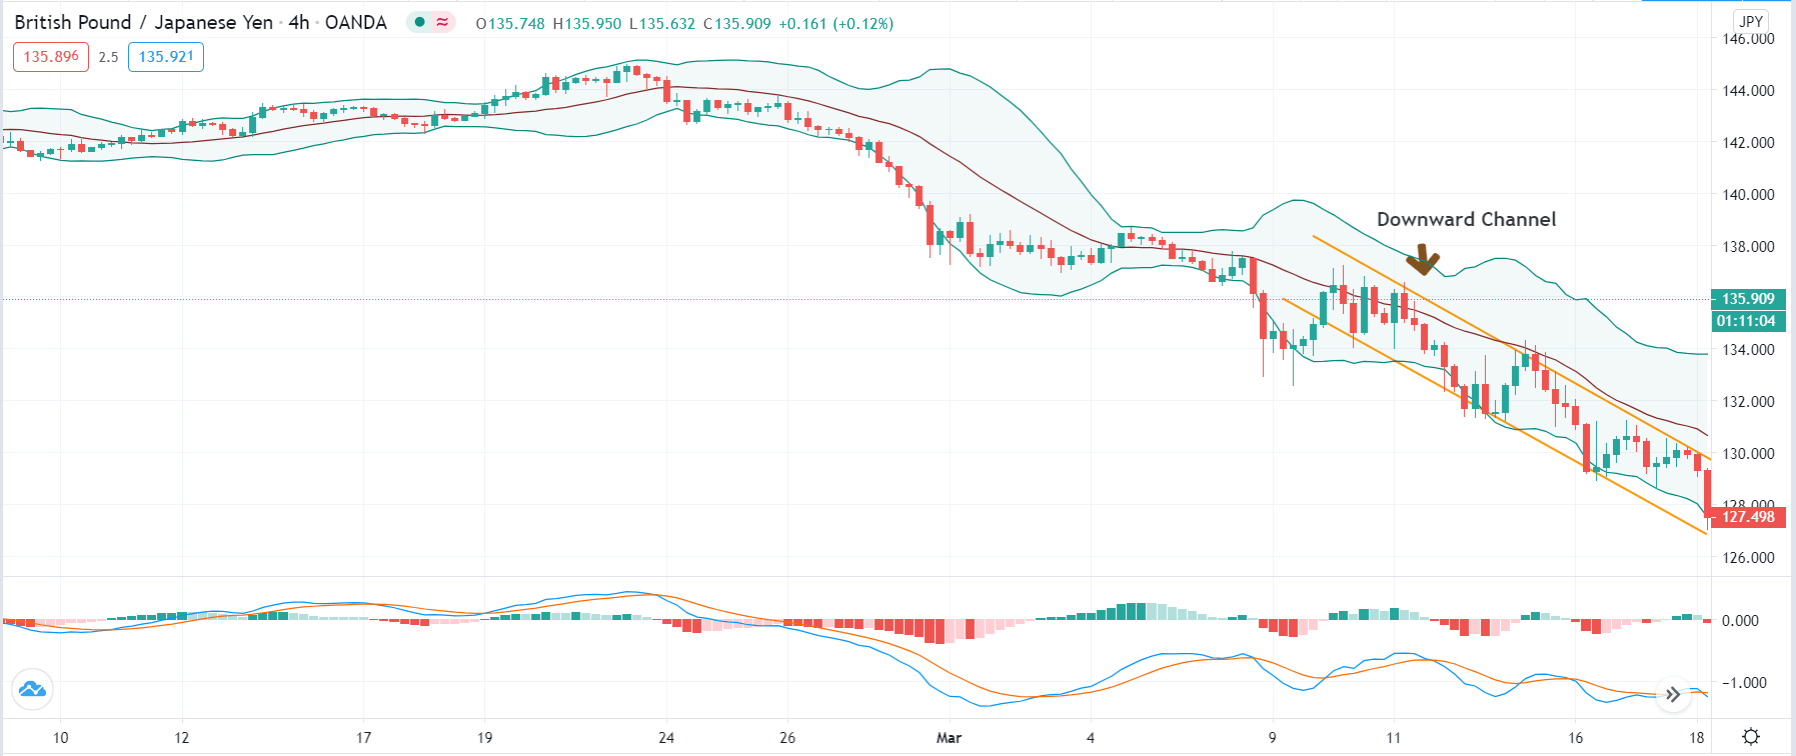
In this strategy, we first identify the trend of the market and see if the price is moving in a channel or not. When looking for a ‘long’ setup, the price must move in a channel below the median line of the Bollinger band. The lesser time price spends above the median line of the Bollinger band better for the strategy.
The reason behind why we chose to have the price below the Bollinger band is to verify that the price is moving into an ‘oversold’ zone. When price moves into the zone of ‘overbought’ or ‘oversold,’ it means a reversal is nearing in the market. Similarly, in a ‘short’ setup, the price should initially move in an upward channel above the median line of the Bollinger band. This indicates that the price is approaching an ‘overbought’ area.
The MACD indicator shows when a true reversal is taking place in the market. The histogram tells about the momentum and strength of the reversal. Depending on the level of the bars, we ascertain the strength of the reversal. Not only is the strength of the reversal important, but also the ’highs’ and ‘lows’ it makes. Once price crosses previous highs and lows, we enter the market at an appropriate ‘test.’ Let us understand in detail about the execution of the strategy.
Trade Setup
In order to execute the strategy, we have considered the 4-hour chart of the GBP/JPY pair, where we will be illustrating a ‘long’ trade. Here are steps to execute the strategy.
Step 1: Firstly, we have to identify the trend of the market. In a ‘long’ trade setup, we need to look for series of ‘lower lows’ and ‘lower highs’ below the median line of the Bollinger band, and in a ‘short’ trade setup, we need to look for series of ‘higher highs’ and ‘higher lows’ above the median line of Bollinger band. When this is confined in the channel, the trend becomes very clear, and reversal can easily be identified.
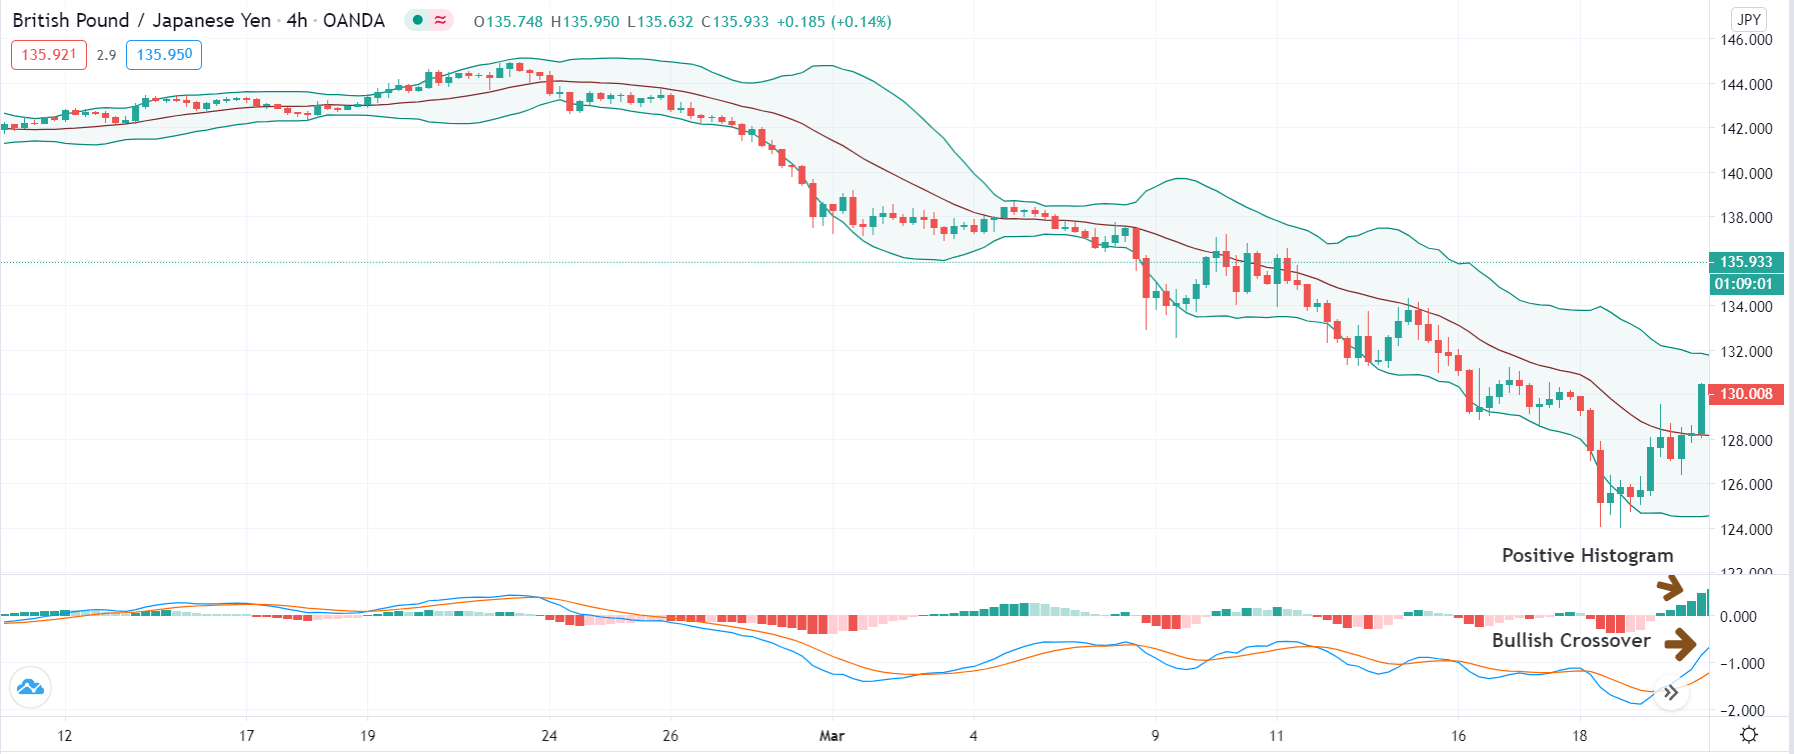
Step 2: We say that an upward reversal has taken place when we notice a bullish crossover in MACD along with a positive histogram. While in an uptrend, we say that a reversal has occurred when we notice a bearish crossover in MACD along with a negative histogram. Once reversal becomes eminent in the market, it is necessary to confirm that the reversal is ‘true,’ and thus, we could take a trade in the direction of the reversal.
The below image shows a downtrend reversal, as indicated by MACD.
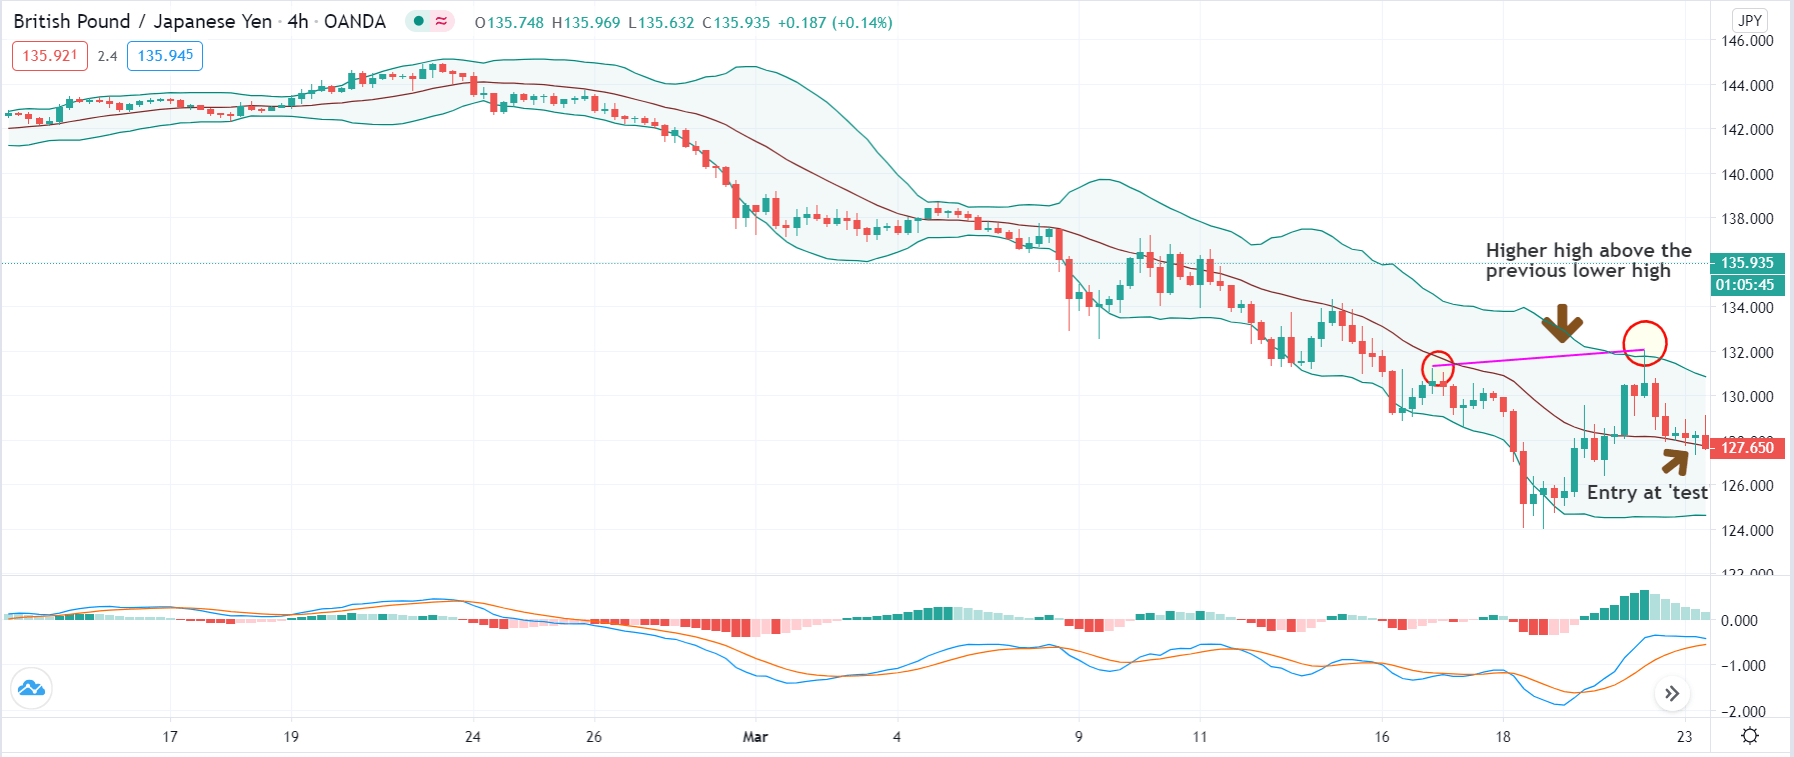
Step 3: In this step, we should make sure that the price makes a ‘high’ that is above the previous ‘lower high,’ in an upward reversal. While in a downward reversal (reversal of an uptrend), the price should make a ‘low’ that is lower than the previous ‘higher low.’ When all these conditions are fulfilled, we can say that the reversal is real, and now we will look to trade the reversal.
We enter the market for a ‘buy’ or ‘sell’ when price ‘tests’ the median line of the Bollinger band after the reversal and stays above (‘buy’) or below (‘sell’).
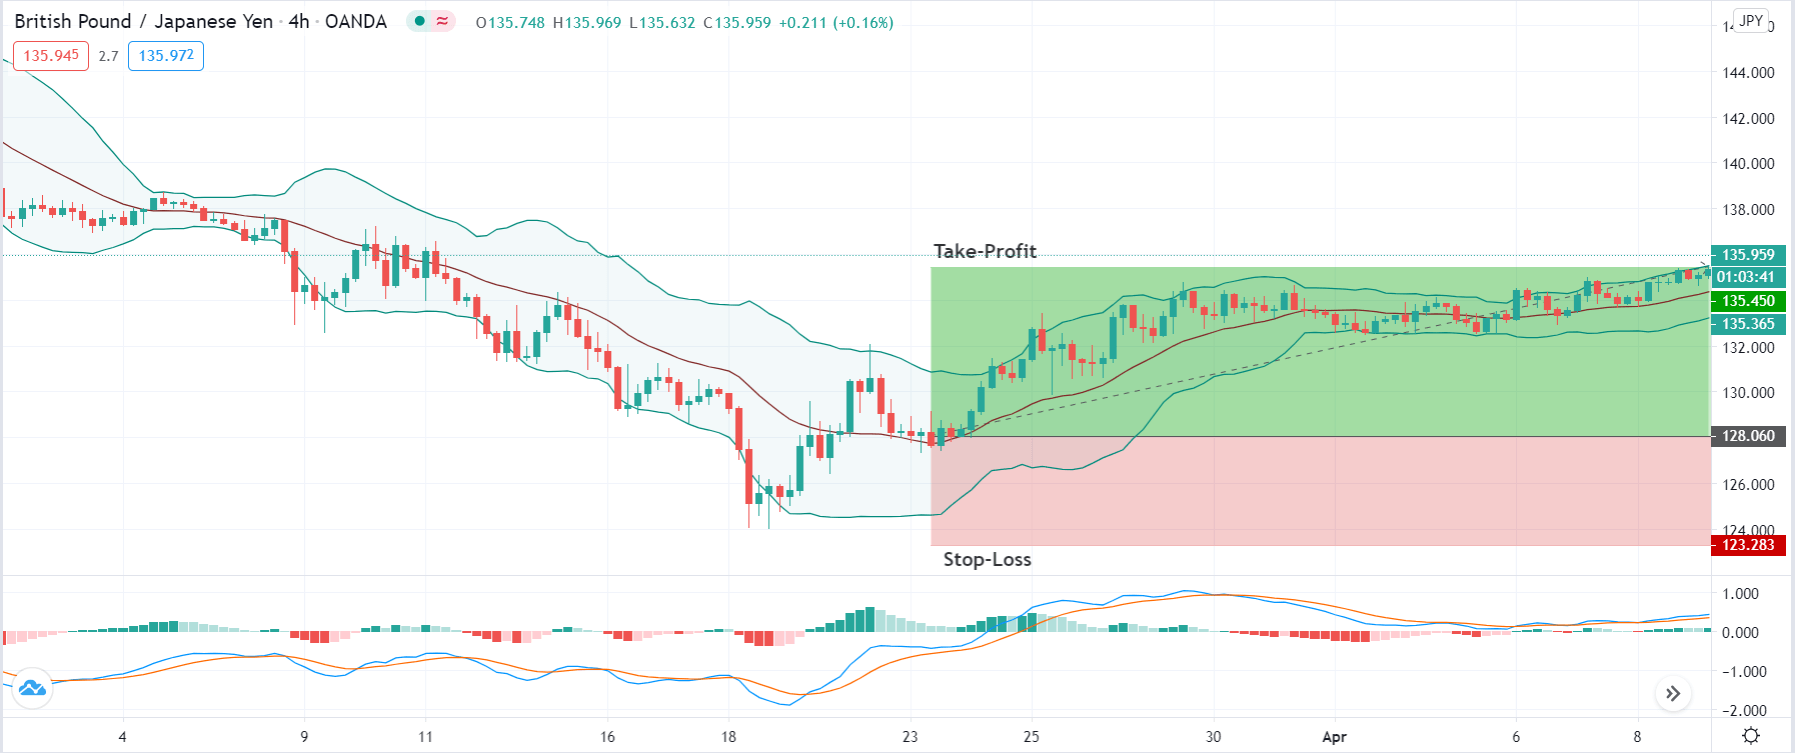
Step 4: Finally, after entering the trade, we need to define appropriate levels of stop-loss and ‘take-profit’ for the trade. The rules of stop-loss are pretty simple, where it will be placed below the lowest point of the downtrend in a ‘long’ position and above the highest point of the uptrend in a ‘short’ position. ‘Take-profit’ will be set such that the risk-to-reward (RR) of the trade is at least 1:1.5. Once the price starts moving in our favor, we will put our stop-loss to break-even and extend our take-profit level.
Strategy Roundup
The combination of the Bollinger band and MACD is not suitable for novice traders. Since it involves complex rules and indicators, we need prior experience of using the indicators and charts before we can apply the strategy successfully. Traders should pay attention to every rule of the strategy to gain the maximum out of it. As there many rules and conditions, there is a tendency among traders to skip some rules, but it is not advisable.


