Introduction
Theoretically, trend trading is easy. All we need to do is keep buying as long as we see the price rising and keep selling as long as we see the price breaking lower. In practice, it is far more difficult to do it. When looking for such opportunities, many questions arise in our minds, such as:
- What is the direction of the market?
- After spotting the trend, how long is the retracement going to last?
- When is the trend going to end?
The greatest fear for traders is getting into a trend too late. That is, when the trend is coming to an end. Despite these difficulties yet, trend trading is considered to be the least risky and most popular styles of trading. When a trend develops, it can last for hours, days, and even months, depending on the time-frame.
Time Frame
The MACD Combo strategy works well on the 1-hour time frame. After gaining enough experience on the 1-hour time frame, we can also try the strategy on lower time frames.
Indicators
In this strategy, we will be using the following indicators
- 50 SMA
- 100 SMA
- MACD with default settings
Currency Pairs
This strategy applies only to major currency pairs. Some of the preferred pairs are EUR/USD, USD.JPY, GBP/USD, GBP/JPY, and few others. We need to make sure that whichever currency pair we are selecting, it should be fairly liquid.
Strategy Concept
The strategy we have developed answers all of the above questions. It also gives us clear entry and exit signals. This strategy is called the MACD combo. We use two forms of moving averages for the strategy: the 50 simple moving average (SMA) and the 100 SMA. The 50 and 100 input of SMA is suitable for trading on the 1-hour time frame chart. The input will change depending on the time-frame we choose to trade.
The 50 SMA provides a signal for entering a trade, while 100 SMA ensures that we are working in a clear trending market. The main idea of the strategy is that we buy or sell only when the prices cross the moving average in the direction of the trend. The basic concept of the strategy may appear similar to the “momo” strategy but is far more patient and uses longer-term moving averages on hourly charts to capture larger profits.
When this strategy is used on the daily (D) time frame wit the same indicator settings, it gives a larger risk to reward. Hence, this strategy is appropriate for long-term investors and swing traders.
Trade Setup
In order to explain the strategy, we have considered the chart of GBP/USD, where we will be using the strategy on the 1-hour time frame. Here are the steps to execute the MACD combo strategy.
Step 1
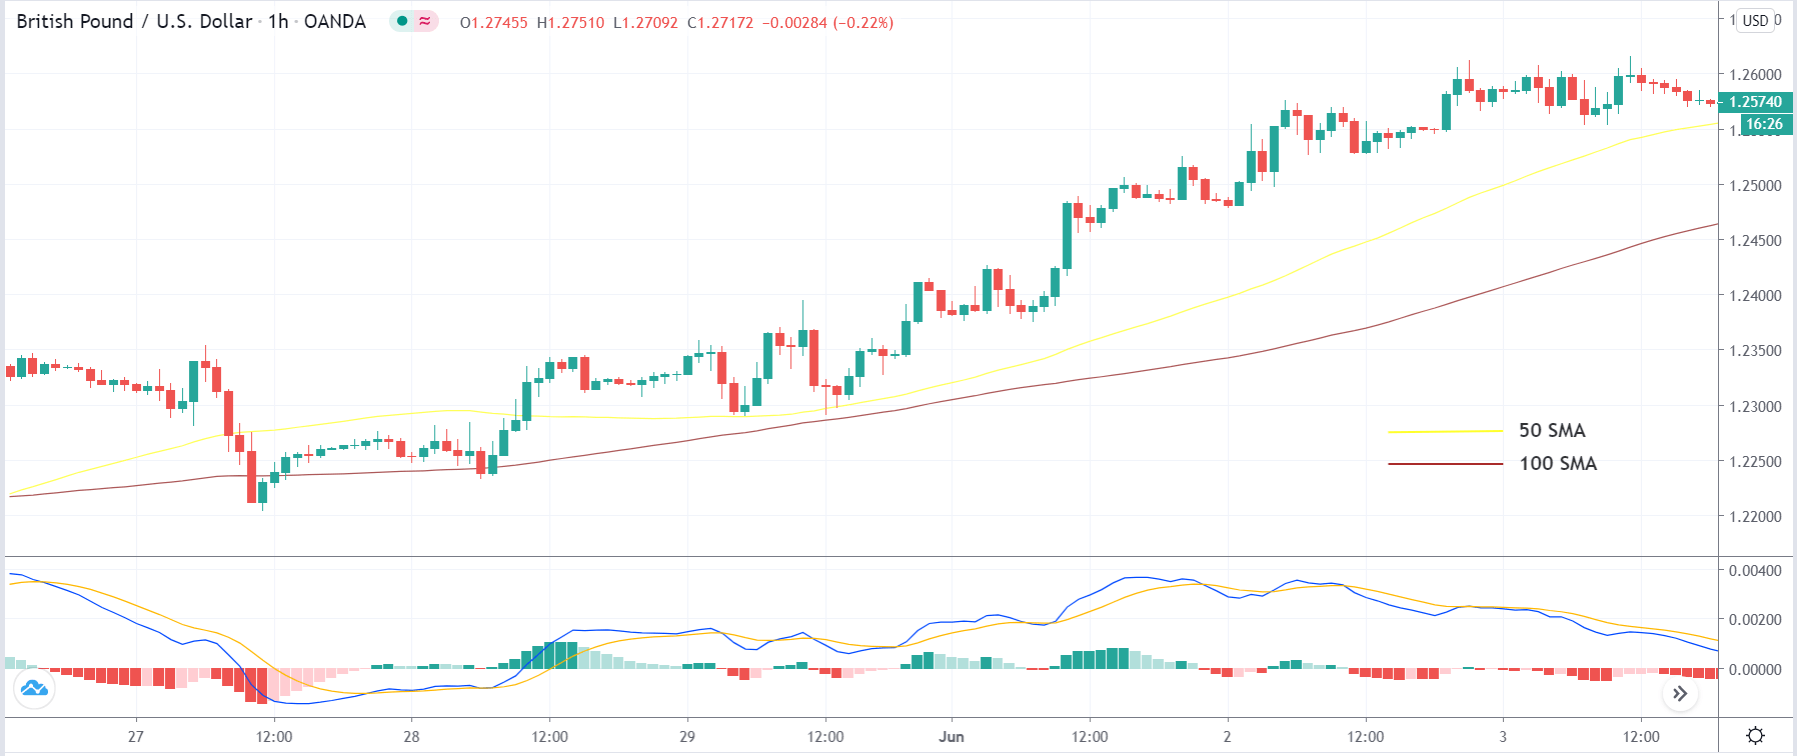
The first step of the strategy is to determine the market direction. This means we need to establish the trend of the market. As this is a trend trading strategy, the market must trend in a single direction before we can apply it. In an uptrend, the price should adequately trade above the 50 SMA and 100 SMA for a long period of time. Similarly, for a downtrend, the price should trade below both the SMAs.
In the below image, we see that the market is in a strong uptrend. Hence, we will look for ‘buy’ opportunities.
Step 2
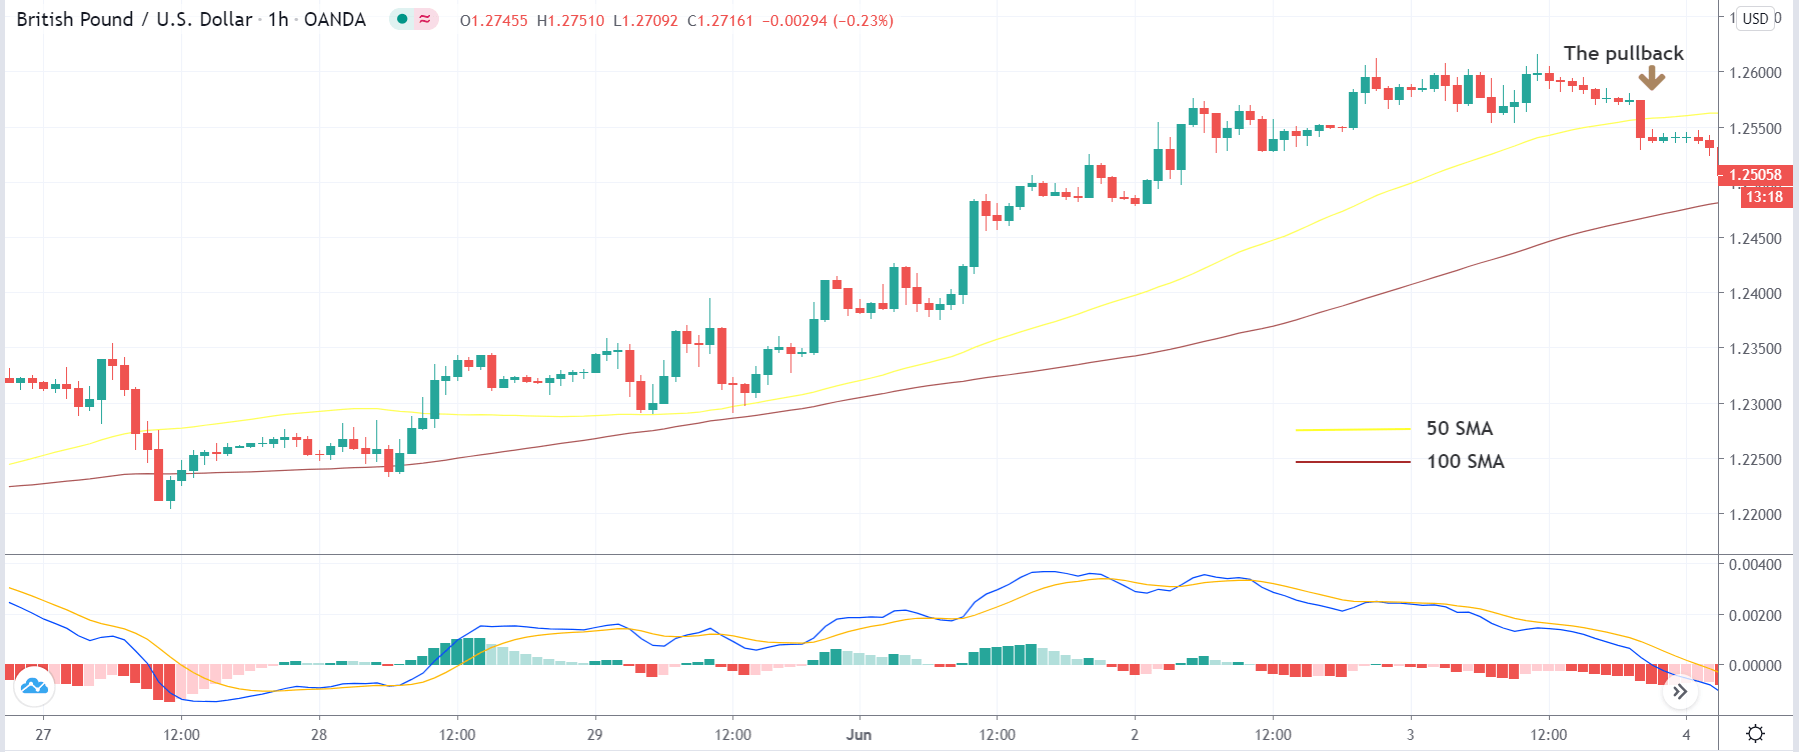
The next step is to wait for a price retracement or a ‘pullback’ to join the trend at this discounted price. We say that the pullback is valid if the price crosses the closest SMA and stays below that SMA at least for a period of4-5 candles. But we need to make sure that the price does not cross below the next SMA. If that happens, the trend gets invalidated, and it may signal a reversal of the trend.
The below image shows that the pullback has crossed the first SMA (50 Period) and has stayed there for more than 5 hours.
Step 3
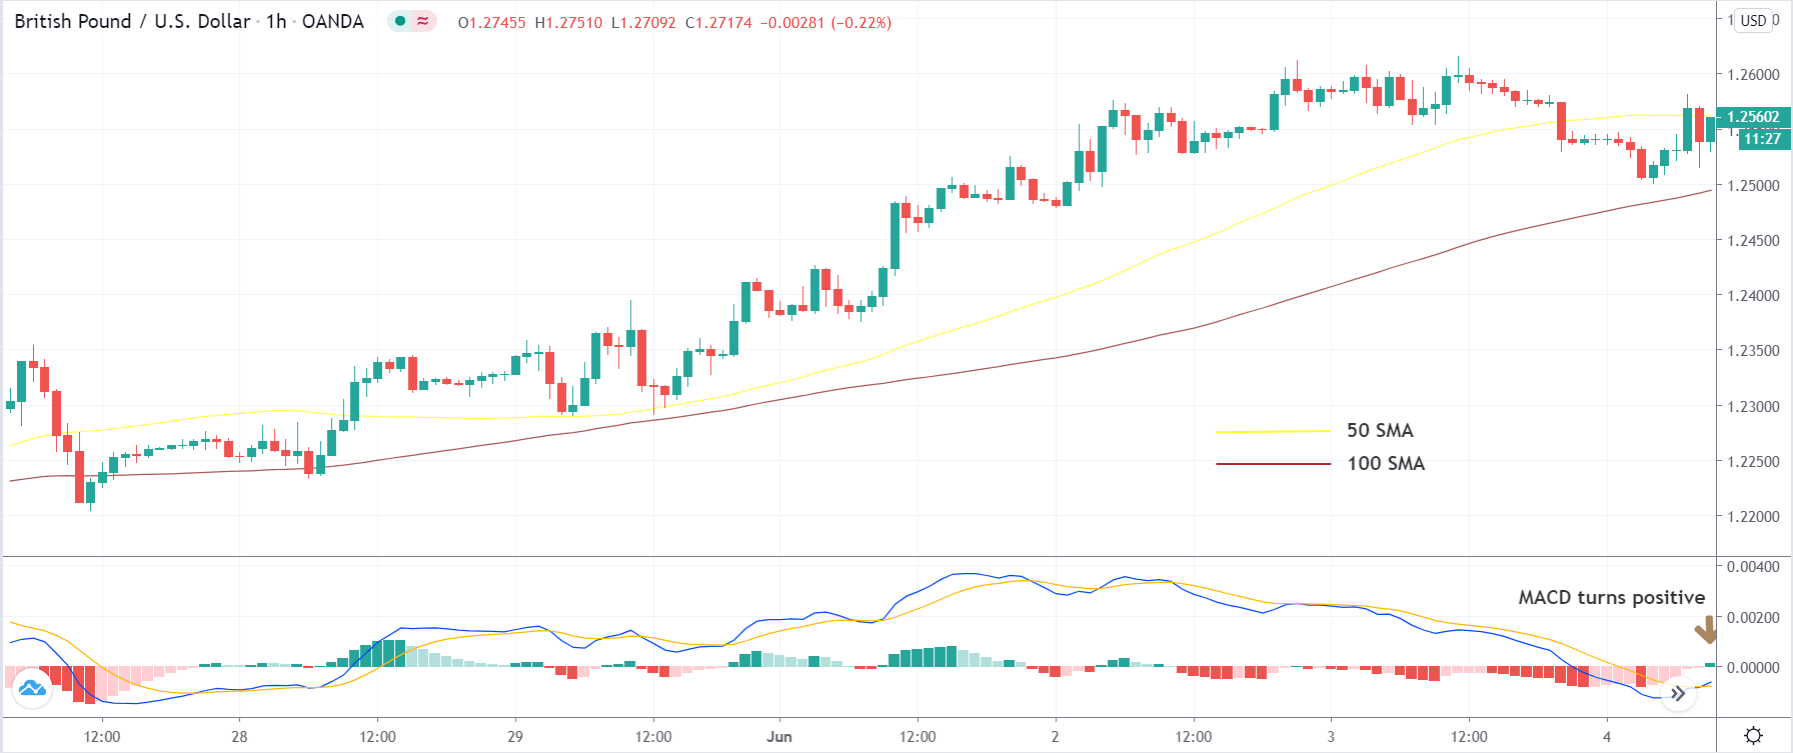
In this step, we will use the MACD indicator to enter the market. In case of an uptrend, we enter the market for a ‘buy’ as soon as the MACD indicator turns positive. Similarly, in a downtrend, we enter the market for a ‘sell’ when the MACD indicator turns negative. A conservative trader may enter the market after it moves above the SMA.
We can see in the below image that we are going ‘long’ soon after the MACD shows up a green bar. This is an aggressive form of ‘entry’ which requires experience to be able to spot them.
Step 4
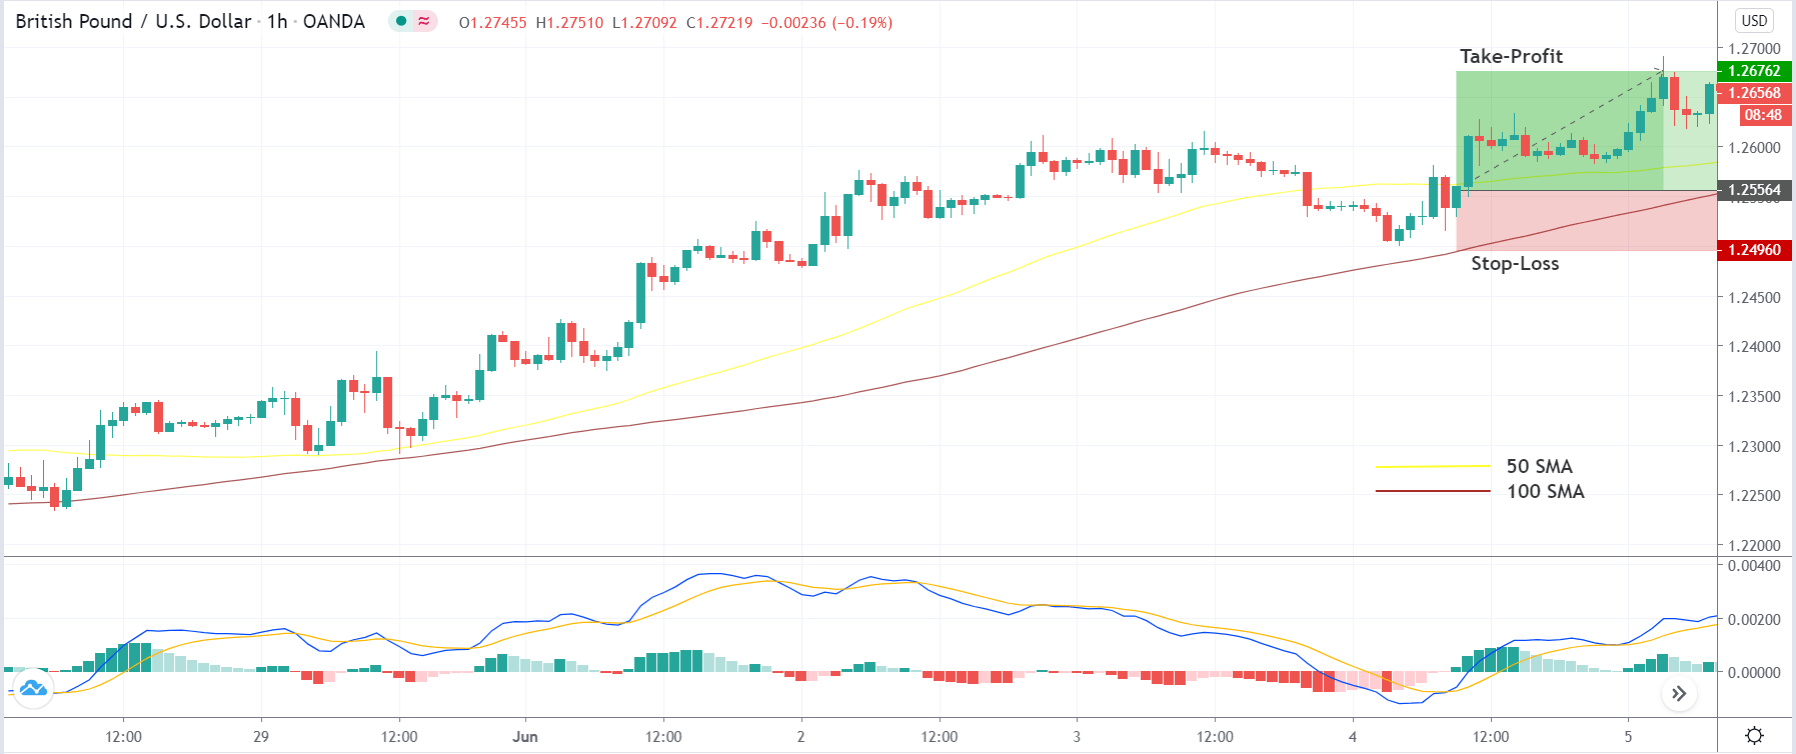
In this step, we determine the stop-loss and take-profit for the strategy. Stop-loss is placed below the swing ‘low’ in case of a ‘long’ trade and above the swing’ high’ in case of a ‘short’ trade. Since we are trading with the trend, we will take our profits at the new ‘higher high‘ or ‘lower low’ depending on the momentum of the market. This is the reason behind high risk to reward of trades done using this strategy.
In this case, the risk to reward of the trade is 1:2, which is above the normal range.
Strategy Roundup
Traders implementing the MACD combo strategy should make sure that they only apply the strategy on currency pairs that are typically trending. Also, it is smart to check the crossover’s strength below or above the first moving average. We can also make use of the ADX indicator to check the momentum of the pullback. It is important to check the momentum of the trend and the pullback when trend trading.