Categories
Forex Basic Strategies Forex Daily Topic

Trading The Forex Market Like A Pro Using The Williams %R Indicator

Introduction

In the forex market, the Relative Strength Index (RSI) is the most sought after technical indicator for measuring overbought and oversold conditions in the market. However, there are times when RSI can give misleading signals. To overcome some of these limitations of RSI, we use William’s %R (Williams Percentage Range) to help us identify when an asset is oversold or overbought.

Having determined that the asset has moved too much in one direction, we can position ourselves on the other side of the market after suitable confirmation. In today’s article, let’s discuss a strategy based on William’s %R indicator to identify when the market has become overbought or oversold. Let us first get into the specifications of the strategy.

Time Frame

The strategy works well on higher time frames such as ‘Weekly’ and ‘Daily.’ Therefore, the strategy is suitable for swing and long-term traders.

Indicators

We use the following indicators in the strategy:

  • William’s %R
  • Simple Moving Average (standard setting)

Currency Pairs

The strategy applies to all currency pairs listed on the broker’s platform, including major, minor, and exotic pairs. This is one of the distinguishing features of the strategy.

Strategy Concept

The William’s %R indicator usually ranges between 0 to -100, where a reading of 0 to -20 tells us that the asset is overbought. On the other hand, if %R falls in the range of -80 and -100, the asset is said to be oversold. As with other technical indicators, %R generates accurate trading signals when used in conjunction with other analytical tools such as chart patterns and systems.

Just because an asset may appear overbought and oversold based on the %R, this doesn’t necessarily mean that the price will reverse. Hence, we include a few concepts of the chart pattern and price action to confirm that the reversal is real. The more we wait, the higher the confirmation. But this reduces the risk-to-reward (RR) ratio moderately. This depends more on the type of trader if he is more conservative or aggressive.

In the strategy, we firstly establish a trend that is mostly in the overbought or oversold situation. This means William’s %R should indicate an overbought situation of the market for a major part of the trend during an uptrend. On the other hand, in a downtrend, William’s %R should indicate an oversold market situation for a major part of the trend. When the trend remains in the overbought or oversold condition for most of the time, the reversal tends to be sharp in nature.

This is why the above condition is important for the strategy. Next, we wait for the ‘Bullish Engulfing’ pattern to appear on the price chart, in a reversal of a downtrend. Likewise, in a reversal of an uptrend, we wait for the ‘Bearish Engulfing’ pattern to appear on the chart. This is the first sign of reversal. The reversal is confirmed when the price starts moving above the moving average, in a downtrend, and below the moving average, in an uptrend.

Stop-loss for the trade will be placed below the ‘engulfing’ pattern in a ‘long’ position and above the ‘engulfing’ pattern in a ‘short’ position.

Trade Setup

In order to explain the strategy, we will be executing a ‘long’ trade in EUR/USD currency pair using the below-mentioned rules. Here are the steps to execute the strategy.

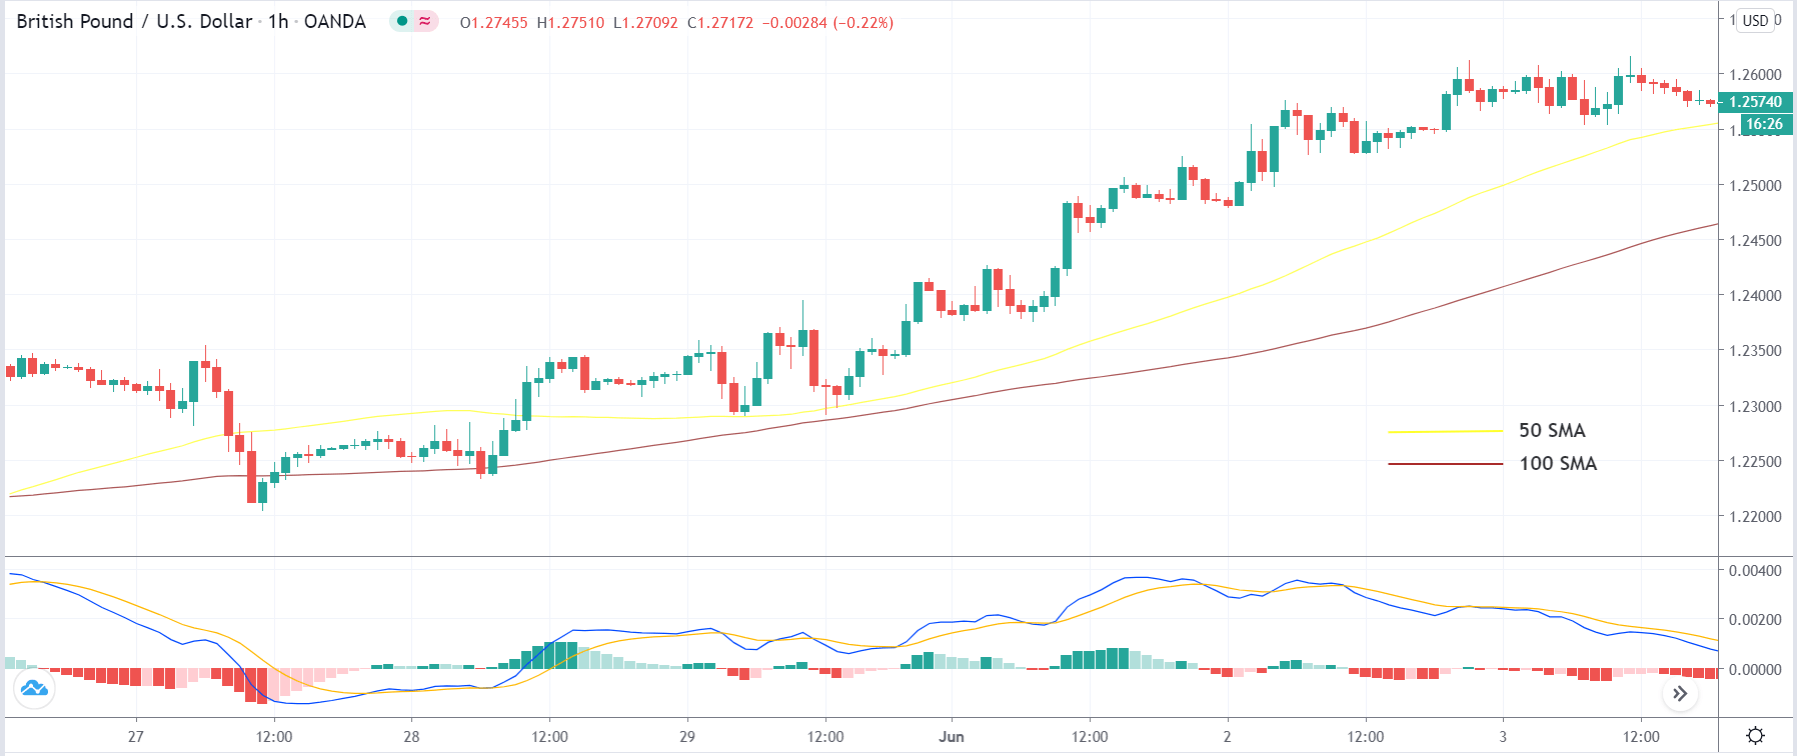
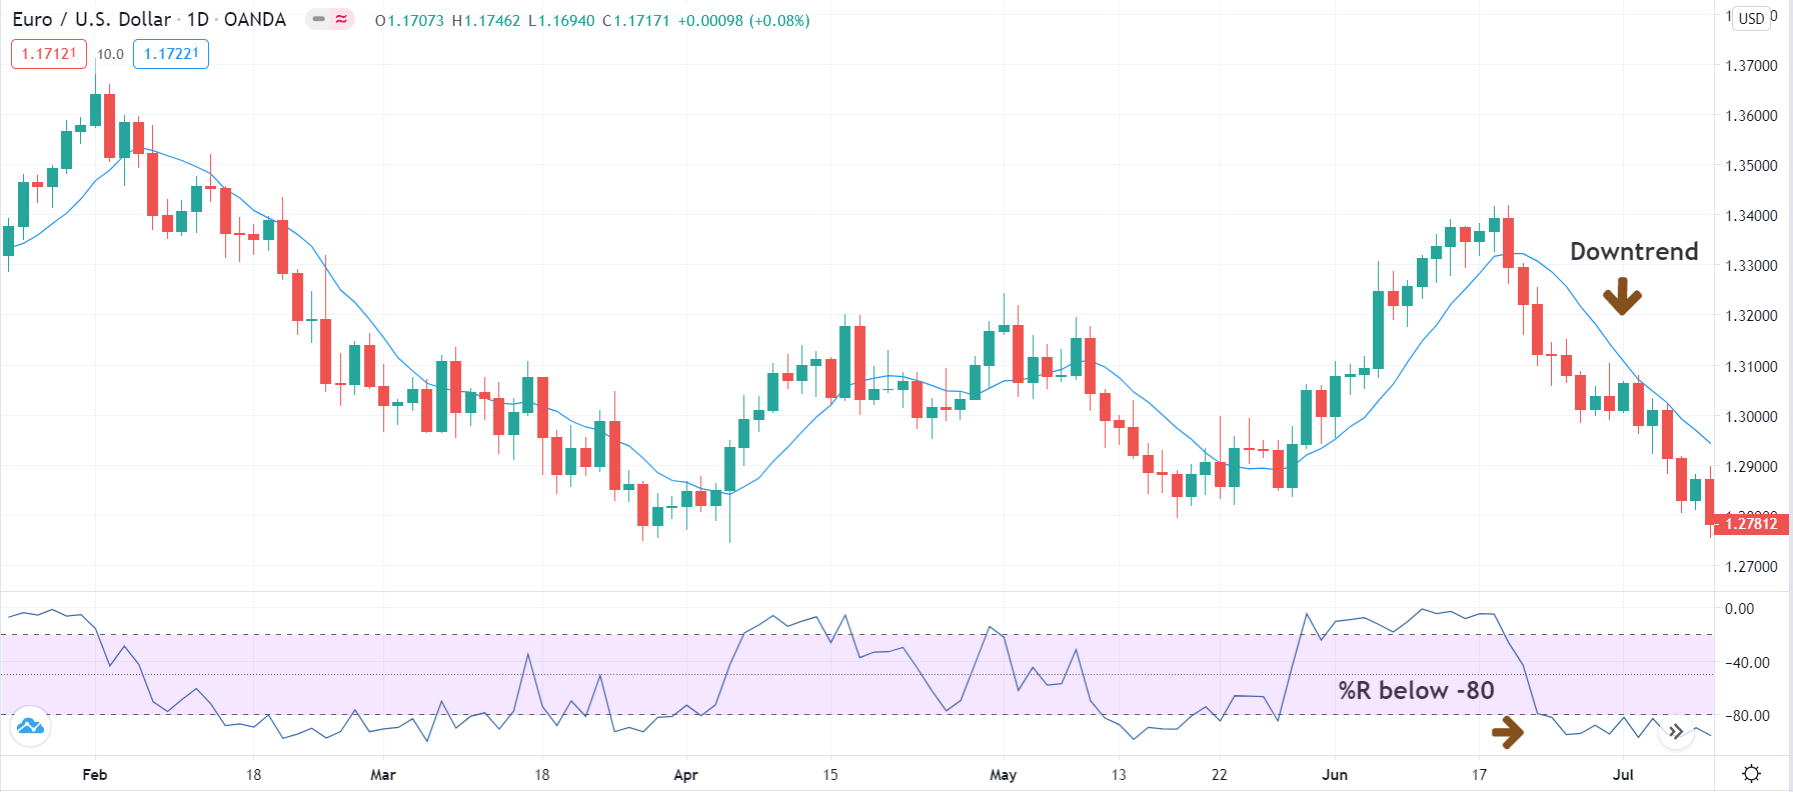
Step 1: The first step of the strategy is to identify the major trend of the trend. An easy to determine trend is if the price is below the simple moving average, the market is in a downtrend, and if the price is above the simple moving average, the market is in an uptrend. Here we need to make sure that William’s %R indicates an overbought/oversold market situation for the major part of the trend.

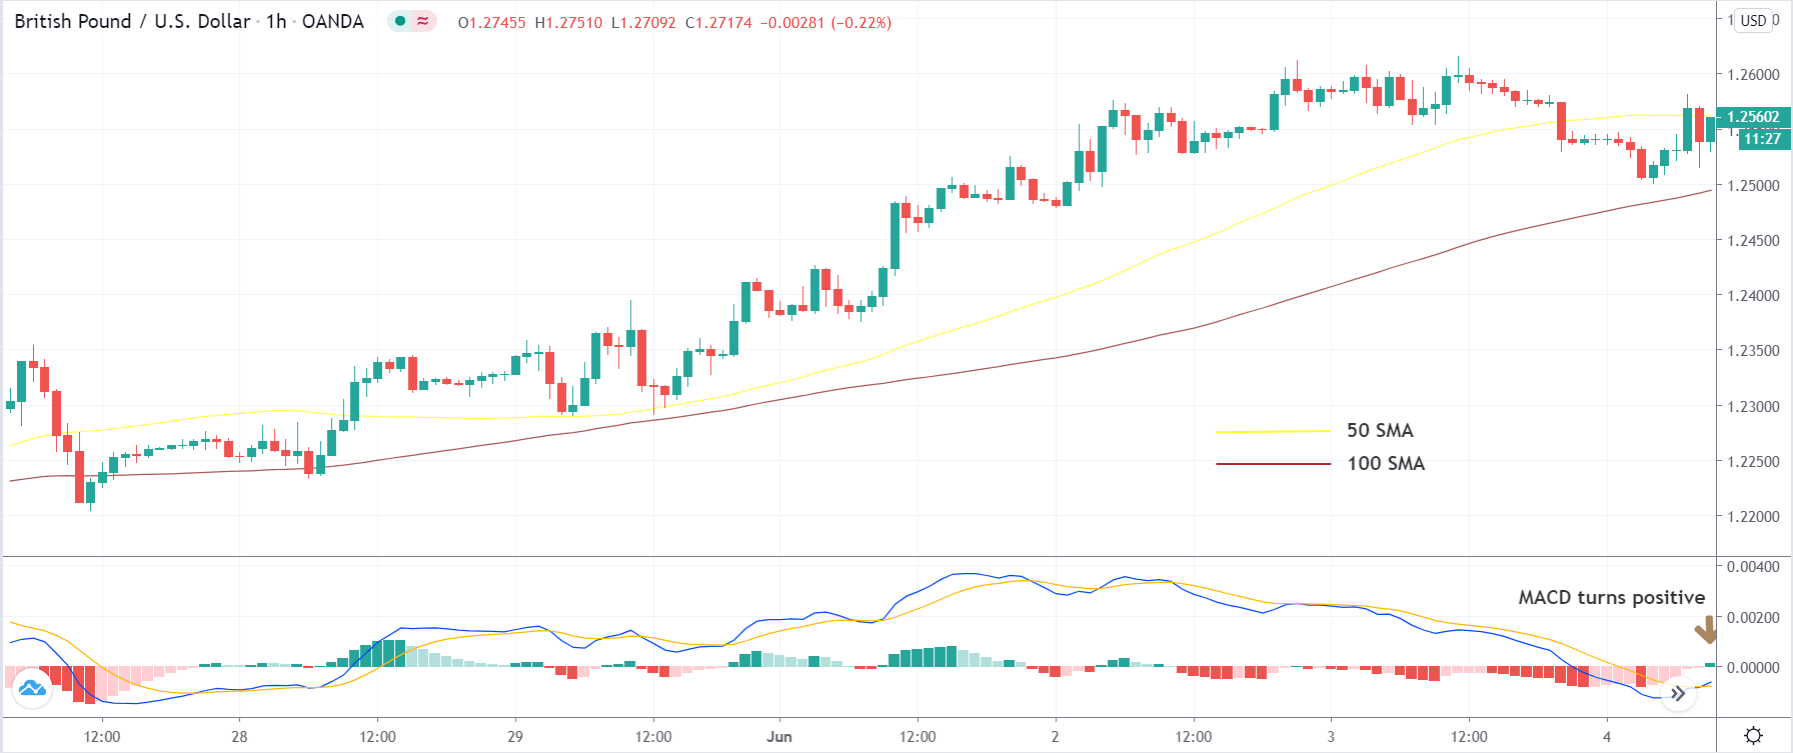
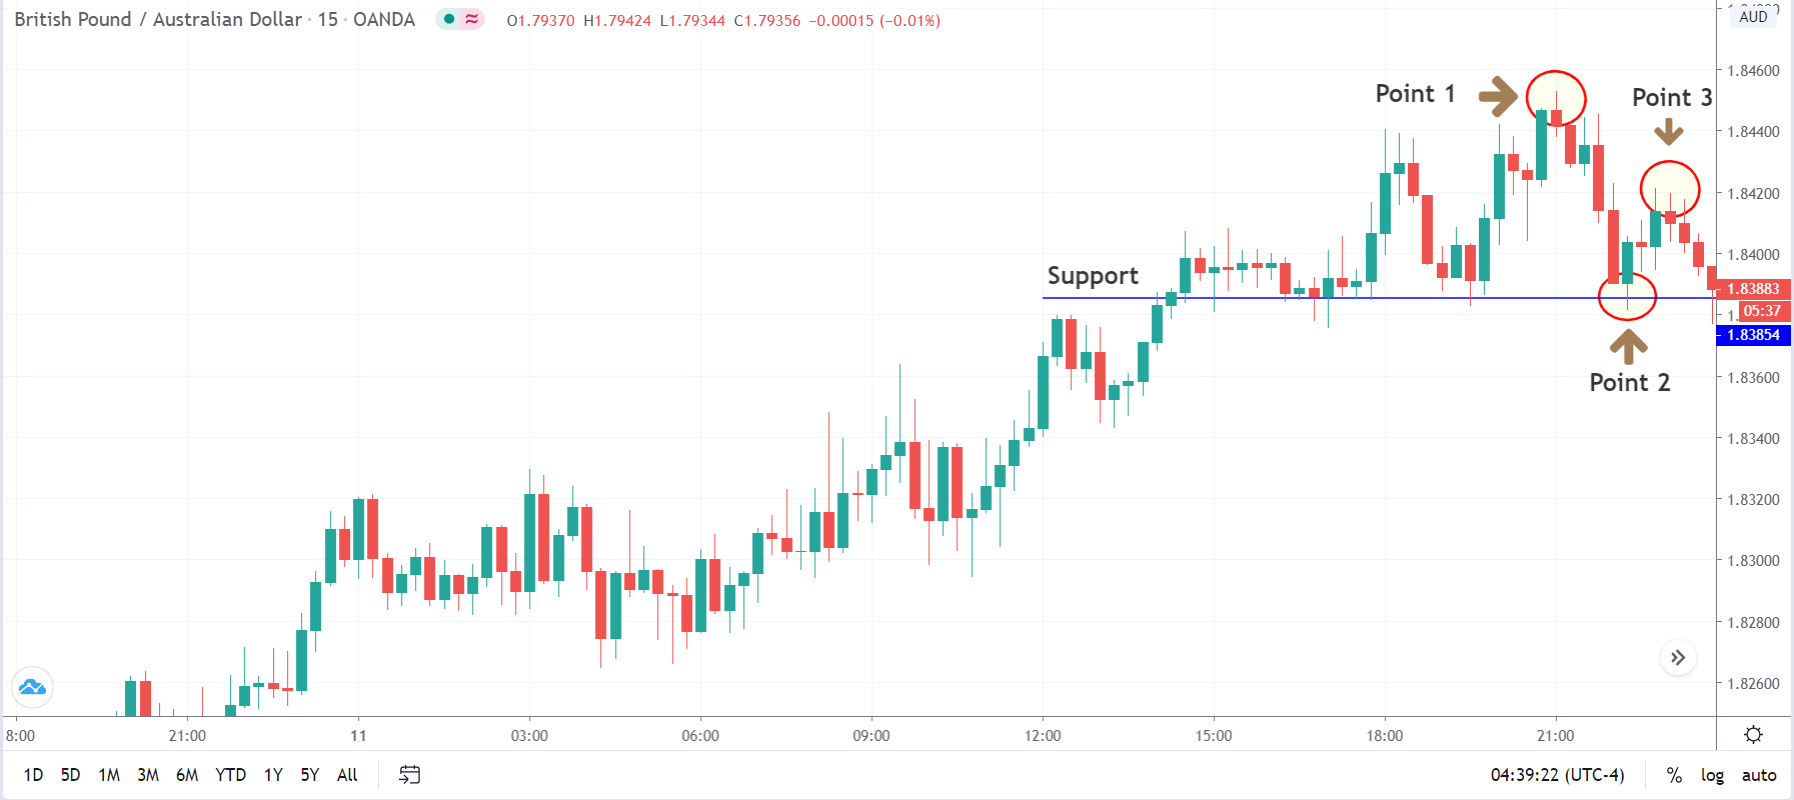
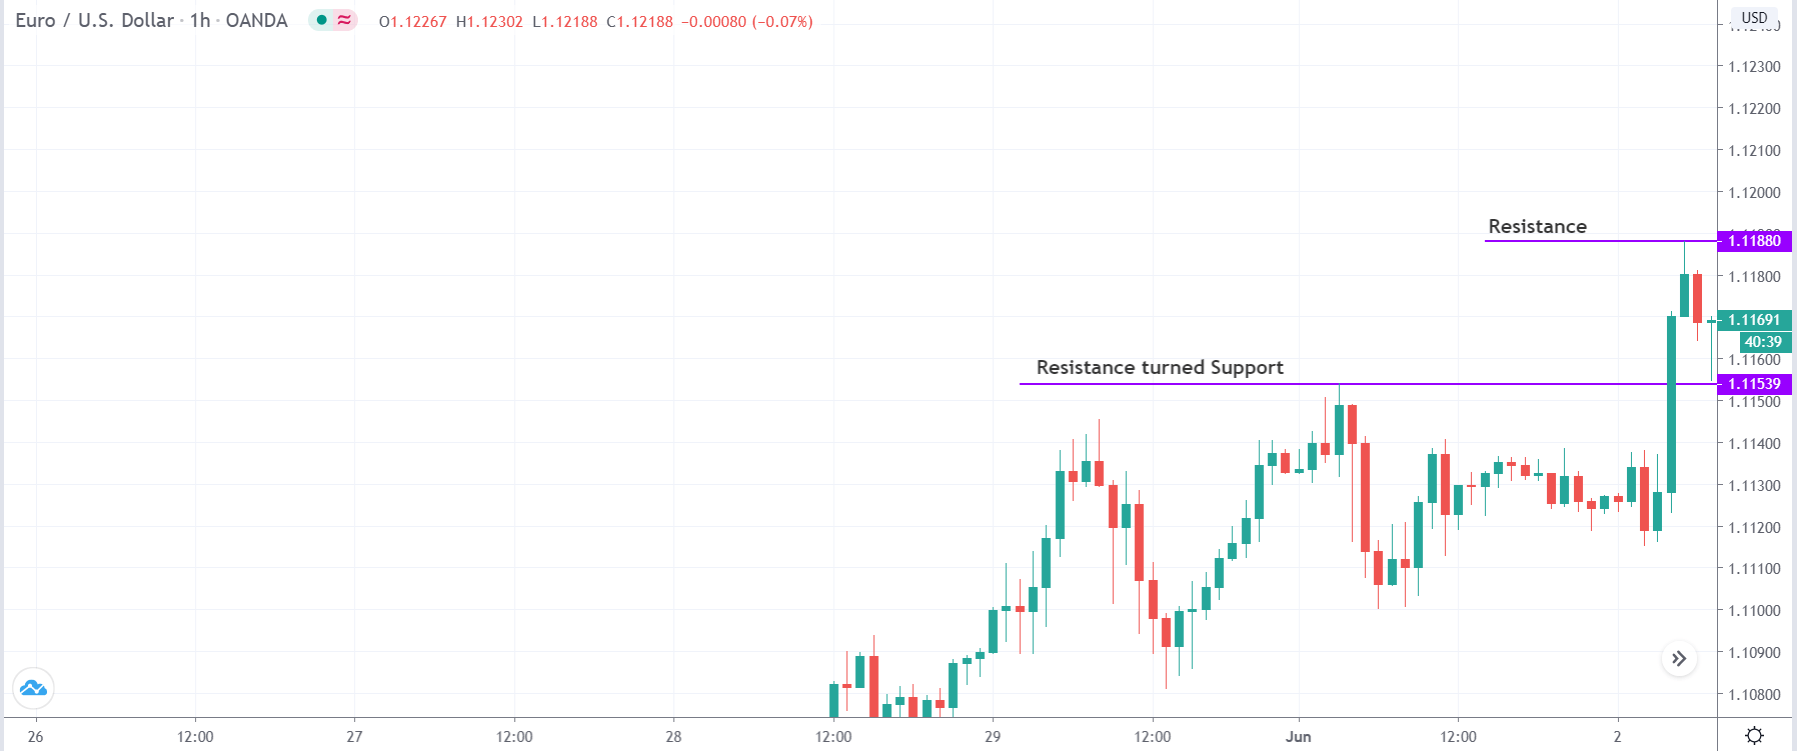
The below image shows an example of a downtrend that is oversold.

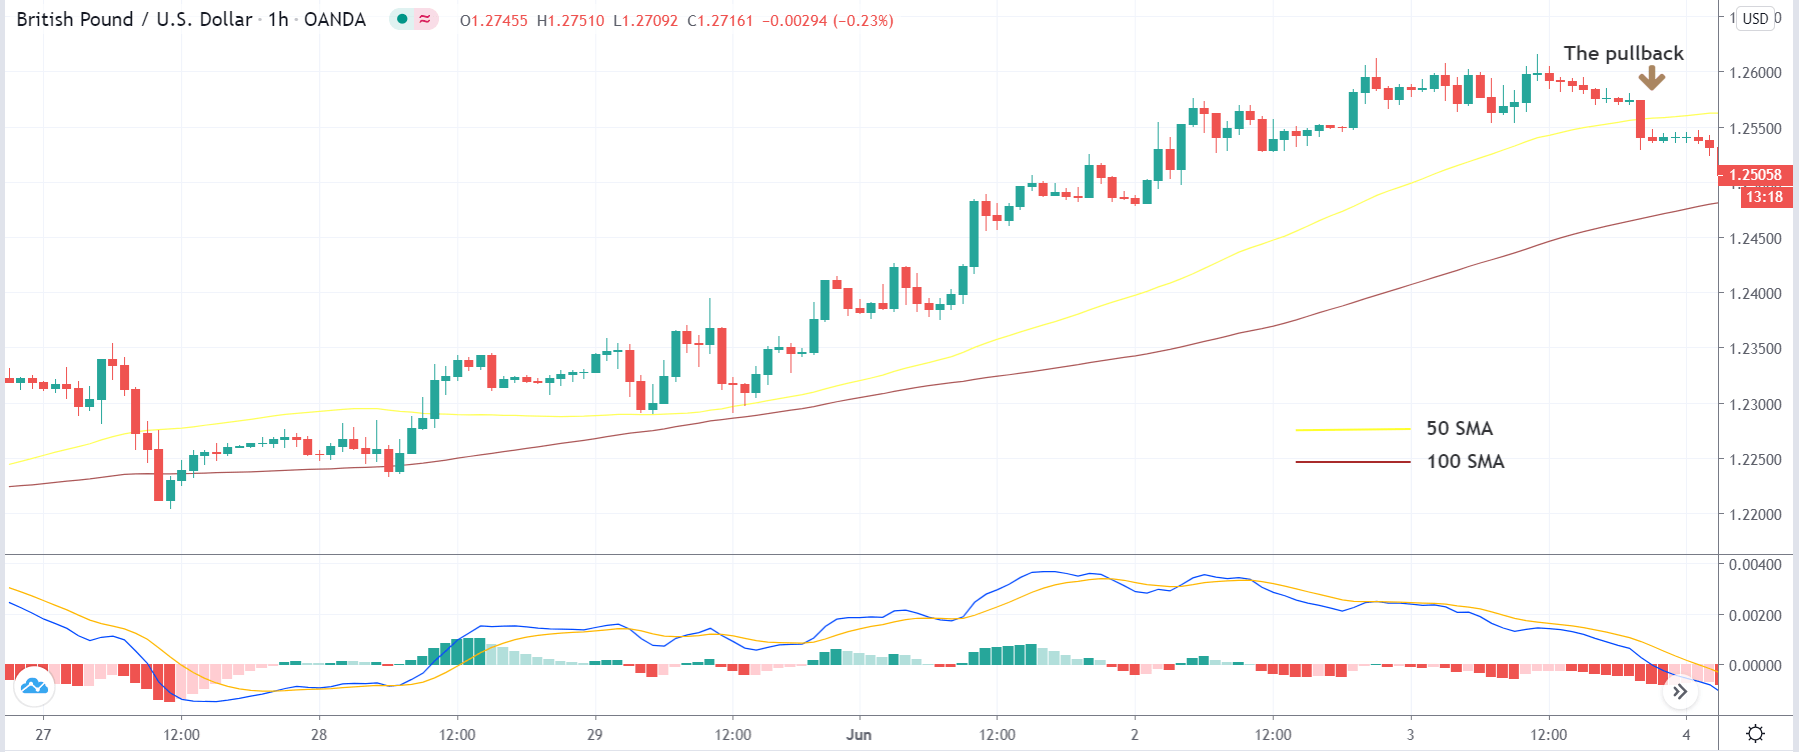
Step 2: The next step is to wait for the market to present the ‘Engulfing’ pattern on the chart. In a downtrend, the ‘Bullish Engulfing’ pattern indicates a reversal of the trend, while in an uptrend, the ‘Bearish Engulfing’ pattern indicates a reversal of the trend. If the second of the engulfing pattern closes above the MA in a reversal of the downtrend, the reversal will be more prominent. Similarly, if the second candle closes below the MA in a reversal of the uptrend, the reversal can be resilient.

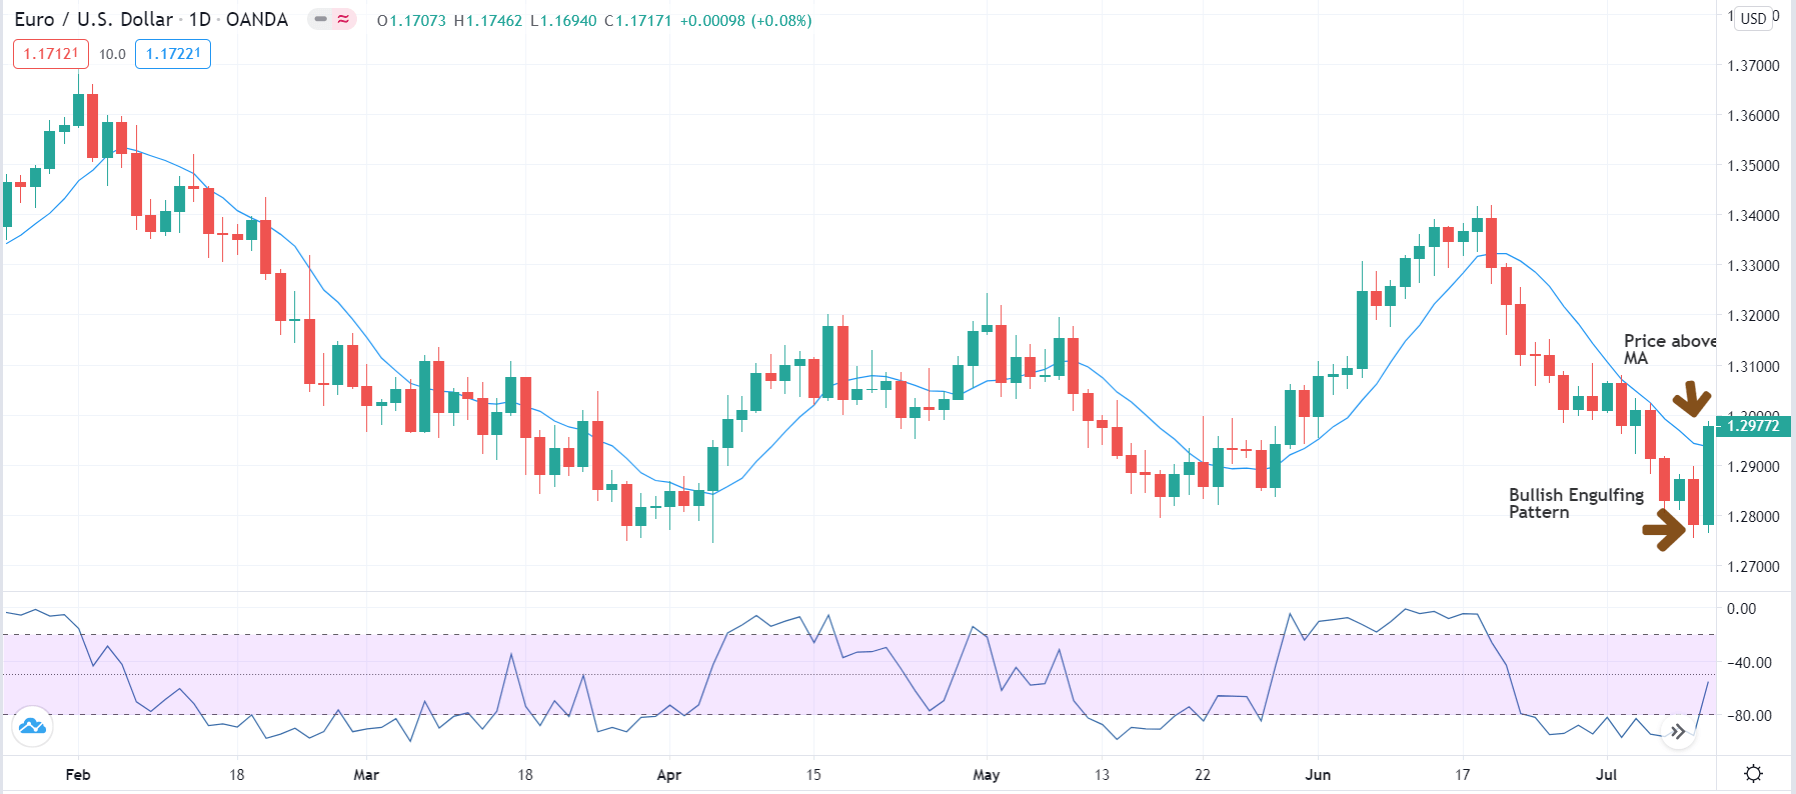
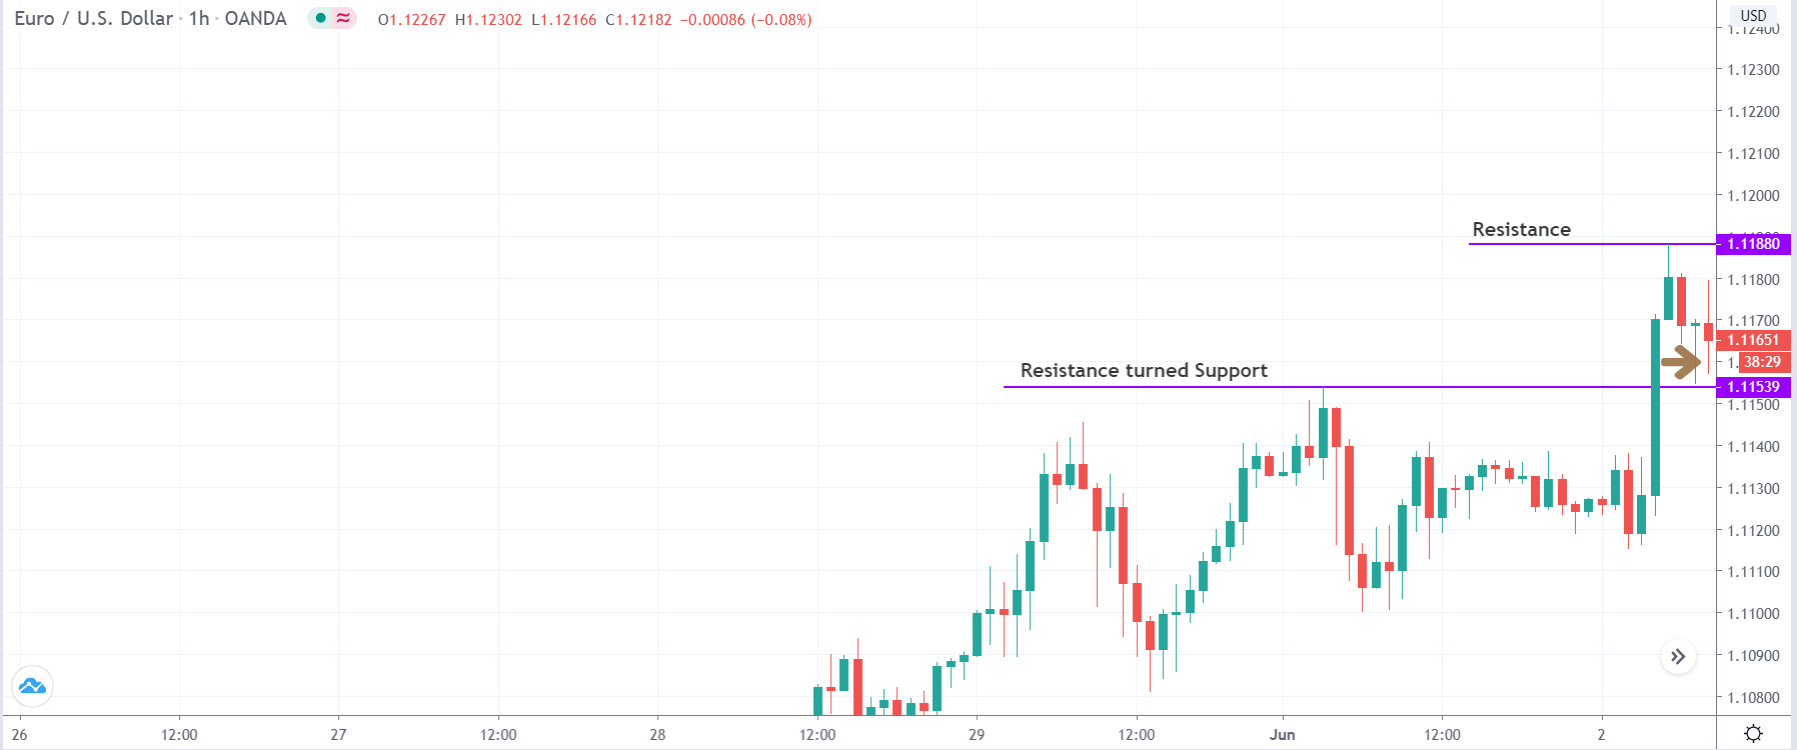
Step 3: The rule of entering the trade is fairly simple. We enter ‘long’ when the price starts moving further above the moving average after the occurrence of an ‘engulfing’ pattern. Similarly, we enter ‘short’ when the price starts moving further below the moving average after the occurrence of the ‘engulfing’ pattern.

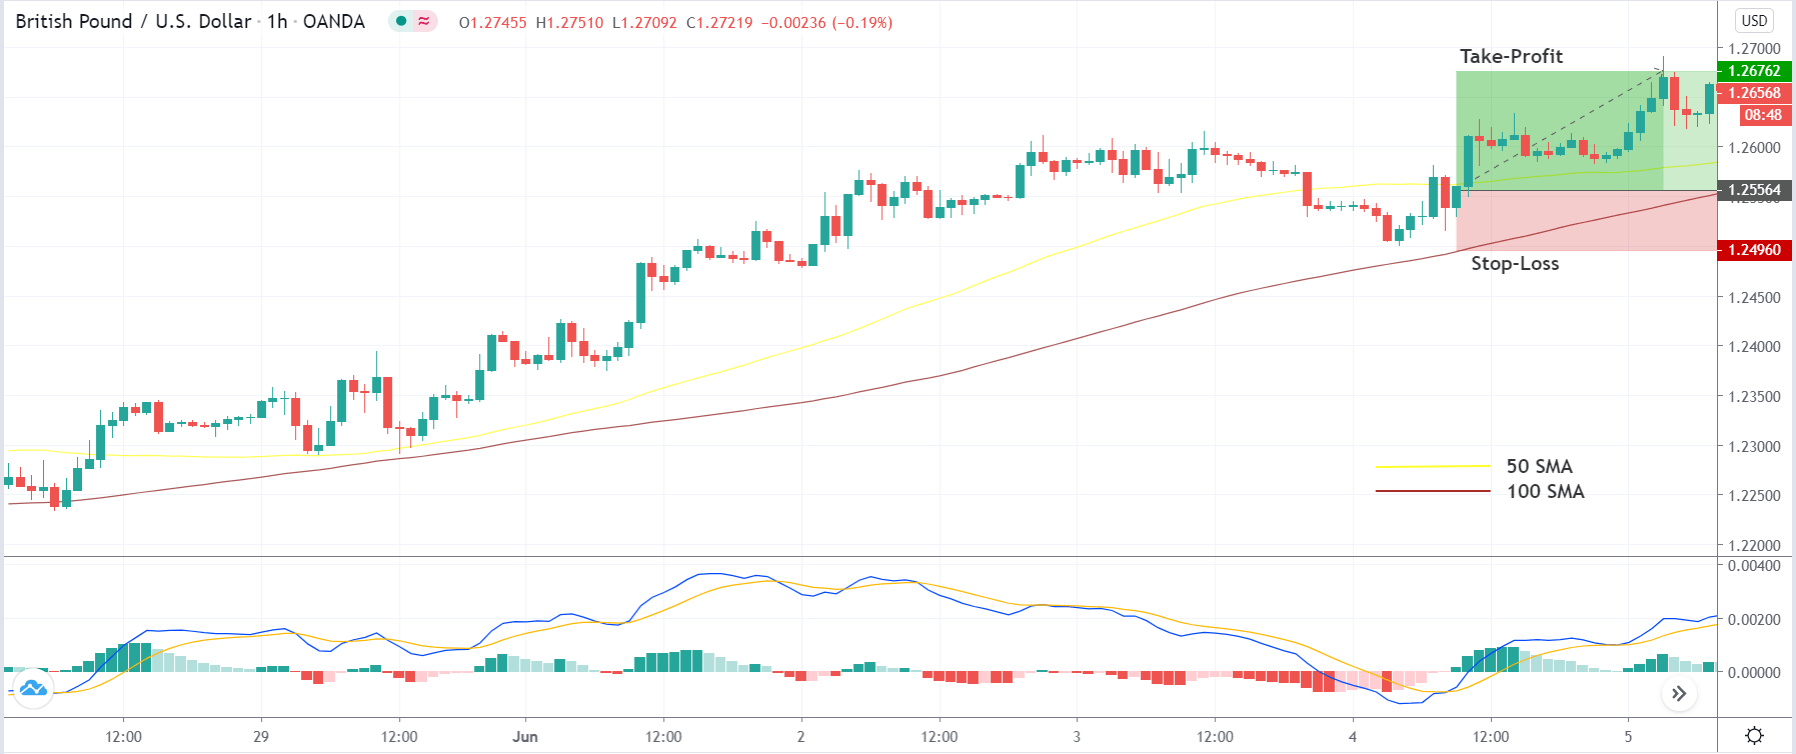
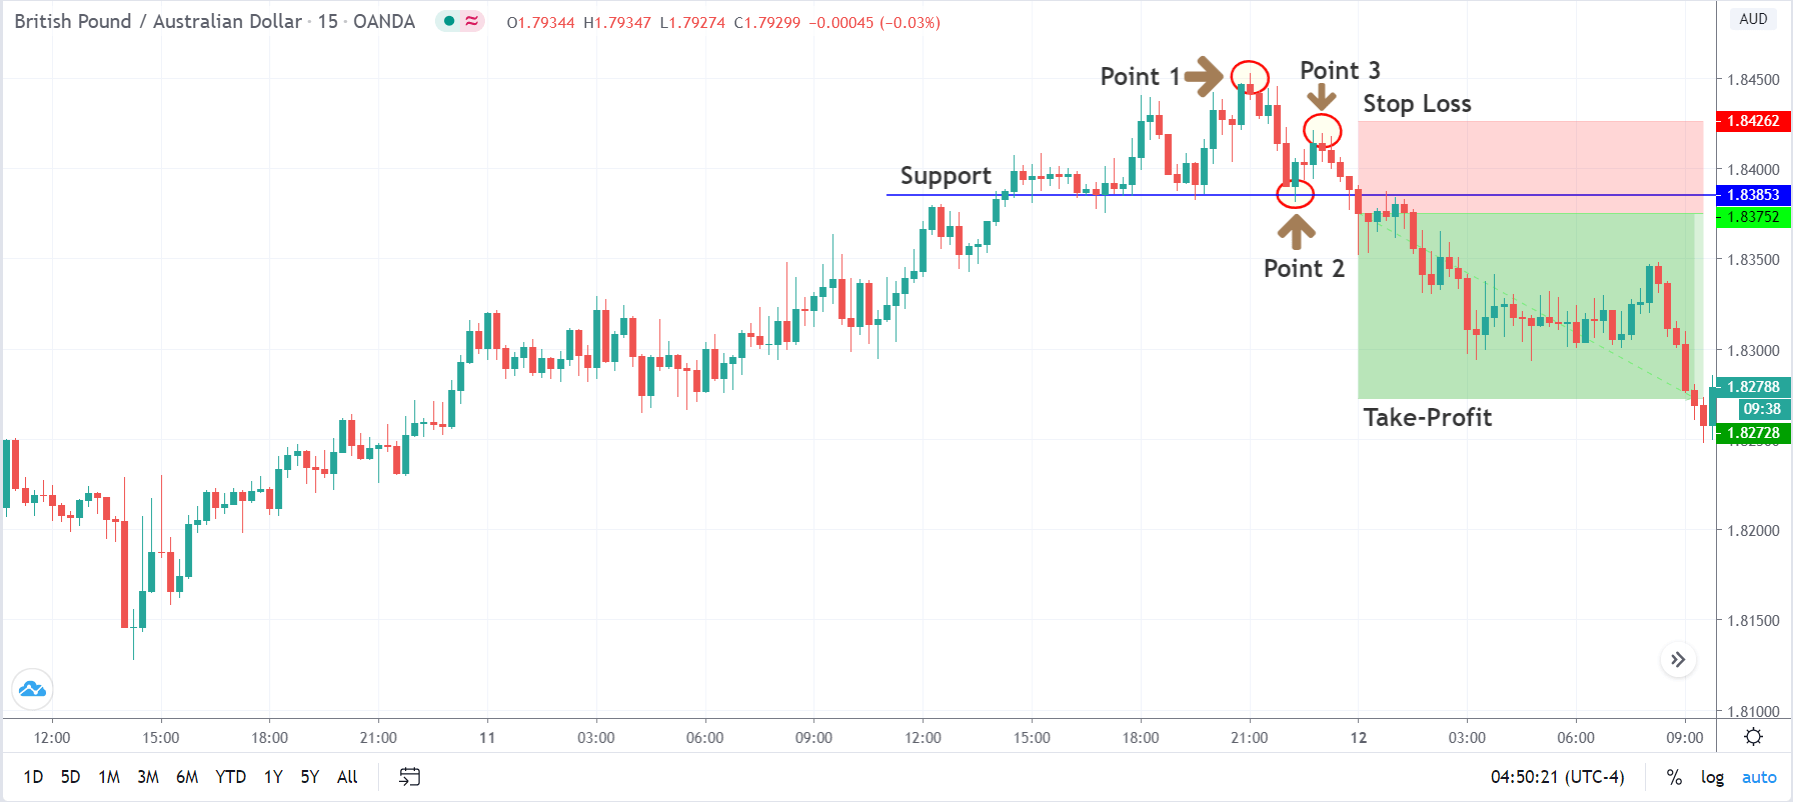
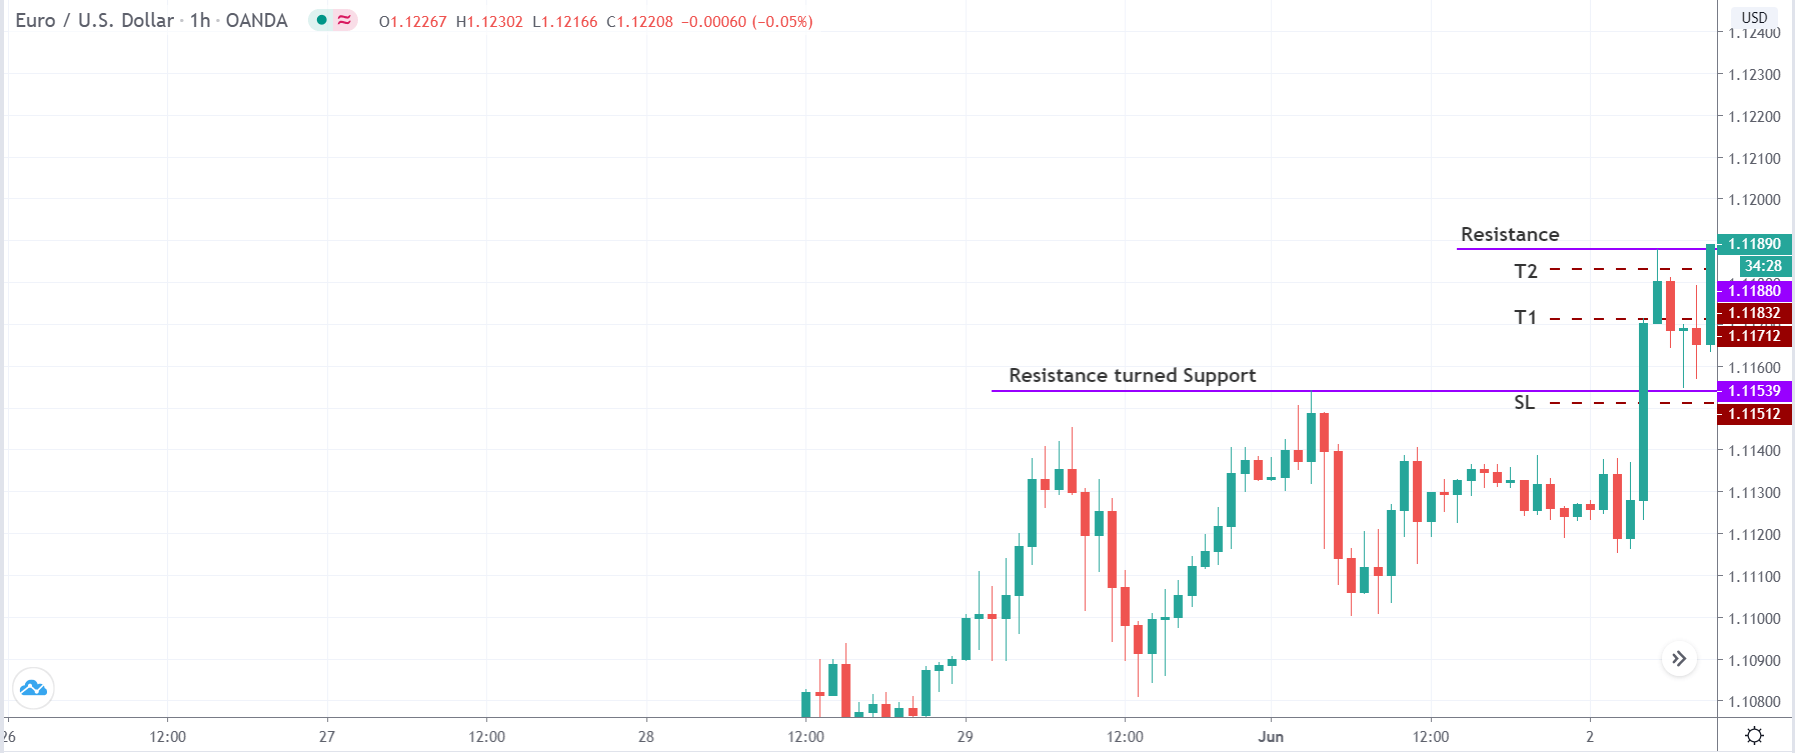
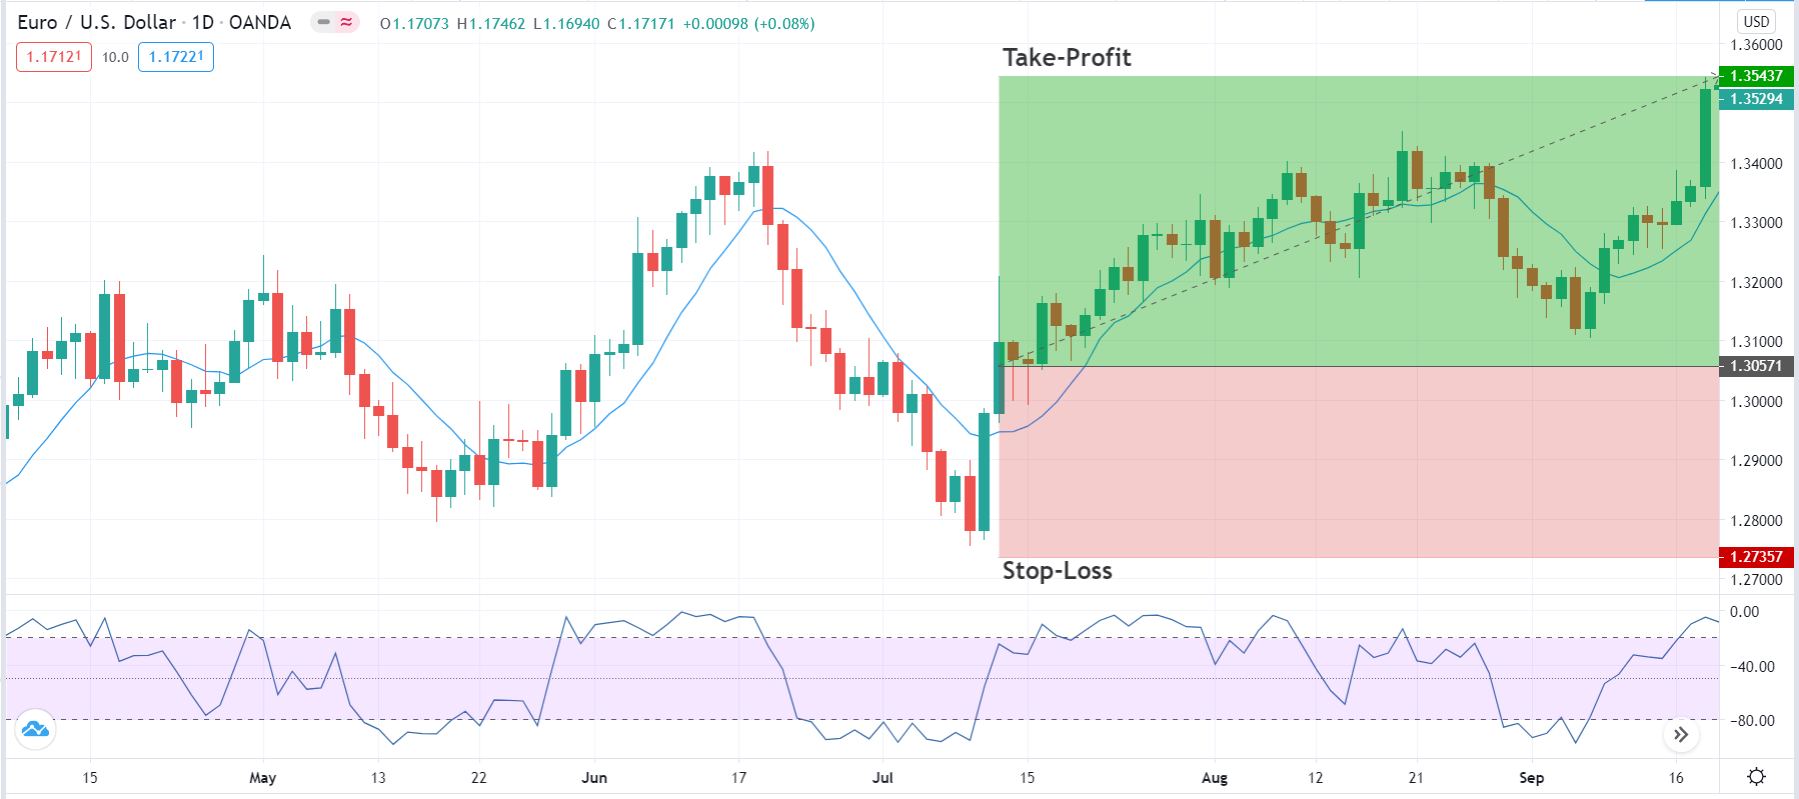
Step 4: Lastly, we need to determine the stop-loss and take-profit for the trade. In a ‘long’ position, stop-loss is placed below the ‘Bullish Engulfing’ pattern. In a ‘short’ position, it is placed above the ‘Bearish Engulfing’ pattern. The take-profit is set at a point where the resultant risk-to-reward (RR) ratio of the trade will be 1.5. However, partial profits can be taken at the opposing ‘support’ and ‘resistance’ levels that might be a hurdle for the price.

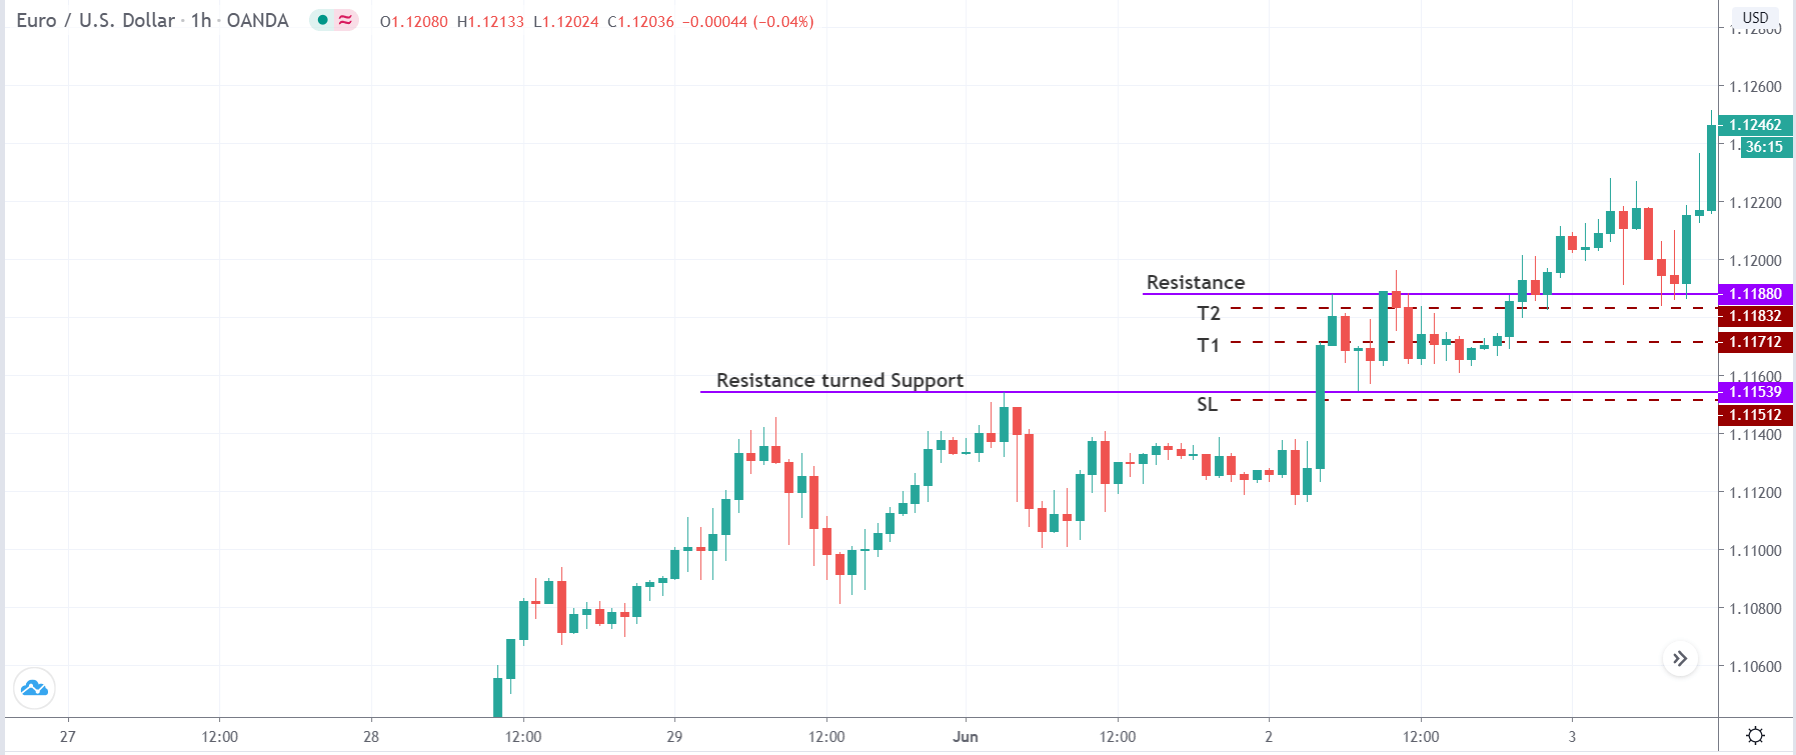
In our example, the risk-to-reward (RR) ratio of 1.5 was achieved after a period of one month since traded on the ‘Daily’ time frame.

Strategy Roundup

William’s %R is a very powerful indicator that helps us identify opportunities during a reversal phase of the market. It is important to note that %R should never be used in isolation. Combining the %R indicator with chart pattern, price action, and market trend gives us an edge in the market, which is difficult to get when applied individually. Trade executed using the above strategy can longer than expected to give desirable results since it is based on a higher time frame.

Categories
Forex Education

Getting Started with your First Historical Simulation

Introduction

In the previous section, we learned the steps to create a trading strategy. At this stage of the trading strategy development, we will focus on the strategy’s simulation process using historical data.

What is the Historical Simulation?

The simulation is defined as a mathematical representation that describes a system or process, making it possible to generate forecasts of such a system.

As the years have advanced, computational technologies have evolved to allow many processes simultaneously performed.  Compared to what a processor could do 40 years ago, a mere smartphone outruns any of them. In this context, the trading strategies simulation has also done so, moving from the simulation using printed paper charts to the current computer systems we observe today.

By running a historical simulation on a trading strategy, the developer should be able to estimate the gains and losses the strategy would have generated under historic market conditions within a given period.

However, while the benefit of executing a historical simulation enables one to estimate the profits and losses and whether the strategy is profitable or not, this statement should be analyzed by the developer throughout the trading strategy developing process.

Getting Started

Once the developer has completed a trading strategy, including entry and exit rules, as well as the definition of risk management and position sizing, it is necessary to formulate the rules of the strategy using a computer language. This way, the trading simulation software will execute the rules algorithm and apply it to the study’s financial dataset.

Several programming languages are able to carry out the trading strategy simulation, such as MQL4 of MetaTrader, Easy Language of Trade Station, or Python. However, for this educational article, we will continue to use the MetaTrader MQL4 language.

First Steps in the Simulator

MetaTrader 4 offers its Strategy Tester to simulate trading strategies. In the following figure, we observe the Strategy Tester terminal, in which we can develop a historical simulation of any trading strategy under study. 

The figure highlights that Strategy Tester has a user-friendly and intuitive interface for the developer, who can select the Expert Advisor that will contain the trading strategy to simulate. Similarly, the user can choose both the financial market, the timeframe, and the date span in which the simulation should run.

Running the First Simulation in Strategy Tester

In this example, we will continue using a moving-average-crossover-based trading strategy. To recap, this strategy is based on the following rules:

  • A buy position will be opened when the 5-hour weighted moving average (LWMA) crosses above the 55-hour simple moving average (SMA). 
  • A sell position will be activated when the 5-hour LWMA crosses below the 55-hour SMA.
  • The buy position will be closed when the LWMA 5-hour has crossed below the SMA 20-hour.
  • The sell position will be closed when the LWMA 5-hour has crossed over the SMA 20-hour.
  • The position sizing will be a constant 0.1-lot.
  • Only one trade at a time is allowed.

The criteria for the execution of the historical simulation are as follows:

  • Market to simulate: GBPUSD pair.
  • Timeframe: 1 hour.
  • Simulation range: from January/02/2014 to October/02/2020.

From the simulation’s execution, we observe the following result provided by the Strategy Tester at the end of the simulation.

From the above figure, we note that the balance line was reduced by $2,230.63 from the initial balance of $10,000, reaching a final balance of $7,769.37. This result leads us to conclude that the average-crossover strategy is not profitable. However, this is just a preliminary result.  It is still possible that we could make this strategy profitable through an optimization process, where we will assess what parameter values perform the best.  We could also add stop-loss and take-profit targets that statistically boost the system into profitable territory.

Conclusions

In this educational article, we have seen the first steps to perform a historical simulation. This process provides the developer with an overview of the strategy’s performance in a given financial market under certain conditions. We highlight that the performance conditions could repeat in the future. For this reason, once evaluated the strategy feasibility in terms of profitability, the developer should test the trading strategy during a specific period with paper money in real-time.

On the other hand, the profitable or non-profitable result is just a snapshot of the strategy’s performance. During the optimization process, the developer will investigate the parameters that provide higher profitability or lower risk for the investor.

The next educational article will review the simulator’s information in detail once the historical simulation has been executed.

Suggested Readings

  • Jaekle, U., Tomasini, E.; Trading Systems: A New Approach to System Development and Portfolio Optimisation; Harriman House Ltd.; 1st Edition (2009).
  • Pardo, R.; The Evaluation and Optimization of Trading Strategies; John Wiley & Sons; 2nd Edition (2008).
Categories
Forex Basic Strategies

Trading The Most Simple Yet Profitable ‘MACD Combo Strategy’!

Introduction

Theoretically, trend trading is easy. All we need to do is keep buying as long as we see the price rising and keep selling as long as we see the price breaking lower. In practice, it is far more difficult to do it. When looking for such opportunities, many questions arise in our minds, such as:

  • What is the direction of the market?
  • After spotting the trend, how long is the retracement going to last?
  • When is the trend going to end?

The greatest fear for traders is getting into a trend too late. That is, when the trend is coming to an end. Despite these difficulties yet, trend trading is considered to be the least risky and most popular styles of trading. When a trend develops, it can last for hours, days, and even months, depending on the time-frame.

Time Frame

The MACD Combo strategy works well on the 1-hour time frame. After gaining enough experience on the 1-hour time frame, we can also try the strategy on lower time frames.

Indicators

In this strategy, we will be using the following indicators

  1. 50 SMA
  2. 100 SMA
  3. MACD with default settings

Currency Pairs

This strategy applies only to major currency pairs. Some of the preferred pairs are EUR/USD, USD.JPY, GBP/USD, GBP/JPY, and few others. We need to make sure that whichever currency pair we are selecting, it should be fairly liquid.

Strategy Concept

The strategy we have developed answers all of the above questions. It also gives us clear entry and exit signals. This strategy is called the MACD combo. We use two forms of moving averages for the strategy: the 50 simple moving average (SMA) and the 100 SMA. The 50 and 100 input of SMA is suitable for trading on the 1-hour time frame chart. The input will change depending on the time-frame we choose to trade.

The 50 SMA provides a signal for entering a trade, while 100 SMA ensures that we are working in a clear trending market. The main idea of the strategy is that we buy or sell only when the prices cross the moving average in the direction of the trend. The basic concept of the strategy may appear similar to the “momo” strategy but is far more patient and uses longer-term moving averages on hourly charts to capture larger profits.

When this strategy is used on the daily (D) time frame wit the same indicator settings, it gives a larger risk to reward. Hence, this strategy is appropriate for long-term investors and swing traders.

Trade Setup

In order to explain the strategy, we have considered the chart of GBP/USD, where we will be using the strategy on the 1-hour time frame. Here are the steps to execute the MACD combo strategy.

Step 1

The first step of the strategy is to determine the market direction. This means we need to establish the trend of the market. As this is a trend trading strategy, the market must trend in a single direction before we can apply it. In an uptrend, the price should adequately trade above the 50 SMA and 100 SMA for a long period of time. Similarly, for a downtrend, the price should trade below both the SMAs.

In the below image, we see that the market is in a strong uptrend. Hence, we will look for ‘buy’ opportunities.

Step 2

The next step is to wait for a price retracement or a ‘pullback’ to join the trend at this discounted price. We say that the pullback is valid if the price crosses the closest SMA and stays below that SMA at least for a period of4-5 candles. But we need to make sure that the price does not cross below the next SMA. If that happens, the trend gets invalidated, and it may signal a reversal of the trend.

The below image shows that the pullback has crossed the first SMA (50 Period) and has stayed there for more than 5 hours.

Step 3

In this step, we will use the MACD indicator to enter the market. In case of an uptrend, we enter the market for a ‘buy’ as soon as the MACD indicator turns positive. Similarly, in a downtrend, we enter the market for a ‘sell’ when the MACD indicator turns negative. A conservative trader may enter the market after it moves above the SMA.

We can see in the below image that we are going ‘long’ soon after the MACD shows up a green bar. This is an aggressive form of ‘entry’ which requires experience to be able to spot them.

Step 4

In this step, we determine the stop-loss and take-profit for the strategy. Stop-loss is placed below the swing ‘low’ in case of a ‘long’ trade and above the swing’ high’ in case of a ‘short’ trade. Since we are trading with the trend, we will take our profits at the new ‘higher high‘ or ‘lower low’ depending on the momentum of the market. This is the reason behind high risk to reward of trades done using this strategy.

In this case, the risk to reward of the trade is 1:2, which is above the normal range.

Strategy Roundup

Traders implementing the MACD combo strategy should make sure that they only apply the strategy on currency pairs that are typically trending. Also, it is smart to check the crossover’s strength below or above the first moving average. We can also make use of the ADX indicator to check the momentum of the pullback. It is important to check the momentum of the trend and the pullback when trend trading.

Categories
Forex Basic Strategies

Learning To Trade The ‘Order Block’ Forex Strategy

Introduction

Order block is a market behavior that indicates order collection from financial institutions and banks. Prominent financial institutes and central banks drive the forex market. Therefore, traders must know what they are doing in the market. When the market builds the order block, it moves like a range where most of the investing decisions happen.

The market makes a sharp move towards both upside and downsize once the order building is completed. The key term of the order block trading strategy is that it includes what the institutional traders are doing. As they are the key price driver, any strategy that includes institutional trading might

What is the Order Block?

Financial institutes do not make a sudden investment in any trading instrument. They spend a lot of money on analysis to get the best trading result. Furthermore, they play with the money that is often impossible to arrange by retail traders.

Smart money makes several steps in their trading based on the availability of the price. For example, if a bank wants to buy $100M EURUSD, it will take trade-in three or four steps. In the first step, they will take $20M, in the second step, $50M, and in the third step $30M. The price usually makes a movement when the full quota of $100M completes.

Order block seems like a range, but every range is not an order block. Moreover, we don’t know when and where the smart money moves. Therefore, we will rely on the best location and price action to identify a suitable order block.

Besides the order block, we have to know what the order flow is. Once the price starts a movement from an order block, it provides an order flow towards any direction. Order flow from a higher timeframe indicates a market direction, and we have to find the order block towards the direction of it.

Order Block Trading Strategy

From the above section, we have seen what the institutional order block and order flow is. In this trading strategy, we will use 1 hour- 4 hours or the daily timeframe to enter the trade and weekly timeframe to identify the order flow. Furthermore, we will use the Fibonacci to identify the potential location from where the market is expected to move.

Timeframe

  • One hour to 4 hours to identify the entry-level.
  • Weekly timeframe to measure the order flow.

Currency Pair

The best part of this trading strategy is that it can provide profitable trades in all currency pairs. However, we have done extensive research and found that it works well in all major currency pairs, including EURUSD, GBPUSD, and USDJPY.

Identify the Order Flow

In the weekly timeframe, we will look for the price that tested an order block and moving higher or lower. Once it completes the test and starts the movement will find the direction.

In the image above, we can see that the price moved higher and came back sharply towards the order block with an impulsive bearish pressure but did not break the lowest. After the rejection candle, we will wait for the price to move higher with a candle close. Once the candle closes, we found our weekly order flow.

Later on, we will move to the H4 or daily timeframe and identify the order block to trade towards the direction of the order flow.

Location of the Order Block

Move to the H4 timeframe and draw the Fibonacci retracement from upside to downside. While you draw the Fibonacci level, make sure to draw from the last available price, not more than 200 candles. Furthermore, for a buy trade, draw the Fibonacci from the highest price to the lowest price.

After drawing the Fibonacci level, you should consider order blocks residing below the 50% Fibonacci retracement levels. Any price below the 50% Fibonacci retracement level is the discount price and any price above the 50% retracement level is the premium price.

In the bullish order block trading strategy, you should consider the discount price and, in a bearish order block trading strategy, consider the premium price only.

Entry

Wait for the price to break above or below the order block, win an impulsive bullish or bearish pressure. Later on, the price will make new highs or lows, but you should wait when it comes back to the order block. In most cases, the price will come back to the order block and test the 50% level before making the final movement.

Therefore, if you don’t want to monitor the price, you can take a pending order at a 50% level of the order block. However, the best practice is to enter the trade once it starts moving from the order block with a candle close above or below it.

Stop Loss and Take Profit Level

The stop loss level should be below or above the order block with some buffer. In most of the cases, use 10 or 15 pips buffer to avoid unexpected market behavior.

On the other hand, the ordinary take profit level would be towards the order flow with 1:1 risk: reward ratio. However, the final take profit level is Fibonacci 0%, which is usually the top of the available price in a bullish condition and the bottom of the price in a bearish condition.

Summary

Let’s summaries the order block trading strategy:

  • Identify the weekly order flow and consider the direction.
  • Identify the premium and discount zone level with the Fibonacci retracement levels.
  • Move to H1 to H4 timeframe and find the order block within Fibonacci 50% to 100% levels.
  • The price should move towards the order flow directly from the order block, but it should come down to test the order block again.
  • Enter the trade as soon as the price rejects the order block with a reversal candlestick.

The order block trading strategy is profitable in most of the currency pairs. However, it is essential to keep in mind that the forex market is very uncertain. We, as a trader, anticipate the price, and that’s why we use stop loss. No trading strategy can assure a 100% profit. Although the Order block is a very profitable trading strategy, you should use appropriate trade management and money management rules to avoid unexpected market conditions.

Categories
Forex Basic Strategies

Heard Of The ‘Piranha’ Forex Trading Strategy?

Introduction

The forex market is mostly seen to move in a trend or a range. In the previous article, we discussed the rapid-fire strategy, which works best in a trend. The piranha strategy that we are going to discuss is used in a ranging market.

Everyone would have heard of piranhas. They typically take small bites frequently off their prey until it is totally devoured. A single bite may not cause much harm, but it is the frequency of bites that causes the attack to be deadly. In the same way, the piranha strategy was developed to allow scalpers to bite the market and chew off small profits each time.

This strategy is specifically designed for the GBP/USD currency pair, where it is applied to the 5-minutes time frame chart. On average, one can find over 15 trades in a day using the piranha strategy.

Time Frame

The piranha strategy is useful for trading on the 5-minutes time frame. This means each candlestick on the chart represents 5 minutes of price movement.

Indicators

For this strategy, we use the Bollinger band technical indicator with the following settings.

  1. Period 12, Shift 0
  2. Deviation 2

When prices approach the upper band, the market is considered to be overbought, and when prices approach the lower band, markets tend to consolidate. By setting a higher deviation value, the price volatility will be magnified, and we geta a Bollinger band with wider upper and lower bands.

Currency Pairs

The strategy is designed for the GBP/USD currency pair, which is also referred to as The Cable. However, some other currency pairs in which the strategy can be used include EUR/USD, USD/JPY, and GBP/JPY. Since the strategy takes place in short timeframes it is advisable on highly liquid pairs.

Strategy Concept

We will use the Bollinger band indicator to identify the trading range of GBP/USD, after which we will mimic the nature of the piranhas by defining objective entries for long and short positions. Long trades are initiated when market prices touch the bottom of the band, and short trades are taken when prices touch the upper band.

Piranhas are active in rivers and ponds but not in the rough seas with strong currents and waves. In a somewhat similar way, we avoid trading this strategy at times of major news announcements during the U.S. or London sessions, as such environments reflect rough seas with strong currents and waves. We will analyze the GBP/USD currency pair on the 5-minutes chart to look for long and short trades.

Trade Setup

Step 1

The first step of the strategy is to first look for a range on the chart of GBP/USD. The range can be identified using the Bollinger band strategy. However, we need to apply the concepts of price action for the identification of the range. The essential criterion for a range is that the price should respect the support and resistance levels at least twice. After we have identified the range, we will apply our strategy at the extreme ends of the range to take a suitable position in the pair.

The below image shows an example of the kind range that is required for the strategy.

Step 2

The next step is to wait for the market to hit the lower band of the indicator or upper band of the indicator. At the lower band, we will look for buy opportunities, and likewise, if the price at the upper band, we will look for sell trades.

In this example, we see that the price has approached the lower band, which means there is a high chance that buyers will take the price higher from this point.

Step 3

One should not enter the market soon after the price touches the lower or upper band, which carries a huge risk. We need confirmation from the market before we can take a suitable position. In this step, we look for that confirmation. Once the price closes above the middle line of the Bollinger band indicator, it is a confirmation that the support is respected this time and that the price is heading at least till the range’s resistance.

Step 4

In this step, we determine the take-profit and stop-loss levels for the strategy. We have two take-profit levels – the first take-profit is set at the upper side of the range, a typical place for booking profits. Another method is to hold on to the trades until the market shows signs of reversals, which is when the price falls below the middle line of the Bollinger band.

The stop-loss for this strategy is placed below the support of the range or below the lower band. The trade offers a risk to reward ratio of around 1 to 1.5, which is not bad.

Strategy roundup

In the beginning, we mentioned that the piranhas hunt their prey until it is completely devoured. In a similar way, once the trade hits our stop loss, it means there is nothing left, and we need to look for a new setup.

The triggering of stop loss is an indication that the market is no longer trading in that band, and it has started a new trend. In such cases, wait until the market halts and starts moving in a range. The only difference will be that we will be looking for a trade in the opposite direction with the same rules.

This is an important point and a trick that one can use to navigate themselves in trending markets. As the strategy is developed to trade in a range, one will find few opportunities when the market goes into a strong trend.

Categories
Forex Basic Strategies

Learning To Trade The 123 Pattern Reversal Trading Strategy

Introduction

Strategies that we discussed in the previous set of articles were based on indicators and price action patterns. We are going into the trading strategies, where we will combine popular candlestick patterns and price action. The next two articles will discuss the 123 patterns as a reversal trading strategy and continuation trading strategy. First, we will look at the 123 pattern as an indicator of the end of a trend and also a market reversal. Hence, it is also known as the 123 top and bottom pattern.

The 123 top and bottom is a very powerful pattern that signals a reversal of a trend. It is also used as a trend continuation pattern, which we will be discussing in detail shortly. First, let us discuss the 123 patterns as a reversal trading strategy.

Time Frame

A fascinating feature of this strategy is that it applies to all time frames starting from 15 minutes to ‘daily.’ Before trying this strategy on extremely small time frames such as the 5 minutes or 1 minute, a lot of experience is required.

Indicators

As mentioned earlier, in this strategy, we will not be using any technical indicators. The only prerequisite of the strategy is to have a clear understanding of the 123 patterns before reading about the strategy.

Currency Pairs

The strategy is suitable for trading in all currency pairs. However, it is suggested to look for the trading opportunities in major and few minor currency pairs only as the patterns are more reliable and evident in these pairs.

Strategy Concept

The strategy begins by identifying three main points. For example, in an uptrend, when the market hits a new high, label that point as 1. We then wait for the price to pull back to a short-term support area. This point is labeled as 2. Finally, when the price moves up to an area between points 2 and 3, we label this as point number 3. We then take an entry at a suitable location, which we will address in the later part of the strategy.

The pattern is complete when the price stays below point 2. The strategy is to sell the currency pair on the break of point 2. The take-profit of the strategy is placed at a point that results in a 1:2 risk-to-reward ratio. The stop loss is put just above point 3, whereas a more conservative stop loss is placed just above the move, in order to maximize the risk to reward. The trader will be able to make this choice by trading the pattern again and again. Let us understand the step by step process of the strategy.

Trade Setup

In order to illustrate the strategy, we have considered the GBP/AUD currency pair, where we will look for ‘short’ trades by identifying the 123 top patterns. In this example, we are applying our strategy on the 15 minutes time frame and during one of the major trading sessions.

Step 1

The first step of the strategy is to look for point 1, which is essentially the highest point of a trend. The criteria for selection of point 1 is that the market should reach it’s previous low or high twice before it starts moving lower or higher.

In our example, we can see that the previous lows have been tested multiple times, and thus we have chosen the highest point as our point number 1.

Step 2

The next step is to mark the point number 2. When the market pulls back to the recent support or resistance area after reacting from point 1, we mark this as point 2. Remember that the price should not only reach that area but also react and move higher (for uptrend) or lower (for downtrend). This confirms the key technical level.

Step 3

The formation of the 123 pattern is complete after identifying the third point. When the market moves in the area between points 1 and 2 and later comes goes back to point 1, the point from where the market reversed becomes our point 3. Now the next step of the strategy is discovering the ‘entry.’

Step 4

In this step, we will be discussing the ‘entry.’ There are two ways of entering the market in this strategy. The first one is an aggressive way to take an entry on a break of point 2, and as the market starts moving in that direction. Traders who are confident about the pattern and have belief in the market can opt for such an ‘entry.’ The second one is a conservative approach where one takes an ‘entry’ at the test of the previous support or resistance. This gives additional confirmation that the market is ready to go in a favorable direction.

In this case, we have entered the market right after point 2 is broken, which is a little aggressive.

Step 5

Finally, we need to determine our stop-loss and take-profit levels for the strategy. The stop loss is placed a little higher than point 3, or if one wants to maximize their risk to reward ratio, he/she can place it at a 50% mark between point 2 and point 3. The take-profit is placed at a point where the resultant risk to reward is at least 1:2. However, if there is a hurdle in between, profits can also be taken at such points.

Strategy Roundup

The 123 pattern is a major trend reversal pattern is one of the best strategies for trend reversals. One can trade using this strategy on any time frame. The strategy is based on the idea that the market is losing momentum in the direction of the major trend and could reverse any moment. The probability of this strategy is high and does not require knowledge of technical indicators.

Categories
Forex Basic Strategies

Trading The Forex Market Using The ‘Pendulum Strategy’

Introduction

In the previous set of articles, we developed techniques and strategies using the most important technical analysis indicators. We also discussed how one could enter the market and make the most out of those strategies. In today’s strategy, we shall discuss a technique that will help us to anticipate a range and trade in the later stages of the range formation.

Time Frame

The suitable time frame for this strategy is the hourly (H1) or 4-hourly (H4) chart. This means each candle on the chart represents 1 hour or 4 hours of price movement, respectively. This does not mean one cannot use the strategy on the 15 minutes or daily time frame. The only difference is that it is difficult to spot trading opportunities on those time frames.

Indicators

We will not be using any indicators for this strategy. The strategy is more price action based.

Currency Pairs

One should note that this strategy is suitable for all currency pairs listed on the broker’s platform. However, it is recommended to trade only in the seven major currency pairs, as the patterns are clearer in these currency pairs.

Strategy Concept   

A pendulum in motion swings back and forth because gravity is pulling it back to the normal position every time it swings away from it. The pendulum reaches a maximum height before it starts to fall back. However, if the swinging force is a lot, the string holding the pendulum will be cut, and the pendulum will fly off.

A ranging market acts similarly to the pendulum. Every time prices pull away from the mid-point of the range towards the top or bottom end of the range, market forces pull it back towards the mid-point of the range. However, sometimes when the market gains enough momentum, prices will break the support and resistance of the range and move into a trend.

In this strategy, we wait for the pendulum to reach it’s optimal height and fall before entering the trade. We do this by executing a trade after the prices bounce back at the 10% market from either support or resistance. Our first target is set at 50% of the range, and the second target is set at the 90% mark of the range.

Trade Setup

We used the EUR/USD currency pair to illustrate the strategy, where we will be discussing a ‘long’ trade. Here are the steps to follow in order to execute the pendulum strategy.

Step 1

The first step of the strategy is to look for established levels of resistance turned support. By established, we mean the resistance which has now turned into support should be quite strong. It will be prominent if the breakout happens with strength, or essentially which happens after a news release.  After that, we need to mark our resistance, or ‘high’ from the market retraces to our support. These two important levels are marked in the below figure.

Step 2

The next step is to wait for the price to bounce off from the support area by 10% of the range that is created between the two lines marked. In the above example, the arrow mark points at the 10% value of the range, as shown in the below image. We will be entering the market for a ‘buy’ exactly after this 10% bounce. The stop loss for this strategy is placed somewhere at a price where the resultant risk to reward is 1.

Step 3

The best part of this strategy is that many emphases are put on trade management. In this step of the strategy, we remove 50% of our positions at the 50% mark of the range and 90% of the positions at the 90% mark of the range. In this, we ensure that even if the market reverses from the middle of the range and breaks below the support, we will still be profitable and would not any money even if the price hits our stop loss.

The points of the first and second targets are shown in the below figure, represented by brown dashed lines. One can also see the position of the Stop Loss marked by a brown dashed line.

We can see in the image below that the market finally breaks out and continues its upward momentum. When critical levels of resistance turned support and support turned resistance are found in an uptrend and downtrend respectively, traders can wait for the market to make new ‘highs’ or ‘lows’ and then book their profits.

Strategy Roundup

This strategy is applicable as long as the market is swinging back and forth in the form of a range. However, the main requirement of the strategy is to find strong levels of resistance turned support in an uptrend (preferably) and support turned resistance in a downtrend (preferably). If the breakout or breakdown does not occur with strength, the strategy might not yield the desired result, or the trade might work just a little bit. Although it looks like trading simple support and resistance strategy, establishing key levels at the beginning of the strategy and application of trade management is what makes this strategy different from trading traditional support and resistance.

Point of Caution

Previously, we mentioned to look out for key levels in trending markets, but at the same time, one needs to be cautious while determining these levels. One needs to check if the market is overbought, in case of an uptrend, or oversold, in case of a downtrend. An indicator that can help us determine the overbought and oversold conditions of the market is the Stochastic indicator.