Categories
Forex Basic Strategies

Heard Of The ‘Piranha’ Forex Trading Strategy?

Introduction

The forex market is mostly seen to move in a trend or a range. In the previous article, we discussed the rapid-fire strategy, which works best in a trend. The piranha strategy that we are going to discuss is used in a ranging market.

Everyone would have heard of piranhas. They typically take small bites frequently off their prey until it is totally devoured. A single bite may not cause much harm, but it is the frequency of bites that causes the attack to be deadly. In the same way, the piranha strategy was developed to allow scalpers to bite the market and chew off small profits each time.

This strategy is specifically designed for the GBP/USD currency pair, where it is applied to the 5-minutes time frame chart. On average, one can find over 15 trades in a day using the piranha strategy.

Time Frame

The piranha strategy is useful for trading on the 5-minutes time frame. This means each candlestick on the chart represents 5 minutes of price movement.

Indicators

For this strategy, we use the Bollinger band technical indicator with the following settings.

  1. Period 12, Shift 0
  2. Deviation 2

When prices approach the upper band, the market is considered to be overbought, and when prices approach the lower band, markets tend to consolidate. By setting a higher deviation value, the price volatility will be magnified, and we geta a Bollinger band with wider upper and lower bands.

Currency Pairs

The strategy is designed for the GBP/USD currency pair, which is also referred to as The Cable. However, some other currency pairs in which the strategy can be used include EUR/USD, USD/JPY, and GBP/JPY. Since the strategy takes place in short timeframes it is advisable on highly liquid pairs.

Strategy Concept

We will use the Bollinger band indicator to identify the trading range of GBP/USD, after which we will mimic the nature of the piranhas by defining objective entries for long and short positions. Long trades are initiated when market prices touch the bottom of the band, and short trades are taken when prices touch the upper band.

Piranhas are active in rivers and ponds but not in the rough seas with strong currents and waves. In a somewhat similar way, we avoid trading this strategy at times of major news announcements during the U.S. or London sessions, as such environments reflect rough seas with strong currents and waves. We will analyze the GBP/USD currency pair on the 5-minutes chart to look for long and short trades.

Trade Setup

Step 1

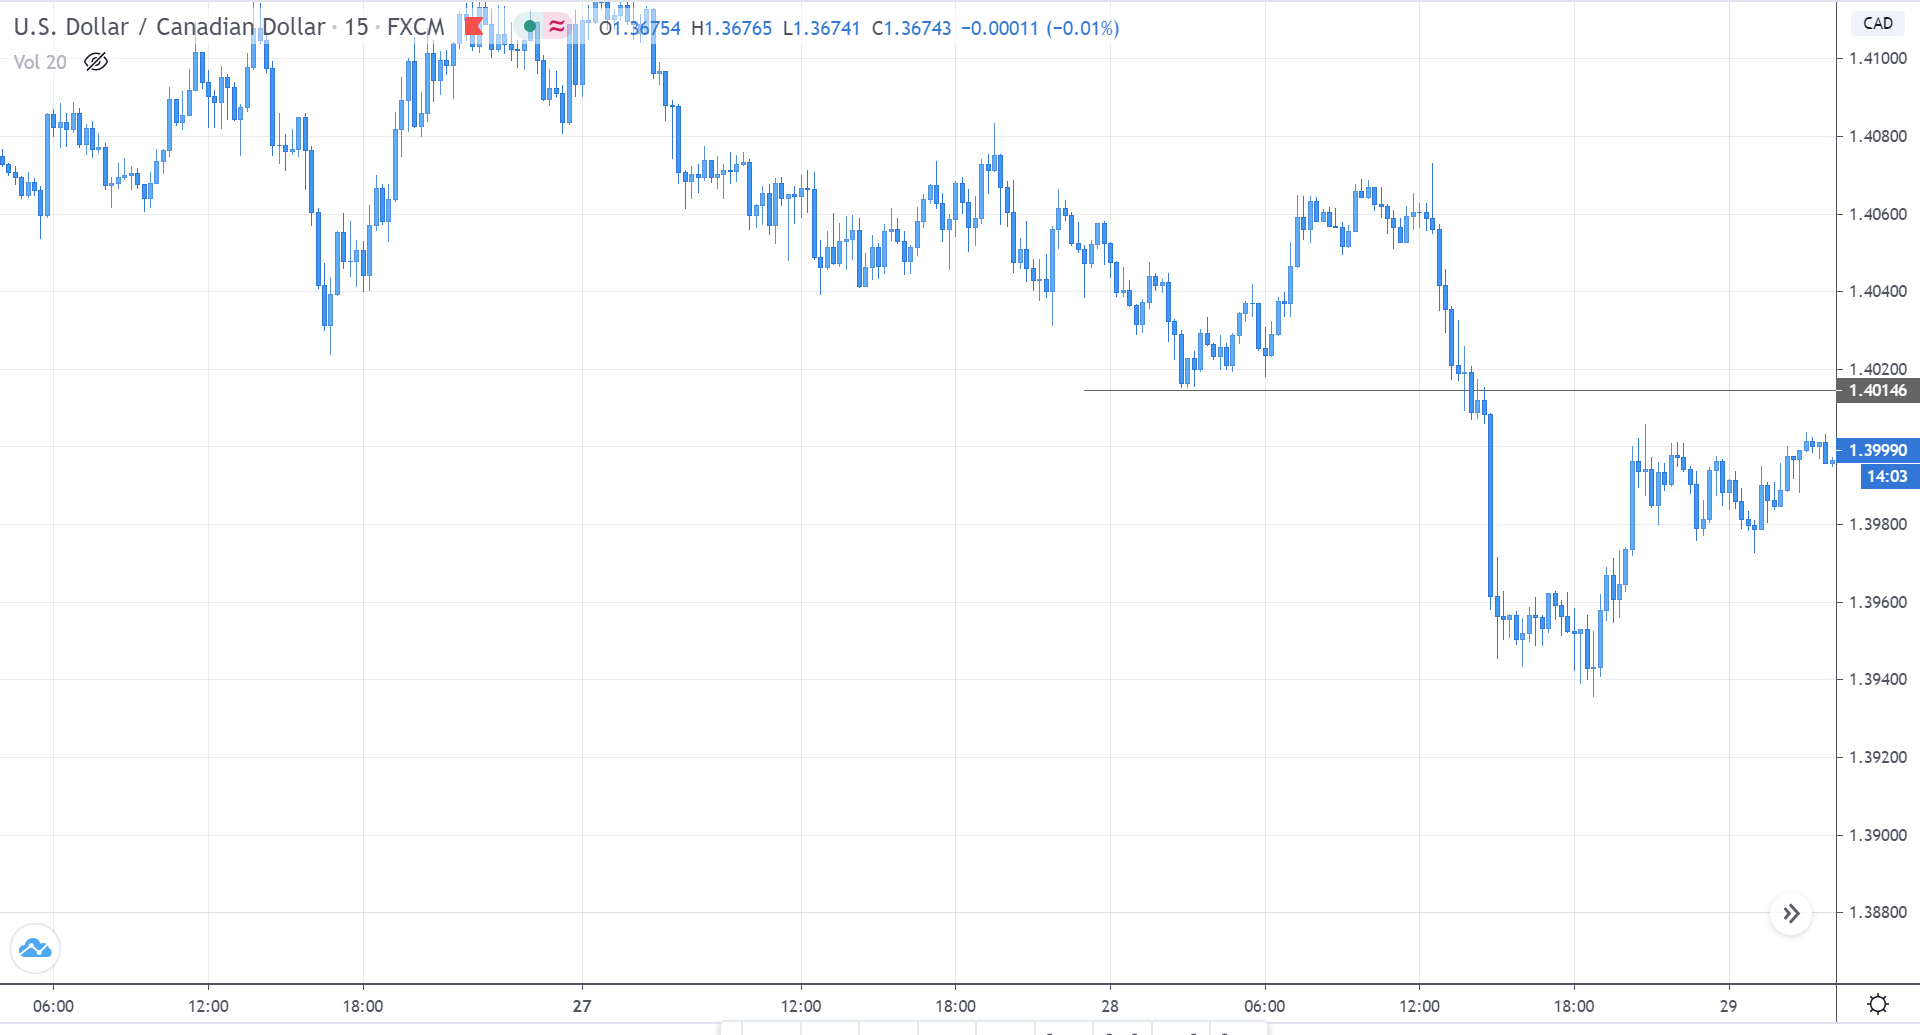
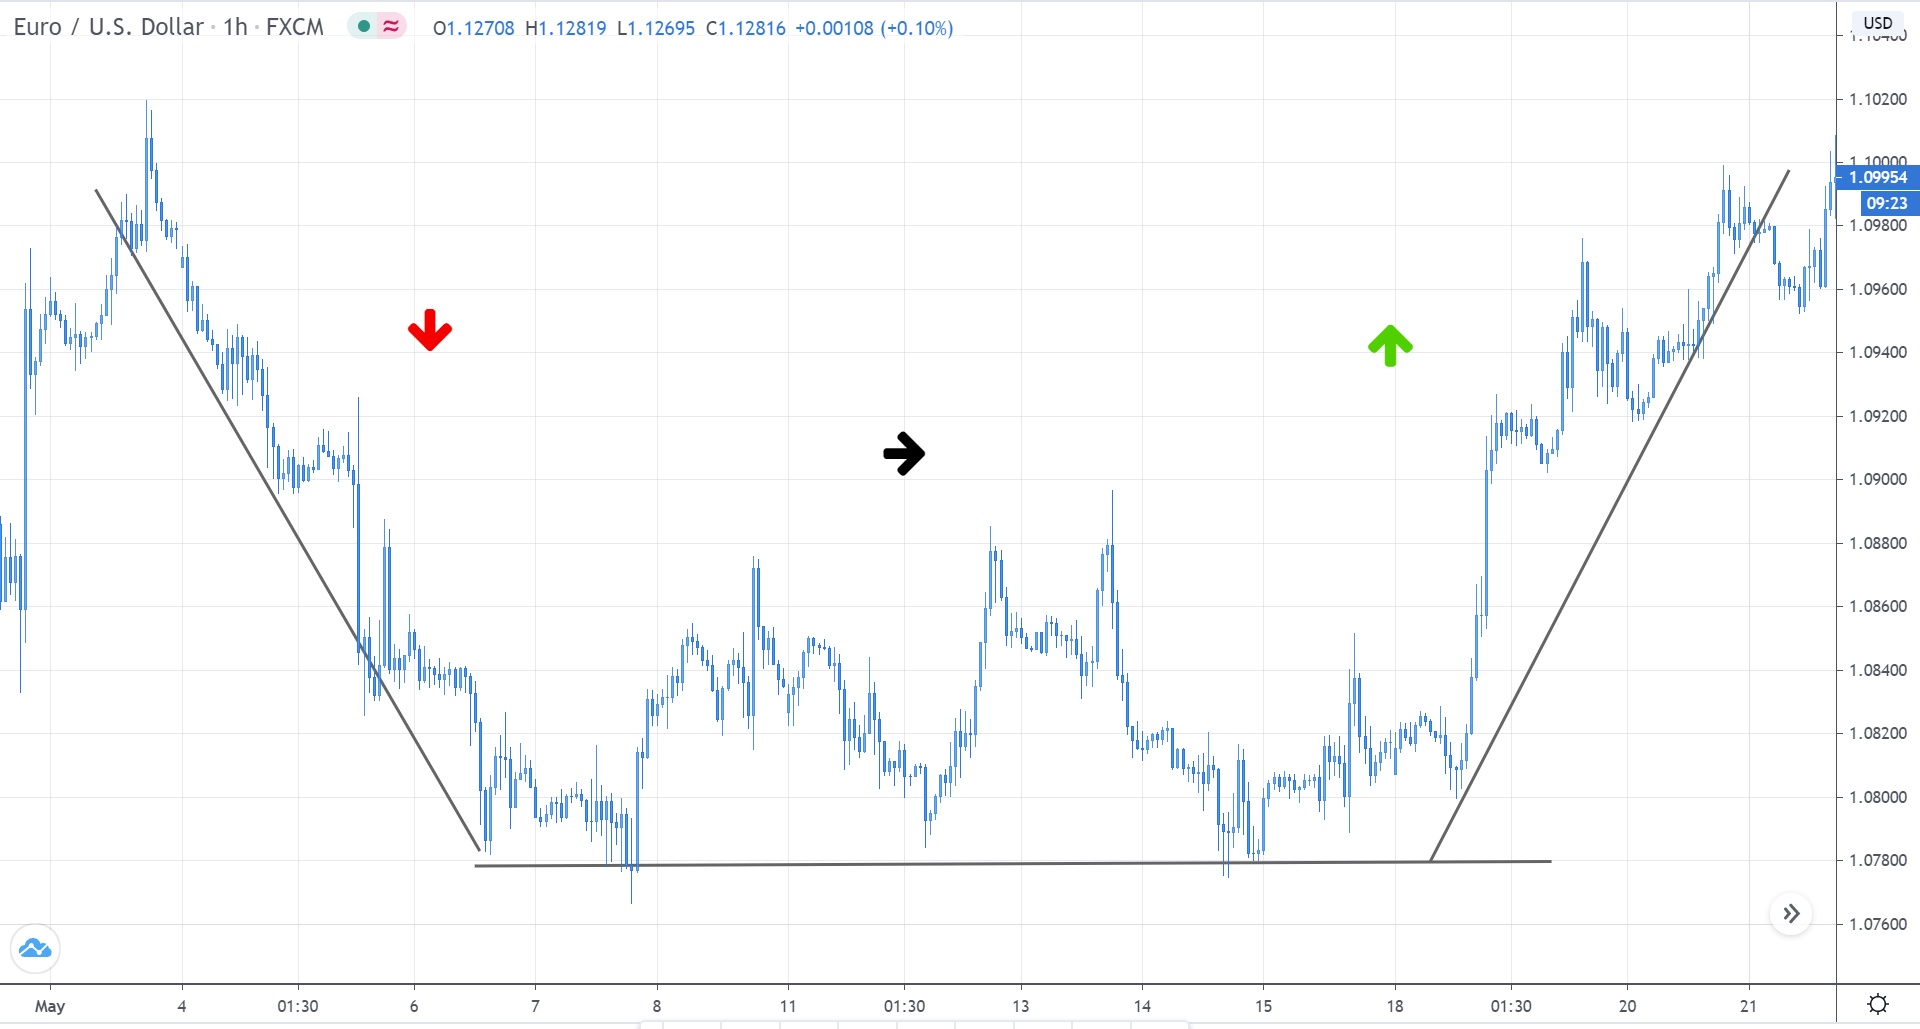
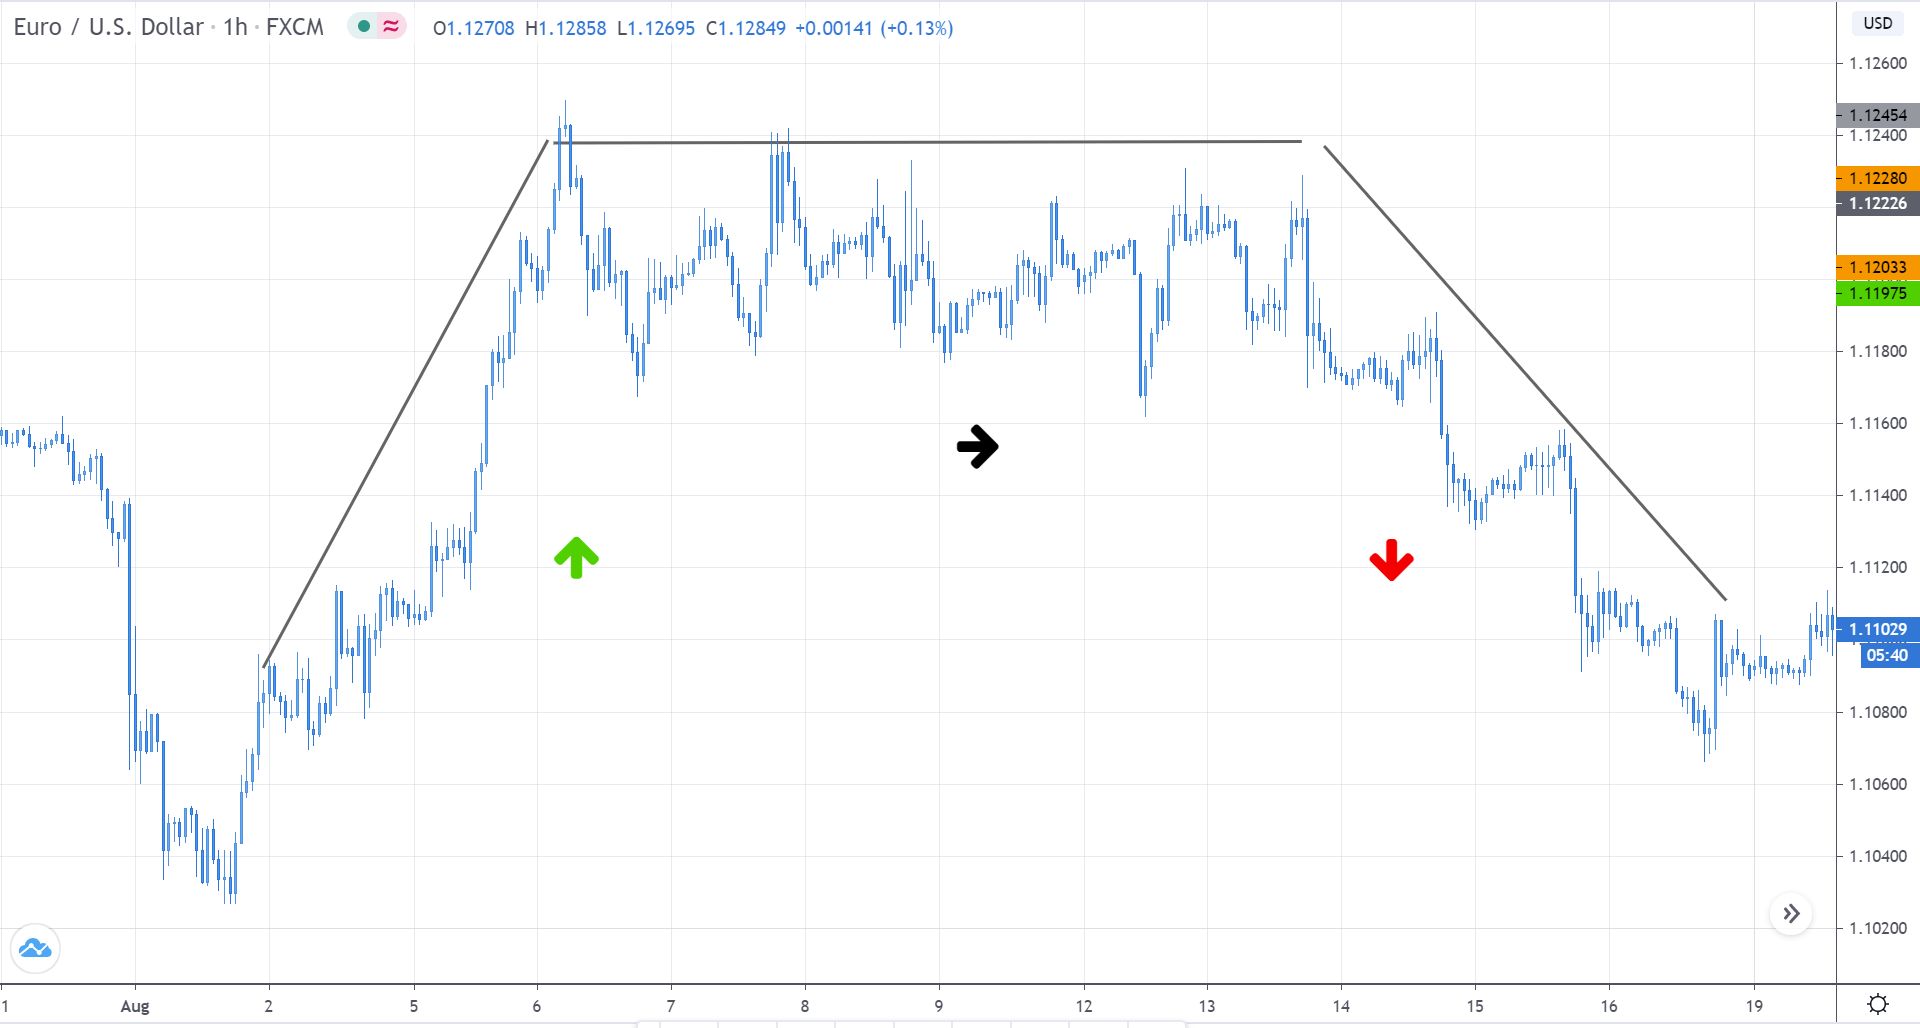
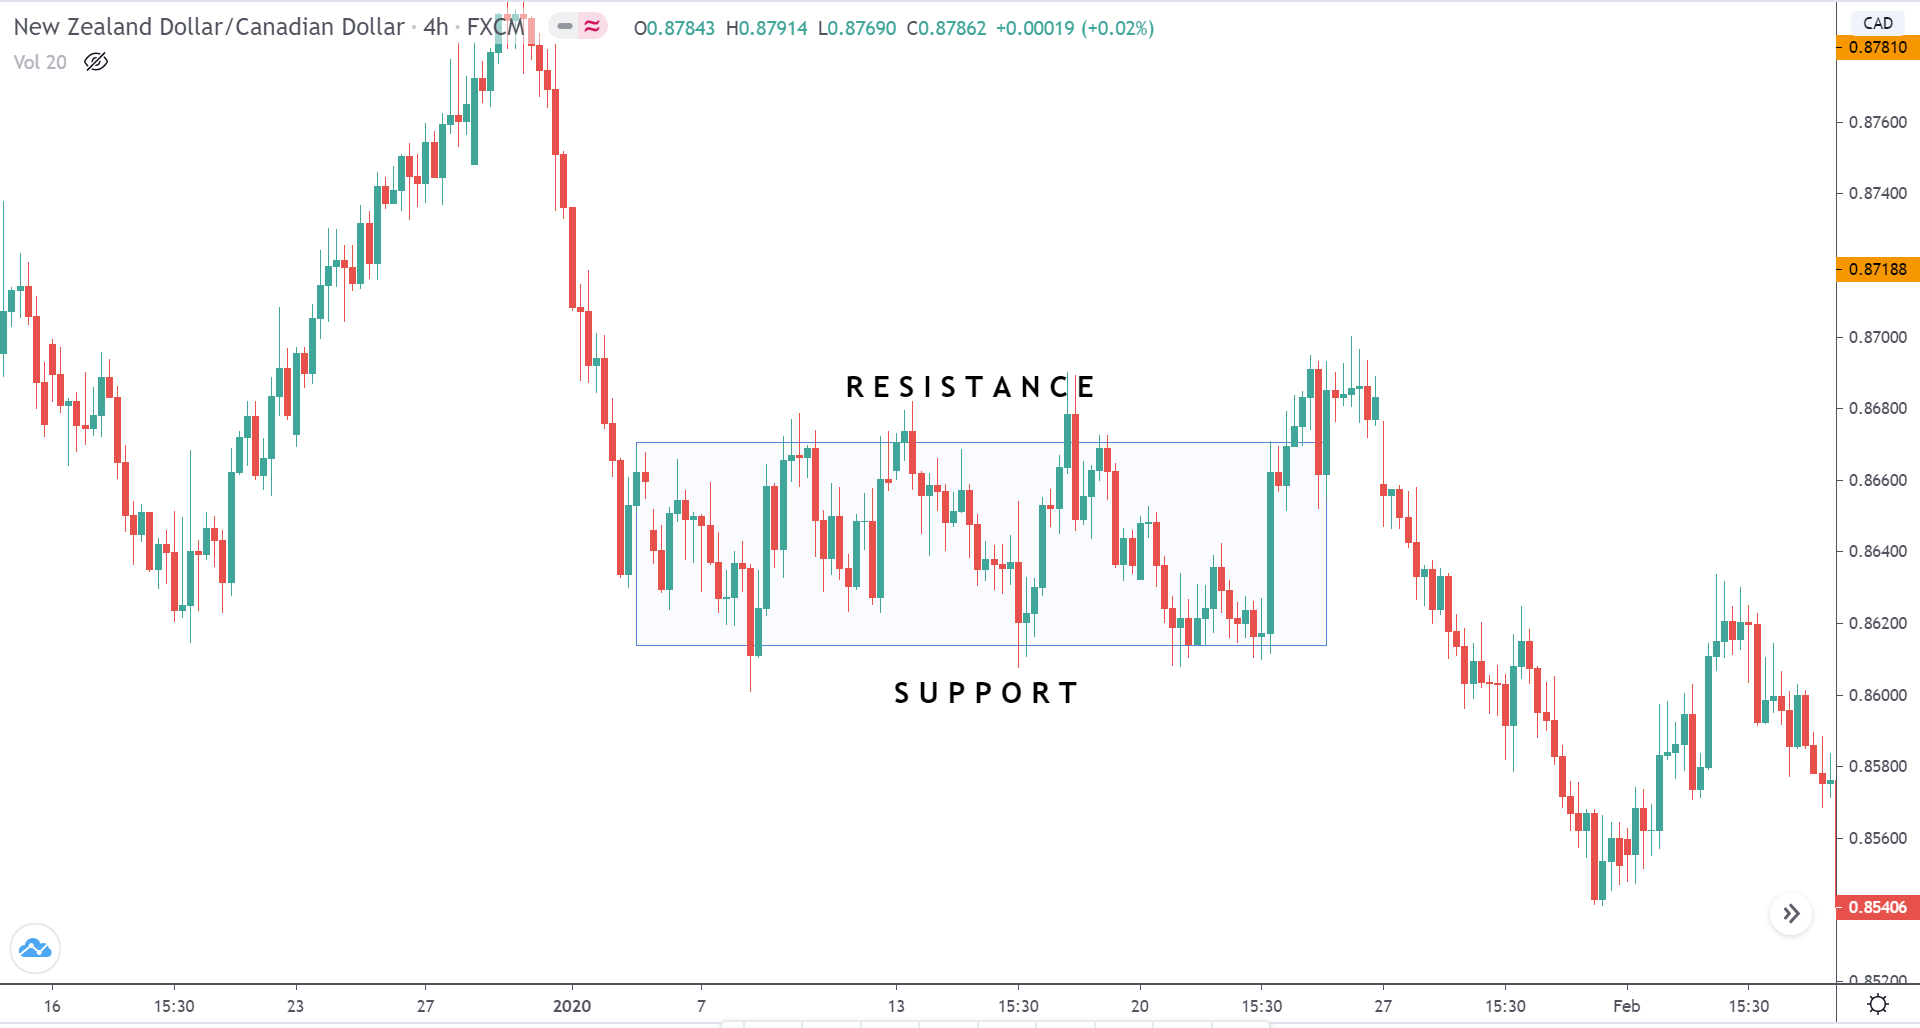
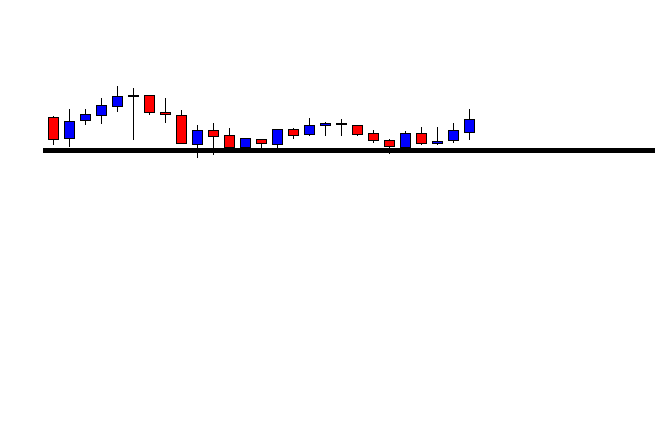
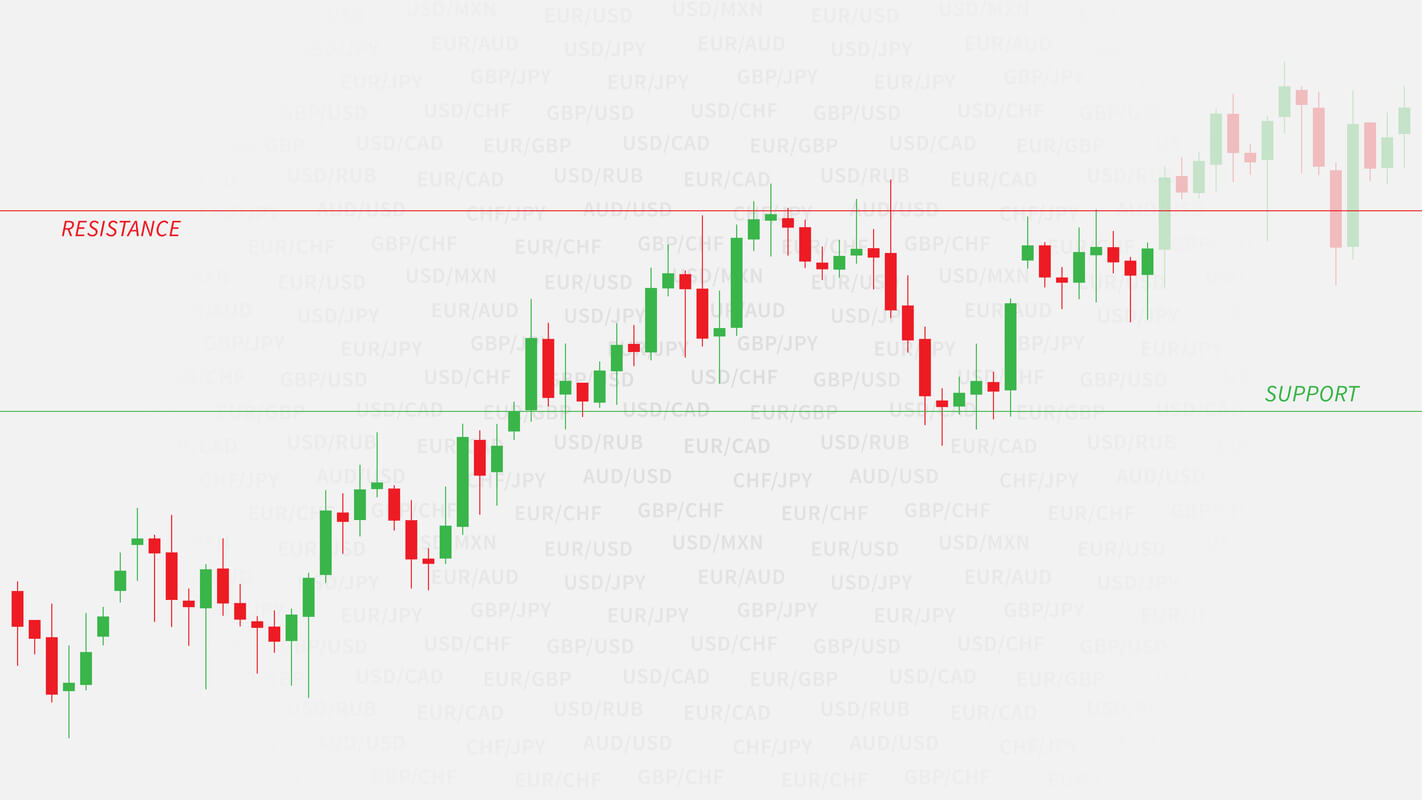
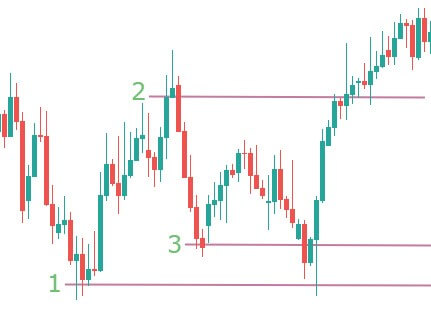
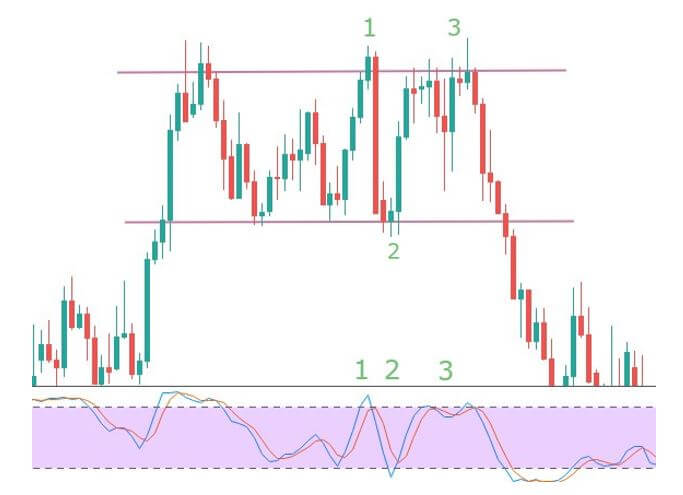
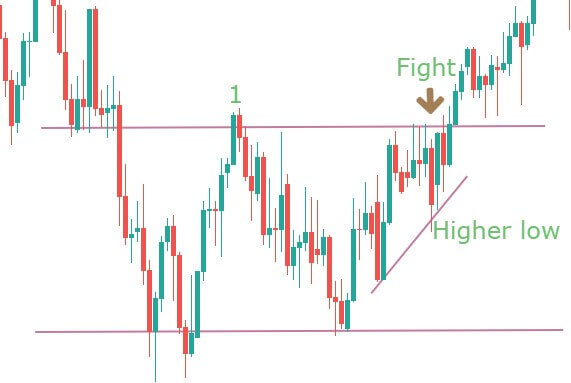
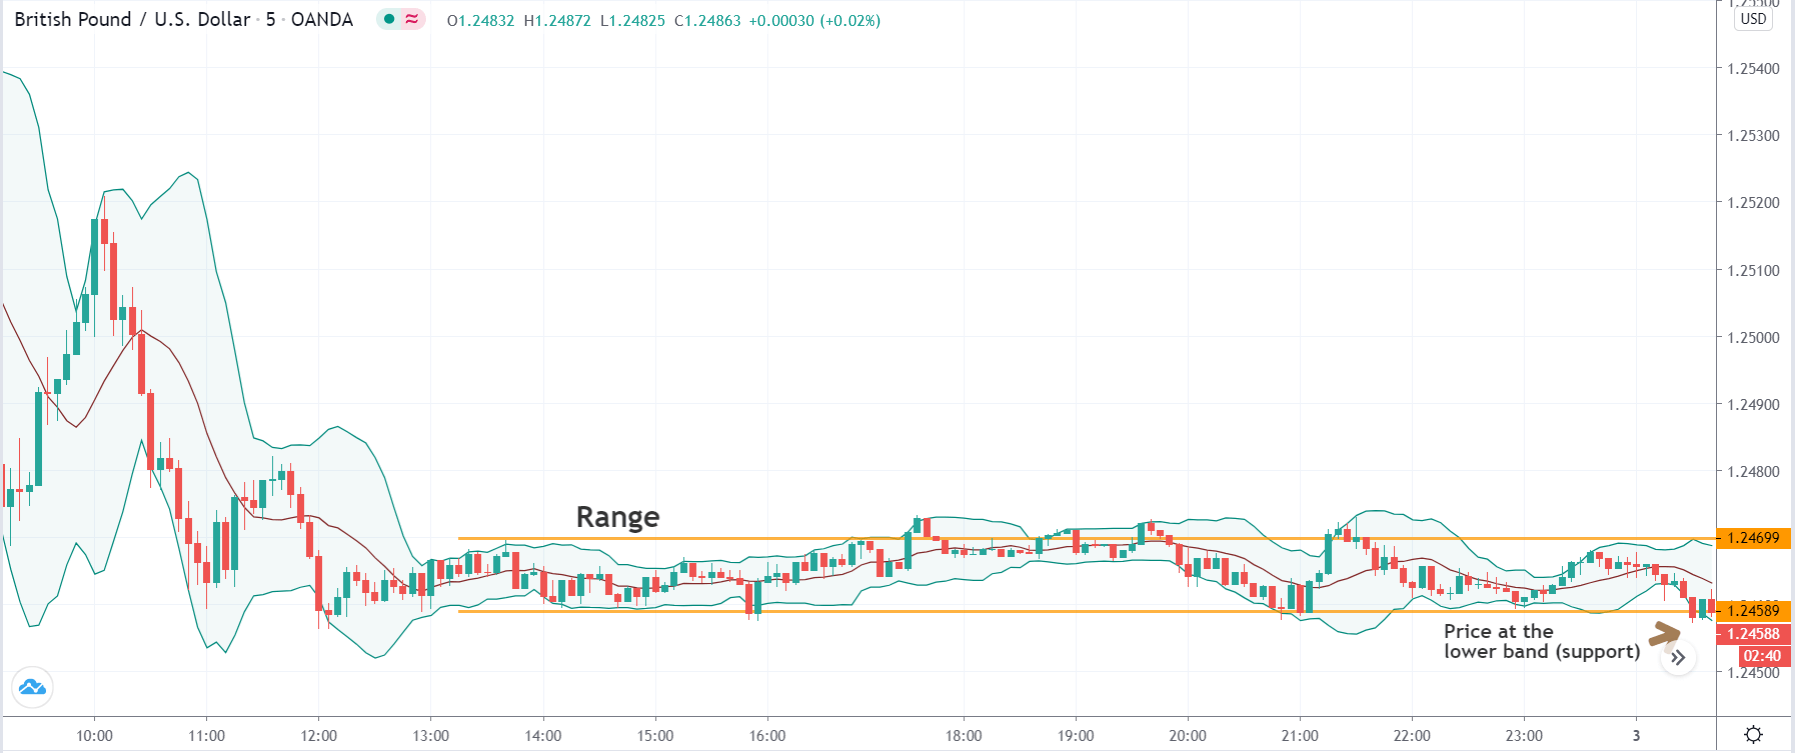
The first step of the strategy is to first look for a range on the chart of GBP/USD. The range can be identified using the Bollinger band strategy. However, we need to apply the concepts of price action for the identification of the range. The essential criterion for a range is that the price should respect the support and resistance levels at least twice. After we have identified the range, we will apply our strategy at the extreme ends of the range to take a suitable position in the pair.

The below image shows an example of the kind range that is required for the strategy.
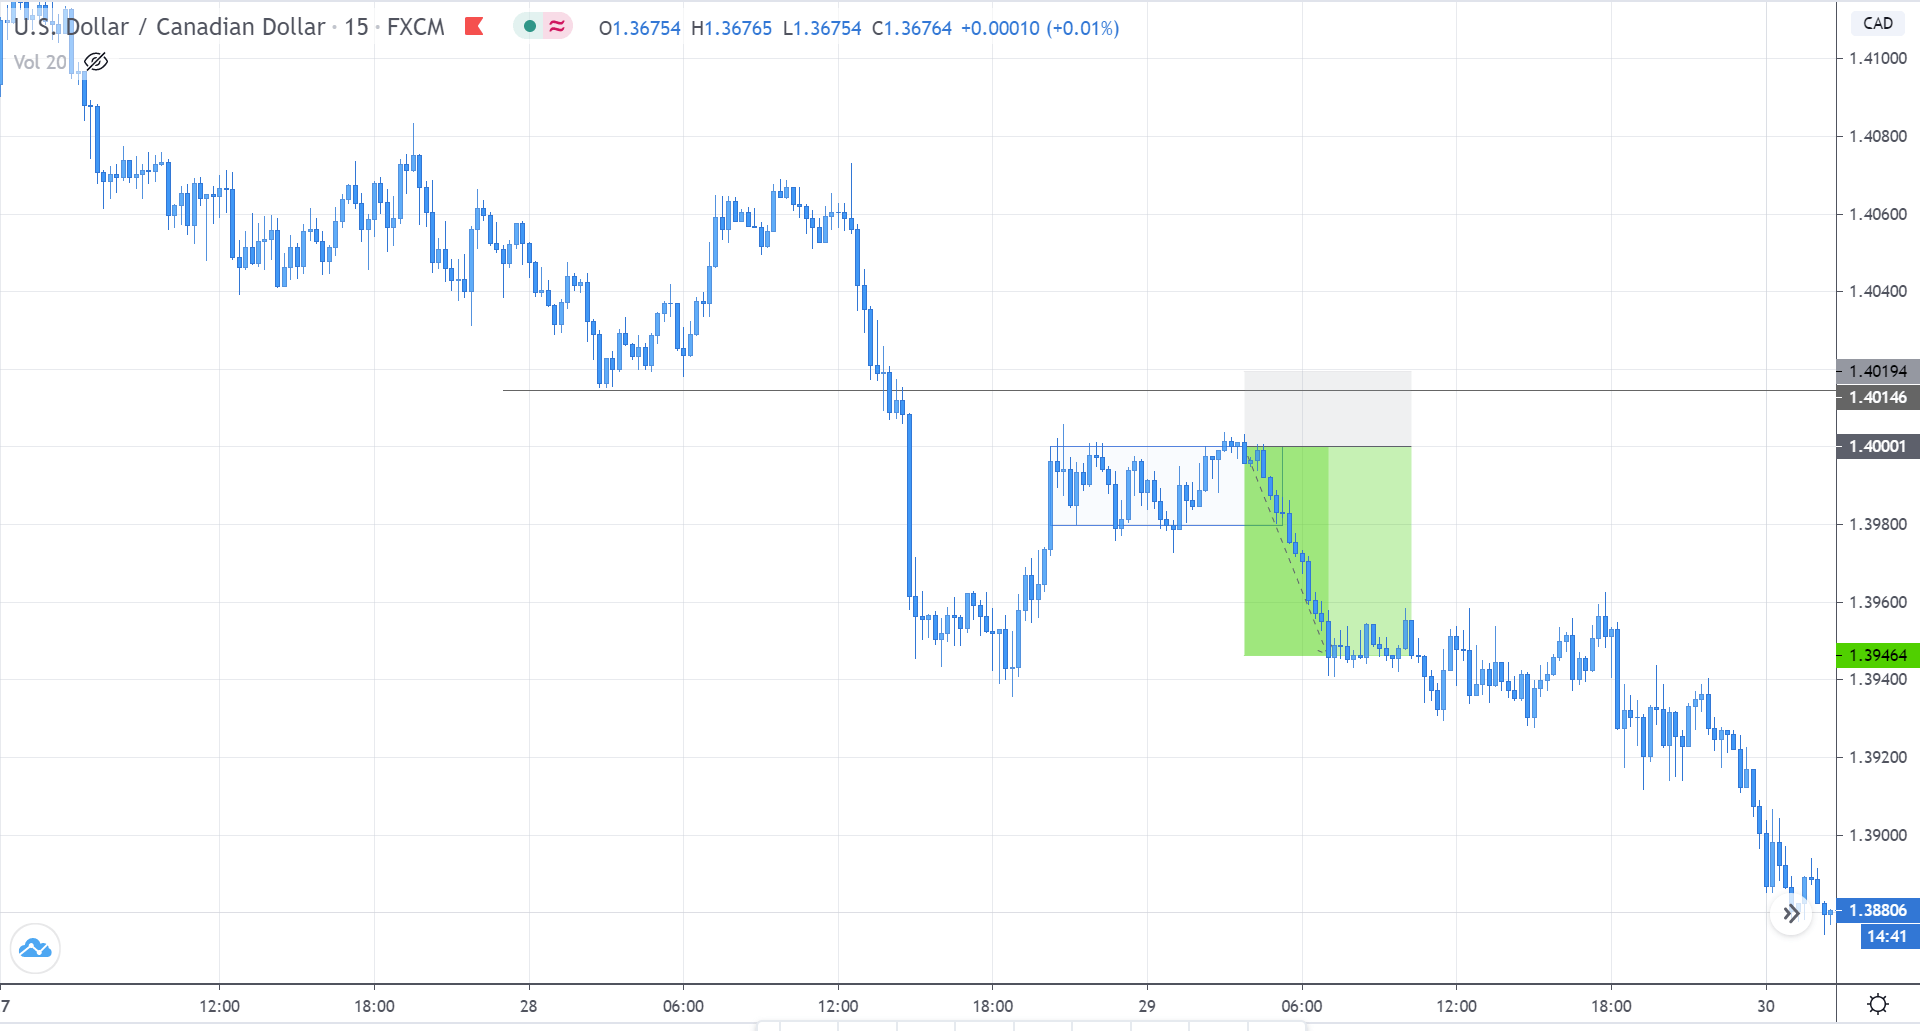
Step 2

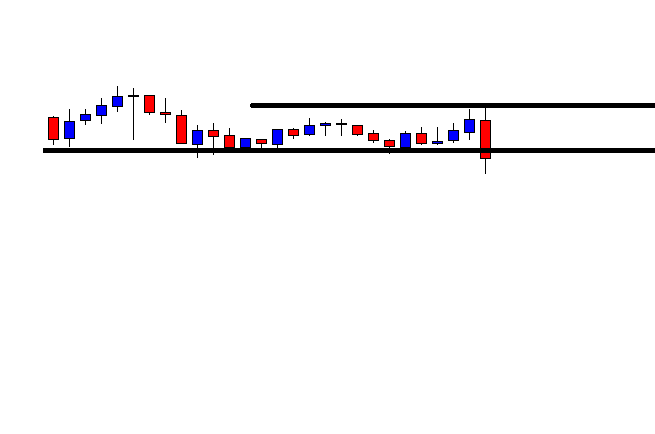
The next step is to wait for the market to hit the lower band of the indicator or upper band of the indicator. At the lower band, we will look for buy opportunities, and likewise, if the price at the upper band, we will look for sell trades.

In this example, we see that the price has approached the lower band, which means there is a high chance that buyers will take the price higher from this point.

Step 3

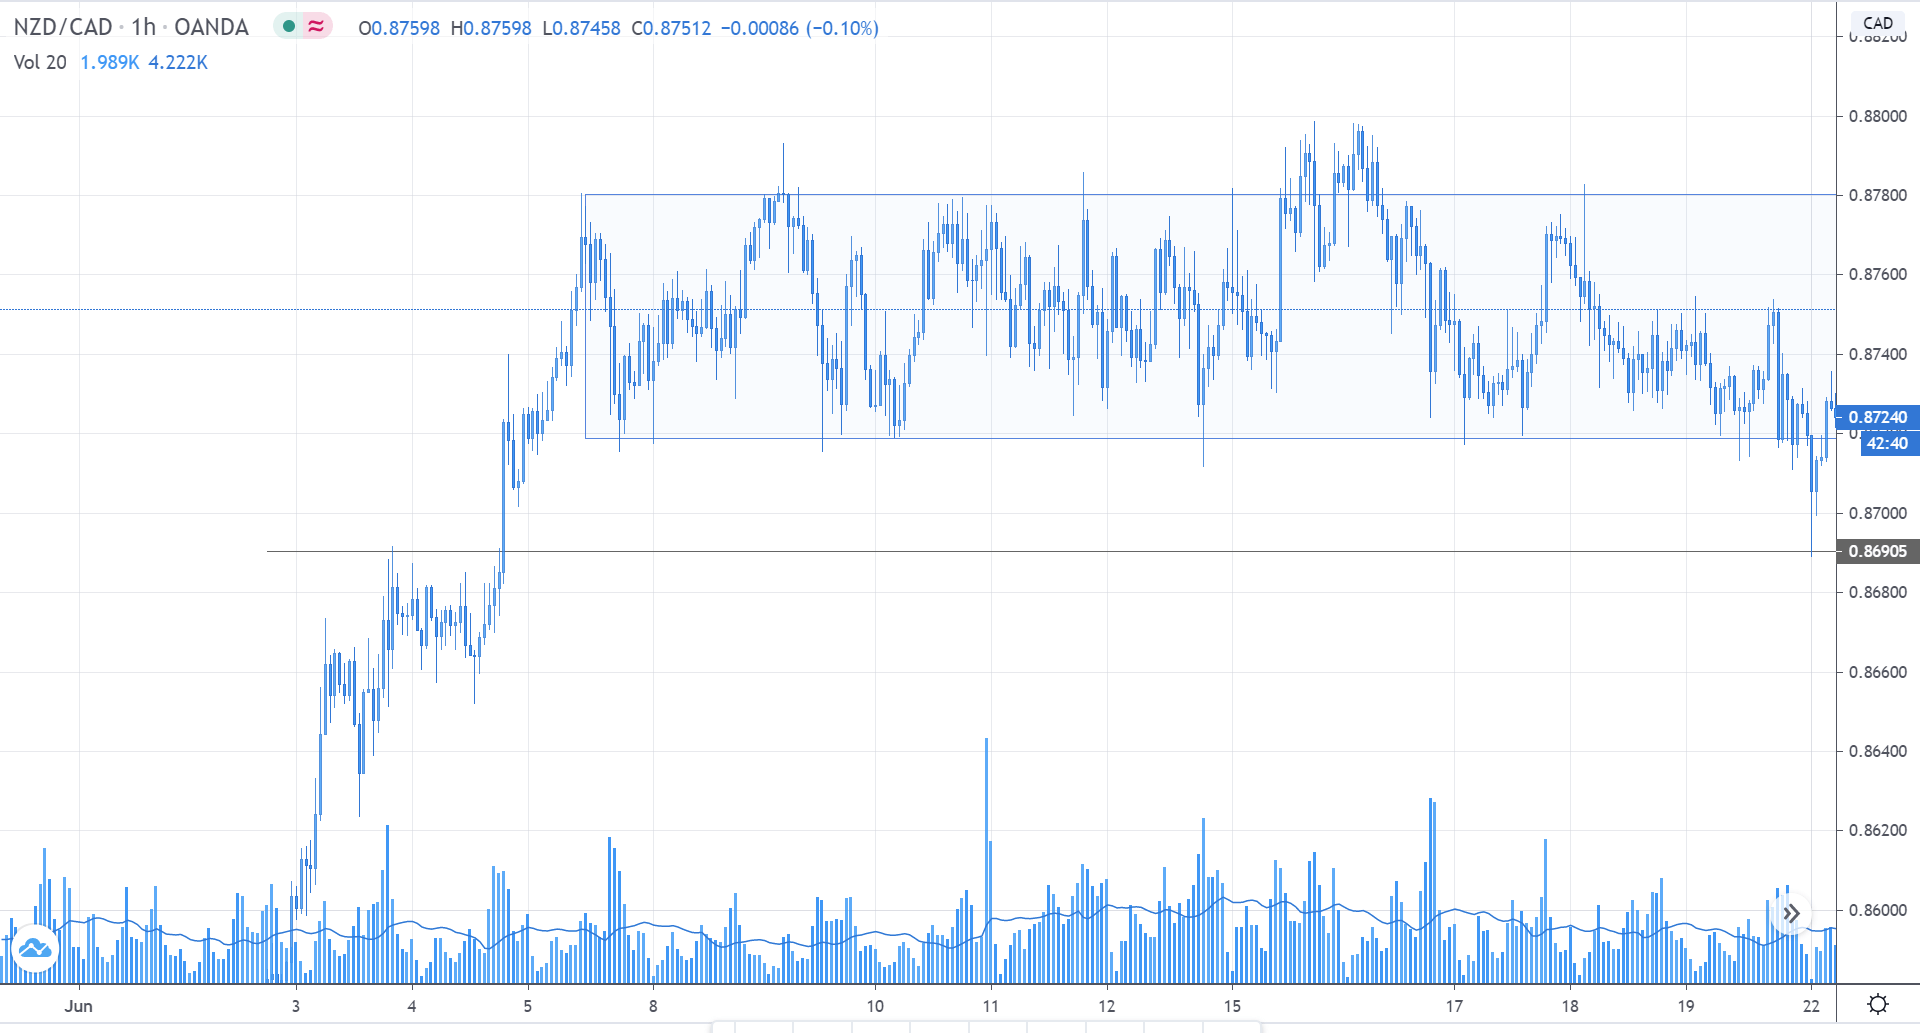
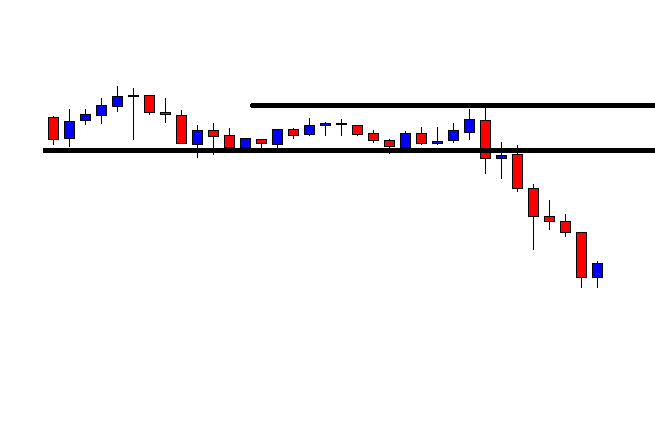
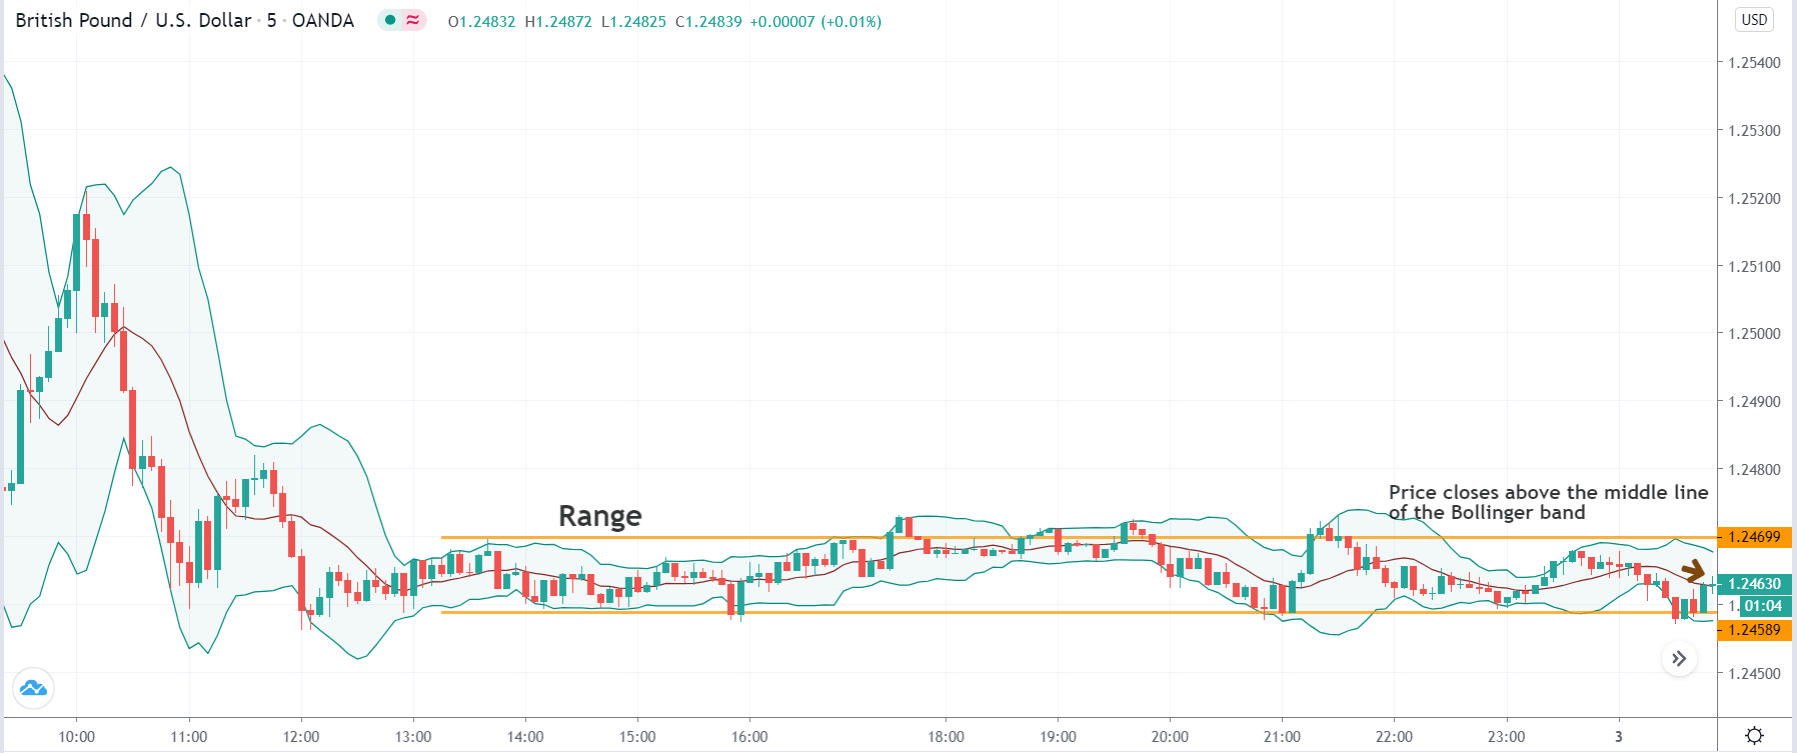
One should not enter the market soon after the price touches the lower or upper band, which carries a huge risk. We need confirmation from the market before we can take a suitable position. In this step, we look for that confirmation. Once the price closes above the middle line of the Bollinger band indicator, it is a confirmation that the support is respected this time and that the price is heading at least till the range’s resistance.

Step 4

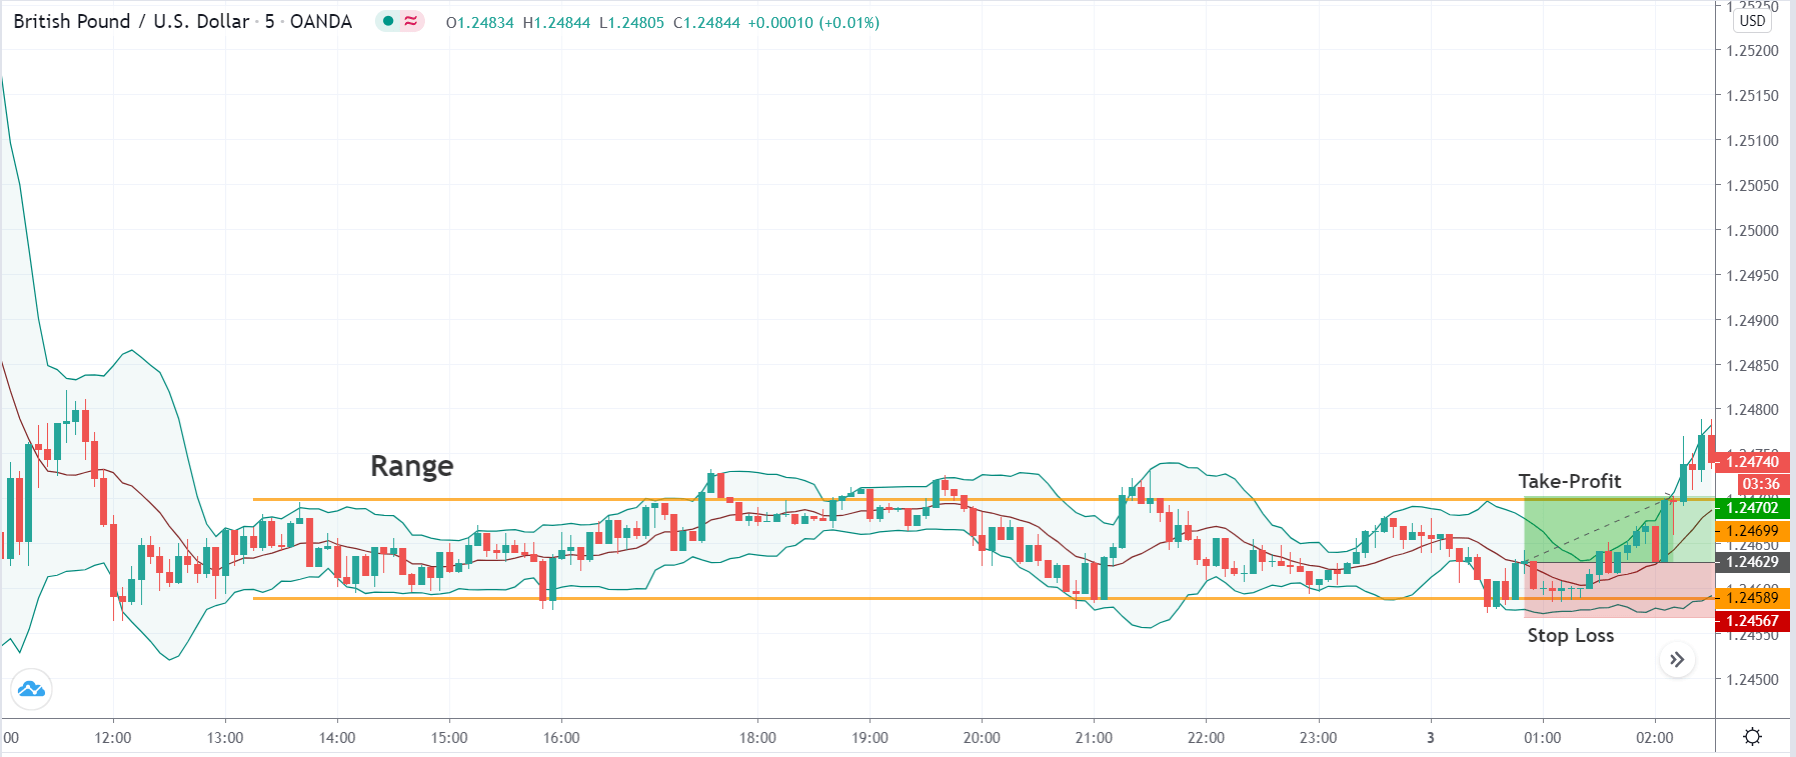
In this step, we determine the take-profit and stop-loss levels for the strategy. We have two take-profit levels – the first take-profit is set at the upper side of the range, a typical place for booking profits. Another method is to hold on to the trades until the market shows signs of reversals, which is when the price falls below the middle line of the Bollinger band.

The stop-loss for this strategy is placed below the support of the range or below the lower band. The trade offers a risk to reward ratio of around 1 to 1.5, which is not bad.

Strategy roundup

In the beginning, we mentioned that the piranhas hunt their prey until it is completely devoured. In a similar way, once the trade hits our stop loss, it means there is nothing left, and we need to look for a new setup.

The triggering of stop loss is an indication that the market is no longer trading in that band, and it has started a new trend. In such cases, wait until the market halts and starts moving in a range. The only difference will be that we will be looking for a trade in the opposite direction with the same rules.

This is an important point and a trick that one can use to navigate themselves in trending markets. As the strategy is developed to trade in a range, one will find few opportunities when the market goes into a strong trend.

Categories
Forex Course

139. How Professionals Trade The Different Market States?

Introduction

In this series of different states of the market, we understood the terminology and the concepts involved. However, in the forex market, if we do not go practical, there is the least use to the concept. In other words, one must understand how to trade in the market, knowing its state. In this final lesson of the series, we shall dive deep into the topic and understand how to apply them in the market.

Trading a Trend

Trading a trending market is the simplest and safest way to trade in the market. This is because, in a trend, it is evident on which party is dominating the market. For example, in an uptrend, it is clear that the buyers are more powerful than sellers. And hence, we look for buying opportunities rather than selling.

In a trend, the market makes higher highs and higher lows. In other words, the market moves in one direction with temporary pullbacks in the opposite direction. These pullbacks (retracements) typically turn around to the original trend direction at the support and resistance levels. So, to trade a trend, we wait for the market to make a higher high / lower low and retrace to the S&R level, before triggering the buy or sell.

Consider the below chart of USD/CAD. The market is in a clear downtrend. The market made a new lower low by breaking below the grey ray. It then retraced back to the S&R area (grey ray) and is currently moving sideways. And this sideways movement in the market has high significance.

After the sellers made a new low, the buyers began to show up. They made it until the S&R level. And the market is currently in a range. As per the definition of a range, we know that there is strength from both the parties. In other words, the buyer who was temporarily dominating the market is slowing down as they are unable to make a higher high. And this price action is happening in the S&R area of the sellers. Therefore, we can conclude that the sellers are here to continue their downtrend.

One can enter when the price is at the top of the range (resistance) or when it starts to fall from the resistance. Placing the stop-loss few pips above the S&R level, and a take profit at the Low, is the safest approach to trade a trend.

Trading a Range

In a range, the market moves between levels – Support and Resistance. In this type of market, there is power from both buyers and sellers. Typically, the market shoots up from the support and drops from the resistance. However, randomly buying at support and selling from resistance is not the right way to trade a range like a professional. To trade a range with high odds in your favor, you must be aware of the overall trend. And you place your bets on the direction of the overall trend.

Consider the below chart of NZD/CAD. We can clearly see that the market is in a range. But, looking from the left, the market is in a strong uptrend, and the price is holding above the S&R level (grey ray). In the current market, we see that the price dropped below the bottom of the range, touched the S&R level, and shot right back up into the range. Thus, confirming that the big buyer is preparing to do the buys.

Since the price strongly reacted off from the S&R level and held above the support of the range, we can prepare to go long on the market. Stop-loss from this trade would be below the S&R level, while the target point would be at the top of the range. In hindsight, the buyers were able to push the market above than the resistance.

This brings us to the end of this series. We hope you found this lesson and the previous chapters interesting and informative. Stay tuned until we release our new set of lessons.

[wp_quiz id=”79656″]
Categories
Forex Course

137. Differentiating between a Retracement and a Reversal

Introduction

Broadly speaking, there are three states in the market – trend, range, and channel. If we were to go a little more in detail, a market has components like retracement and reversal. Identifying and differentiating between a retracement and reversal is a skill in itself. In this lesson, let’s go and understand what these terms mean and how to differentiate them.

What is Retracement?

Retracement is the terminology usually associated in a trending market. We know that in a trending market, the price moves in one specific direction. For instance, an uptrend is defined as a sequence of higher highs and higher lows. As per the definition of an uptrend, the prices do not keep moving higher and higher continuously.

After trending up to a certain point, the price temporarily moves in the opposite direction. This movement against the original trend is referred to as retracement. Technically, the price action from a higher high to the higher low is called a retracement.

Uptrend Example

Downtrend Example

What is a Reversal?

A reversal can be defined as the overall change in the direction of the market. A market can reverse from an uptrend to a downtrend, or from a downtrend to an uptrend.

Reversal to the Upside

In this type of reversal, initially, the market trends in a downtrend making lower lows and lower highs. Later, the market goes into a transition state where the price typically ranges for a while. In other words, the price stops making lower lows and lows highs. Instead, it makes equal lows or higher lows. Finally, the market starts to trend north by making higher highs and lower lows.

Reversal to the Downside

This reversal happens when the market transits from an uptrend to a downtrend. In an uptrend, the price makes higher highs and higher lows. But, when the trend begins to diminish, the higher highs turn into equal highs, and higher lows start to become equal lows. Finally, when the seller’s pressure comes in, the price begins to make lower lows and lower highs, forming a downtrend. Thus, the complete scenario is referred to as a reversal.

Predicting a possible reversal or retracement in the market is pretty challenging. If you’re stuck in a position and unsure if it is a retracement or a reversal, you may try the following options to manage the trade:

  • Hold onto your positions by keeping the stop loss as it is. If it is a retracement, you can ride the trade, else get stopped if it is a reversal. This is the simplest approach.
  • If you are more inclined towards a reversal than a retracement, then you may close your positions. Based on where the market breaks through, you can look for re-entry. But, you might have to compromise on the risk: reward.
  • You could close the entire position and stay away from the pair and look for other opportunities. This is the safest option possible, especially for conservative traders.
[wp_quiz id=”79176″]
Categories
Forex Course

136. Learning To Trade The Ranging Market?

Introduction

A Range is a state of the market where the prices move back and forth between the upper bound and the lower bound. A ranging market is also referred to as a choppy, sideways, or a flat market. Unlike a trend, the prices do not move in one specific direction for a long time. A range on a time frame, when looked on a smaller time frame, the price trends in one direction for a while, reverses its direction, and trends in the opposite direction.

Understanding Support and Resistance

Knowing support and resistance is an essential concept to understand a range. These two terms form the basis of a range.

Support

In simple words, support is the level in the market where the prices tend to go up. It is the region where the buyers are interested to aggressively buy the security, causing the prices to shoot up. In other words, it is an area where there is a high demand for the currency pair. A level can be regarded as support when the price reacts multiple times (with power) from that area.

Resistance

Resistance is a level in the market where the prices tend to drop. It is the price where sellers are willing to sell or short sell the asset. They prevent the market from going higher from a specific level. Resistance is no different from that of supply.

Resistance can be understood in terms of buyers. It is an area in the market where the buyers are not interested in buying at that price as they find it expensive. Since there is no demand from the buyers, the prices drop. And when it drops to the support area, the buyers show up again. Thus, due to a higher demand than supply at the support region, the prices rise.

The combination of both support and resistance makes a range. For instance, let’s say the market drops to the $5 mark every time it touches the $10 price. Visually, the market is moving sideways, and such a market is referred to as a range. Here, the $5 price is the support level, and the $10 price is the resistance. A similar example of the same is illustrated below.

ADX indicator for ranging markets

The Average Directional Index indicator can be applied to determine if the market is trending or ranging. A value above 25 indicates that the market is in a strong trending state, while a value of less than 25 signifies that the market is in a consolidation (range) state.

Below is the live chart of AUD/CAD on the 4H time frame. Looking at the chart from a bird’s eye perspective, the market started as an uptrend, held for a while, continued with the same trend, and is currently ranging again. In this sequence, we can observe that the ADX was below the 25-mark line when the market was consolidating, and greater than 25 when it was trending upwards.

We hope you found this lesson on ranging markets interesting and informative. In the next lessons, we shall get into more detail and understand concepts like retracements and reversal. Happy learning!

[wp_quiz id=”78971″]
Categories
Forex Course

134. Knowing the State of the Market

Introduction

Many newcomers and novice traders believe that the market moves in a random direction. They think it is all about the fundamental factors that keep the market going. In reality, the market does move based on fundamental factors, but it doesn’t imply that the prices move in random directions. The prices on the charts move in a specific direction as they are nothing but the past transactions of the big institutional players.

Charts tell a lot about the market environment. It clearly determines who is in control of the market – the buyer or the sellers. Based on this, there are three states of the market:

  • Trend
  • Range
  • Channel

Broadly speaking, in any market, be it Stock, commodity, currency, or cryptocurrency, the prices move only these three states. Let us understand each of them.

Of course, there are several types of chart patterns, but they all fall in one of the types on a bigger picture. All technical traders must have an understanding of the market environment. Whatever be the strategy, it will work applied in the right state of the market. Also, every type of market has its own concepts to trade.

Trend

The most evident type of market is a trending market. At the same time, it is one of the most confusing states to understand. A trending market is a type where the prices make Higher High & Higher Low sequences or Lower Low & Lower High sequences. In other words, in a trending market, the prices make a Higher High / Lower Low, retrace to the Support & Resistance, and continue with the same pattern.

A trending market is a type that can be found in any type of market. That is, even in ranges and channels, trends can be spotted (in a miniature picture).

Based on the direction of the market, we can divide trends into two types –

Uptrend (Bullish) – A market that faces upwards is an uptrend. The price makes Higher Highs and Higher Lows. It is a market where the buyers (bulls) are in control of the market. Note that a Higher High alone cannot be regarded as an uptrend.

Downtrend (Bearish) – A market whose trajectory is downwards is referred to as a downtrend. The price moves by making Lower Lows and Lower Highs. In this market, the sellers (bears) dominate the market.

Range

A ranging market is a type where the price does not create Higher Highs of Lower Lows. Thus, it moves sideways. There is a certain price shoots up and a price where it drops. It moves within these two prices. In this market, both buyers and sellers are strong. For example, if we say the market is ranging between 0.1200 and 0.2400, it means that the buyers are pushing up the market to 0.2400 from 0.1200, while the sellers are hitting it right back down to 0.1200.

Channel

A channel is basically a tilted channel. In other sense, a channel is a trend that is quite weak. In a channel, the price does try to make a Higher Highs or Lower Lows but retraces deeply before going for the next set. In a trend, the market respects the Support & Resistance, but the channel does not.

We hope you were able to get a gist on the states of the market. In the coming article, we shall elaborate on each of the types and understand how to trade them.

[wp_quiz id=”81457″]
Categories
Forex Price-Action Strategies

The Longer It Ranges, The Harder It Breaks

Price action traders usually look for entries on the chart that has a clear trend. However, even a choppy chart end up providing good entry to the traders. In today’s lesson, we are going to show how a choppy chart ends up producing a good entry. Let us get started.

The chart shows that the price has been choppy. It bounces at a level of support three times. As far as resistance is concerned, the price has a rejection at a level once and comes back down. Then, it heads towards the upside and finds its resistance getting rejection twice. The level of support seems stronger than the resistance here.

The price finds its resistance, and at the second rejection, it makes a breakout. As mentioned, the price bounces three times at the level of support. Thus, the breakout is strong as well. The sellers are to wait for the price to be held by the breakout level and a bearish reversal candle to go short in the pair.

The next candle comes out as a doji candle closing within the breakout level. The breakout comes out as a valid breakout. The sellers are to wait for the level to create a bearish reversal candle to trigger a short entry.

Here it comes. The last candle on the chart comes out as a bearish engulfing candle closing well below the last swing low. The sellers may trigger a short entry right after the candle closes by setting stop loss above the resistance and by setting take profit with 1R. Let us proceed to the next chart to find out how the entry goes.

The price heads towards the South with good bearish momentum. The price hits the take profit (1R). The last candle suggests that the price may head towards the South further. Some traders may take partial profits and let the rest of the trade run to make more pips.

The chart produces a bullish inside bar. The chart still favors the Bear. However, it may be time for the sellers to give it a second thought to close the whole trade. If we look at the chart, the price heads towards the downside and hits the target without producing any bullish candle in between. This is how it usually goes if the price makes a breakout within a long choppy market. Thus, traders may keep their eyes on the choppy charts to see whether the price makes a breakout to offer them an entry. A breakout in a choppy market is often very rewarding.

Categories
Forex Course

99. Pivot Points: What have we learned so far?

Introduction

In the previous six lessons, we discussed pivot points right from understanding what they are, to the strategies one can apply to trade the markets. Now, let’s summarize what we’ve learned so far and move on with another exciting tool for analyzing the markets.

Pivot Point Basics

A pivot point is a technical indicator in technical analysis trading, which determines potential support and resistance levels in the market. This indicator is stationary, unlike the other indicators that move with the change in price.

The pivot points are levels that are essentially determined using the previous day’s high, low, and close price. So, every trading day, we can obtain one set of the pivot point.

What is the pivot point made up of?

There are up to six levels that make up the pivot point levels. One of the levels is the pivot point level, and the rest are support and resistance levels. The six pivot levels are symbolized as follows:

Pivot Point (PP/P)

First Support (S1), First Resistance (R1)

Second Support (S2), Second Resistance (R2)

Third Support (S3), Third Resistance (R3)

Fourth Support (S4), Fourth Resistance (R4)

Fifth Support (S5), Fifth Resistance (R5)

Note that, most of the time, we stick to the levels until S3/R3 because the price does not usually touch the levels beyond it.

How are the pivot levels calculated?

As mentioned, the pivot points are calculated using the close, high, and low of the prior trading day.

For example, the Pivot Point, First Support, and First Resistance are calculated as follows:

PP = (High + Low + Close) / 3

S1 = (2 x PP) – High

R1 = (2 x PP) – Low

Similarly, one can calculate levels until R5/S5. However, these values need not be calculated practically. There are trading platforms that automatically calculate these values.

Types of Pivot Points

There are four types of pivot points based on how the levels are calculated.

  1. Standard
  2. Woodie
  3. Camarilla
  4. Fibonacci

Most of the time, the standard pivot point levels are used.

Strategies using Pivot Points

There are several ways through which one applies pivot points. In our course, we have listed out three strategies.

Range trading strategy

According to this strategy, one can consider buying when the support level of the pivot points coincides with the support level of the range. A similar strategy can be applied for shorting as well.

Breakout Trading Strategy

As the name pretty much suggests, traders can consider going long or short when the price breaks above the resistance or below the support level.

Measuring Sentiment

Traders can use the pivot point level (PP) to determine the trend of the market. If the market breaks above the PP, it indicates a buyer’s market and vice versa.

Summing it up

The pivot point is that indicators that can be used every level of traders from beginners, intermediate to the advance trades. However, this indicator is not a standalone indicator. It must always be used in conjunction with other indicators and tools to have higher odds of favoring you. We hope you enjoyed this series on pivot points. Happy trading!

Categories
Ichimoku

Ichimoku Strategy #2 – K-Cross, The Day Trading Strategy

The Kijun-Sen Crossover (Crossunder) Strategy is the second in my series over Ichimoku Kinko Hyo. There are two trades setups provided for the long and short side of a market. This strategy also comes from Manesh Patel’s book, Trading with Ichimoku Clouds: The essential guide to Ichimoku Kinko Hyo technical analysis.

Patel called this the day-trading strategy. He warned that this trading strategy has the lowest risk factor out of all of his strategies. The positive expectancy rate is lower, and so being stopped out of trades is a normal consequence of this strategy. He also indicated that the win/loss ratio could be extremely high.

Kijun-Sen Cross Bullish Rules

  1. Price crosses above the Kijun-Sen.
  2. Tenkan-Sen greater than the Kijun-Sen.
    1. If the Tenkan-Sen is less than the Kijun-Sen, then the Tenkan-Sen should be pointing up while the Kijun-Sen is flat.
  3. Chikou Span in open space.
  4. Future Senkout Span B is flat or pointing up.
    1. If Future Senkou Span A is less than Future Senkou Span B, then Future Senkou Span A must be pointing up.
  5. Price, Tenkan-Sen, Kijun-Sen, and Chikou Span should not be in the Cloud. If they are, it should be a thick cloud.
  6. Price not far from the Tenkan-Sen or Kijun-Sen
  7. Optional: Future Cloud is not thick.
K-Cross Strategy Bullish Entry


Kijun-Sen Cross Bearish Rules

  1. Prices cross below the Kijun-Sen.
  2. Tenkan-Sen less than the Kijun-Sen.
    1. If the Tenkan-Sen is less than the Kijun-Sen, then the Tenkan-Sen should be pointing up while the Kijun-Sen is flat.
  3. Chikou Span in open space.
  4. Future Senkou Span B is flat for pointing down.
    1. If Future Senkou Span A is greater than Future Senkou Span B, then Future Senkou Span A must be pointing down.
  5. Price, Tenkan-Sen, Kijun-Sen, and Chikou Span should not be in the Cloud. If they are, it should be a thick Cloud.
  6. Price not far from the Tenkan-Sen or Kijun-Sen
  7. Optional: Future Cloud is not thick.
K-Cross Strategy Bearish Entry


Sources: Péloille Karen. (2017). Trading with Ichimoku: a practical guide to low-risk Ichimoku strategies. Petersfield, Hampshire: Harriman House Ltd.

Patel, M. (2010). Trading with Ichimoku clouds: the essential guide to Ichimoku Kinko Hyo technical analysis. Hoboken, NJ: John Wiley & Sons.

Linton, D. (2010). Cloud charts: trading success with the Ichimoku Technique. London: Updata.

Elliot, N. (2012). Ichimoku charts: an introduction to Ichimoku Kinko Clouds. Petersfield, Hampshire: Harriman House Ltd.

Categories
Forex Basic Strategies Forex Trading Strategies

What Should Know About Trading Ranges Using Support & Resistance?

What is Range trading?

It is said that the market only trends for 30% of the time. So it becomes necessary to have a range trading strategy to take advantage of the other 70% of the time. Range trading is not difficult, but it requires discipline and determination to make most out of it. When a market is trending, it forms a pattern of higher highs and higher lows, in case of an uptrend. The move, in this case, is really strong and is known as an impulsive move. The other type of movement is known as the corrective move, which comes in the form of a pullback. Impulsive moves are stronger than corrective moves.

When the market is making any such moves, it finds itself stuck between a high or low and continues to oscillate between these two points. It means buyers and sellers are equally strong, and this creates a very choppy environment.

Traders now trade these extremes and continue to trade until price breaks out on either of the sides. These two points act as potential support and resistance points, used by traders to place their orders.

In the above chart, we have drawn a few lines from where the market bounced off. The price action in those areas creates many trading opportunities. The instrument in the chart first trends down and then puts up a low (marked by line 1). Initially, you might think it as a downtrend and expect the pattern of lower lows and lower highs to continue.

Then you see the market rally to line 2, from where the market falls back to line 3 but does not fall till line 1. This highlights the fact that the market is no more trending. The market instead could be stuck in a range between line 1 and line 2. These are not ‘defined’ prices. Always consider them as zones with a margin of error both outside and inside the range. A trader will look to position himself/herself at these zones of support and resistance that forms the range.

Why support and resistance?

The price that is stuck between these two extremes has a lot of significance. This is because, at this point, the price can either Stop, Reverse, or Breakout. When you have the right knowledge, it will stop you from simply pushing the buttons and will make you trade with a defined strategy.

Range = Consolidation

A range is nothing but a price consolidation of the overall trend move. It could either end the current trend or cause a reversal. The different price behavior pattern in the range creates many trading opportunities, which can be traded by all types of traders, depending on their risk appetite. Now let’s discuss some important trading strategies using support and resistance of ranges.

Strategy Using Technical Indicators

Using technical indicators to trade can aid your trading strategy. Especially while trading ranges, many indicators can be a part of your trading plan. Here, we have used the Stochastic Indicator as a tool to trade the ranges.

In the above image, the two lines represent the support and resistance of the range formed. When the price reaches the resistance at point 1, the Stochastic enters the overbought area, and the slowdown in momentum is the confirmation signal for a sell. The resistance pushes the price back to support (point 2), but this time the momentum is very strong, hence no entry. The stochastic also does not enter the oversold area clearly. Next time the price goes to resistance with greater momentum, and the Stochastic too does not give an entry signal as it is not in the overbought area. This means one shouldn’t be going short at this point.

Overall, there is only one risk-free trade available in the above chart, and that is at point 1 (short).

Strategy Recap

Firstly, we should be able to see the price at one of the extremes. When that happens, the indicator should show either be at overbought or oversold conditions. The momentum of the price should be an important factor that determines our entry. If we see reversal patterns, this could be the best entry with a good risk to reward ratio. Do not forget to place protective stops much below or above the support and resistance levels, respectively. This will always protect your trades from a false breakout.

When not to buy at support and sell at resistance in ranges

You must have probably heard traders saying that more time a level is tested, the stronger it becomes. This is not true in the case of our range break-out strategy. You need to start paying attention to the price patterns at these ends. If the price has made multiple touches, it could be getting ready for a breakout in the direction of the higher time frame.

The above chart is an example of such a scenario. It shows a range, and at point 1, you can see the strength in the candle as price pushes towards the resistance area. The next push makes the price to consolidate at the extreme. It appears to be a battle between the bulls and bears. It is also making higher lows as a part of the uptrend. Hence a breakout after this point is not surprising.

You don’t want to see the higher lows at the resistance extreme and lower highs at the support extreme.

The resistance could still work, and a reversal could happen, but this type of price action does not give much confidence for shorts. Only aggressive traders may find some entry in that consolidation, for a potential long. They can put a protective stop below the higher low that was formed before the accumulation.

We hope you find this strategy informative. Let us know if you have any questions in the comments below. Cheers!

Categories
Forex Daily Topic Forex Range

Hidden Wisdom Behind Range Measures

People coming to the Forex markets usually learned new vocabulary. The first special words they learn maybe are, margin, profit, risk-reward, and candlestick. Perhaps, afterward, they learn new concepts such as Volatility. Also, along with other technical indicators, they get to know one study called Average True Range. However, later, they forget about it since they usually consider it unimportant.

The Average True Range (ATR) is one way to measure Volatility. Volatility is, as we know, a measure of risk. Therefore, ATR can be used as an estimate of our risk. This measurement is essential for us as traders, especially if we are trading on margin. And I’ll explain why.


What tells the Range?

A range is a measure of the price variation over a period of time. It is measured between the High and the Low of a bar or candlestick. For instance, the range of figure 1 below (a 4H chart) is 357.9 points. If each point/lot were worth $1, a short position started at the Low of the bar would have lost $357.9 in four hours on every lot traded. Conversely, a long position would get this amount of profit.

True Range

True range is similar to a normal Range, but it takes into consideration possible gaps between bars. That happens a lot in assets that do not trade all day. Not always the close of a session matches the open of the next one. A gap may form. A True range accounts for that by considering gaps as part of the range of the bar if the gap is not engulfed by the range.

Average True Range

As we can see, in the figure above, every bar’s range varies depending on the particular price action on the bar. Some bars are impulsive and move considerably. Other bars are corrective, and their range is short.

Therefore, to measure the average price range an average is taken, usually, the 14-period, although traders can change it. Below we show the 10-bar ATR of the Bitcoin.

On this figure, we see that the ATR gets quite high at some point on the left of the figure, and it slowly decreases in waves. That is normal. Assets move in a series of increasing and decreasing volatility waves, which describes the interests and power of buyers and sellers.

Average True Range and Risk.

Retail traders usually have small pockets. The first measure a retail trader should know is how much his account would endure in the event of an adverse excursion.

As an example, let’s examine the EURUSD daily chart. Observing the 10-ATR indicator in the chart below, we see that the maximum level on the chart is 0.01053 and the minimum value is 0.00664. Since we want to assess risk, we are only interested in the maximum value.

Let’s assume that we wanted to trade long one EURUSD contract at $1.1288 and that, on average, our trade takes one day to complete. How much can we assume the price would move in a single day?

If we take the 0.01053 as its daily range value and multiply it by the value of a lot ($100K) we see that the EURUSD price is expected to move about $1,053 per day. We don’t know if that will be in our favor or not, but from the risk perspective, we can see that to be on the safe side we would need at least $1,053 of available margin for every lot traded.

If the average trade, takes 4 or 8 hours instead, we should set the timframe to 4H or 8H and proceed as we did with the daily range.

For not standard durations, we could use the following rule: For each doubling in time, the average range grows by a factor of the square root of 2.

That is handy also to compute the right trade size. Maybe we do not have the required margin level, but just one fourth. Thus, if we still wanted to trade the asset, we should trim down our bet size to one-quarter of the lot.

How much time our stop-loss will endure?

Based on ATR figures, we could assess the validity of a stop-loss level. If the stop-loss size is too short compared to the ATR, it might be wrongly set.

What profits to expect?

We could assess that as well, on average, of course. If the dollar range of an asset is $1,000 in a 4-hour span, we can expect that amount on average in four hours, and $1.410 (√2 * $1,000) on an 8-hour lapse.

Deciding which asset to trade

We could use the True Range to assess which asset is best for trading. Let’s suppose, for instance, that you are undecided about trading Gold (XAU) and Platinum (XPT). So let’s examine them.

Gold:

Spread: 3.2

$Spread cost: $32

Digits: 2

contract size: 100

MAX Daily ATR: 16, $ATR: $1600

Spread cost as Percent of the daily range: 2%

Platinum:

Spread: 12.9

$Spread cost: $129

Digits:2

Contract Size: 100

Max Daily ATR: 22, $ATR $2,200

Spread cost as Percent of the daily range: 5.86%

After these calculations, we can see that it is much wiser to trade Gold, since the costs slice only 2% of the daily range, while Platinum takes almost 5% of the range as costs before break even.