Introduction
A Range is a state of the market where the prices move back and forth between the upper bound and the lower bound. A ranging market is also referred to as a choppy, sideways, or a flat market. Unlike a trend, the prices do not move in one specific direction for a long time. A range on a time frame, when looked on a smaller time frame, the price trends in one direction for a while, reverses its direction, and trends in the opposite direction.
Understanding Support and Resistance
Knowing support and resistance is an essential concept to understand a range. These two terms form the basis of a range.
Support
In simple words, support is the level in the market where the prices tend to go up. It is the region where the buyers are interested to aggressively buy the security, causing the prices to shoot up. In other words, it is an area where there is a high demand for the currency pair. A level can be regarded as support when the price reacts multiple times (with power) from that area.
Resistance
Resistance is a level in the market where the prices tend to drop. It is the price where sellers are willing to sell or short sell the asset. They prevent the market from going higher from a specific level. Resistance is no different from that of supply.
Resistance can be understood in terms of buyers. It is an area in the market where the buyers are not interested in buying at that price as they find it expensive. Since there is no demand from the buyers, the prices drop. And when it drops to the support area, the buyers show up again. Thus, due to a higher demand than supply at the support region, the prices rise.
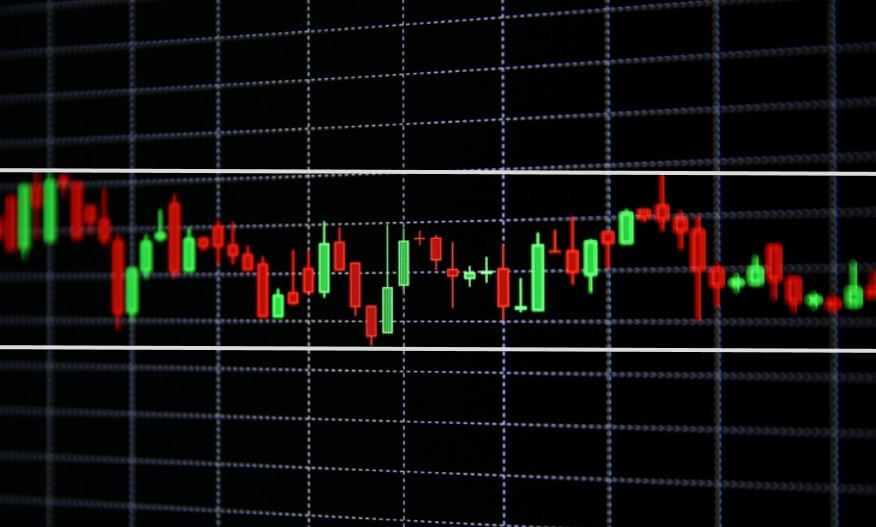
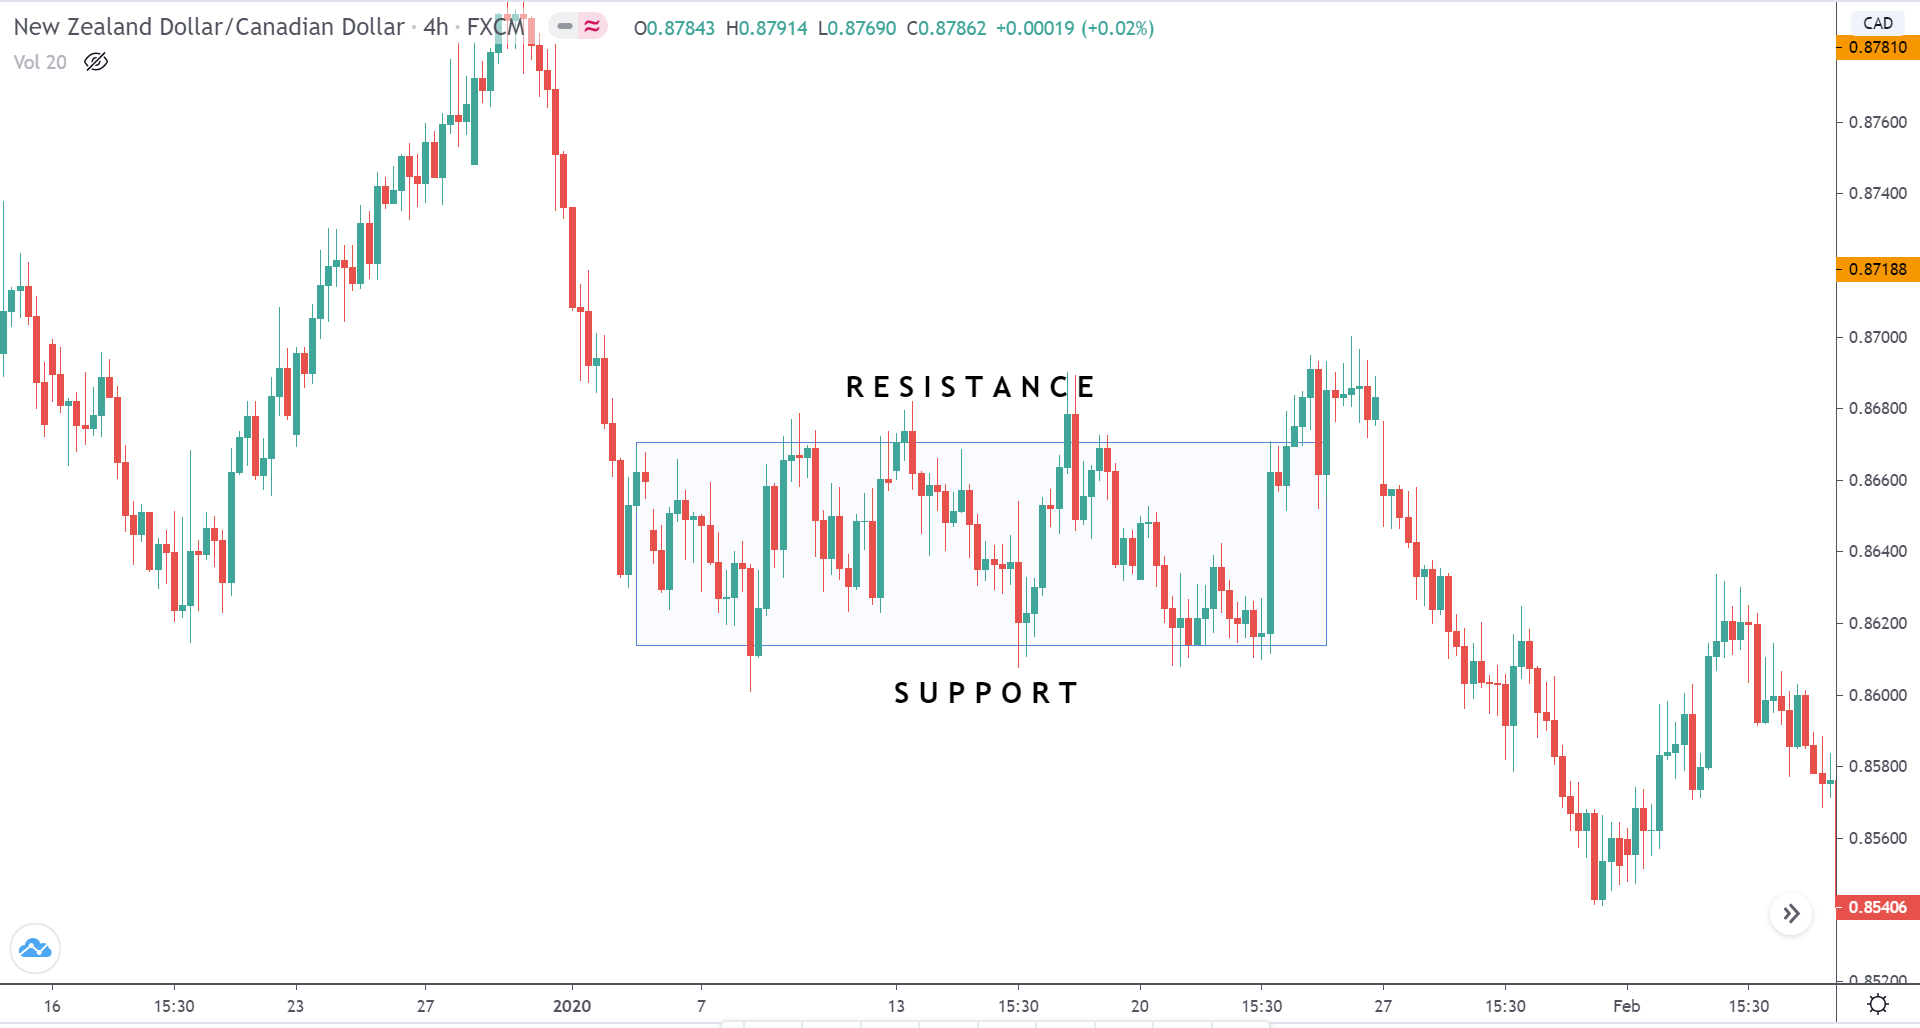
The combination of both support and resistance makes a range. For instance, let’s say the market drops to the $5 mark every time it touches the $10 price. Visually, the market is moving sideways, and such a market is referred to as a range. Here, the $5 price is the support level, and the $10 price is the resistance. A similar example of the same is illustrated below.
ADX indicator for ranging markets
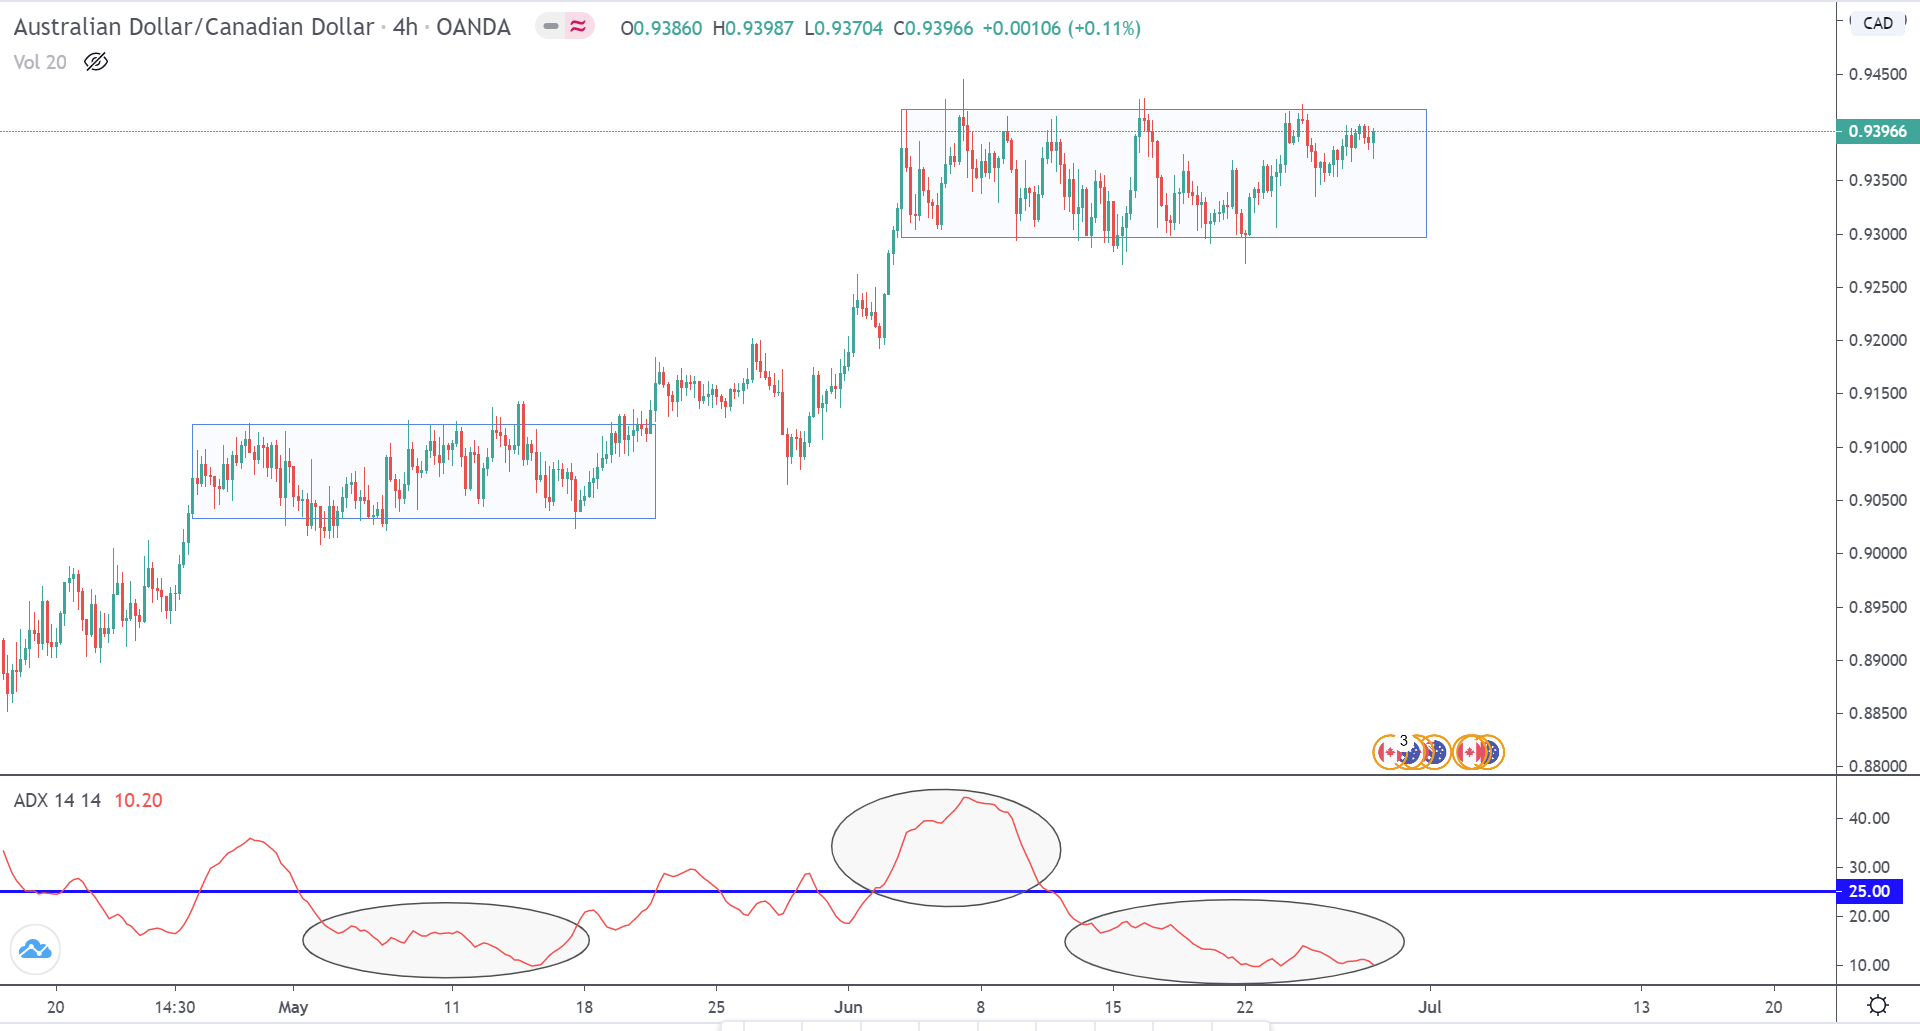
The Average Directional Index indicator can be applied to determine if the market is trending or ranging. A value above 25 indicates that the market is in a strong trending state, while a value of less than 25 signifies that the market is in a consolidation (range) state.
Below is the live chart of AUD/CAD on the 4H time frame. Looking at the chart from a bird’s eye perspective, the market started as an uptrend, held for a while, continued with the same trend, and is currently ranging again. In this sequence, we can observe that the ADX was below the 25-mark line when the market was consolidating, and greater than 25 when it was trending upwards.
We hope you found this lesson on ranging markets interesting and informative. In the next lessons, we shall get into more detail and understand concepts like retracements and reversal. Happy learning!
[wp_quiz id=”78971″]