Categories
Forex Course

162. Currency Crosses Are Trendier Than You Think

Introduction

Currency crosses are a combination of major and commodity currencies without the US Dollar. Therefore, it is an exciting source of earning money when the US dollar moves within a correction. However, the global economic activity has been increasing day by day, and many business activities are happening without the intervention of the US dollar that might make the cross-currency trading trendy.

Is Cross Currency Trading Profitable?

In every international transaction, the US dollar plays a vital role as it is the reserve currency of every country. Moreover, the valuation of commodities and agricultural products are made through the US dollar. Therefore, most of the trading volume in the forex market comes through the US dollar only. As a result, many traders think it is often hard to profit in trading currency pairs where there is no US dollar.

However, the real scenario is not the same. Currency crosses are an extensive way of earning money from the forex market. If the US dollar remains corrective, most US dollar-related pairs will make less movement, which would be difficult to anticipate the price for traders.

On the other hand, if the Eurozone and Australia’s economic activity moves well, the EURAUD pair will provide a decent movement without the intervention of the US dollar. Nowadays, as the businesses are expanding, cross-currency trading became profitable day by day.

Cross Currencies are Trendy

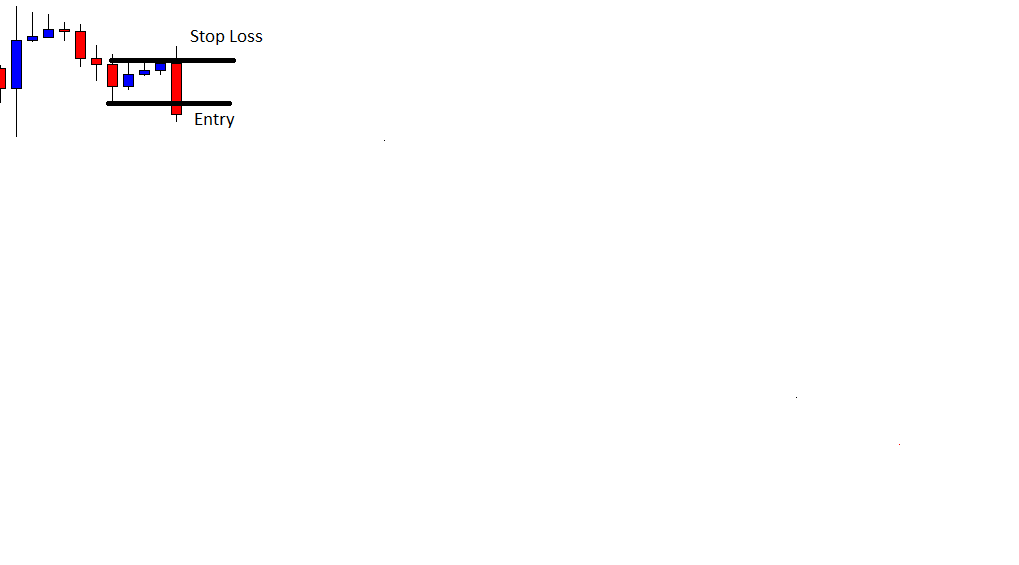
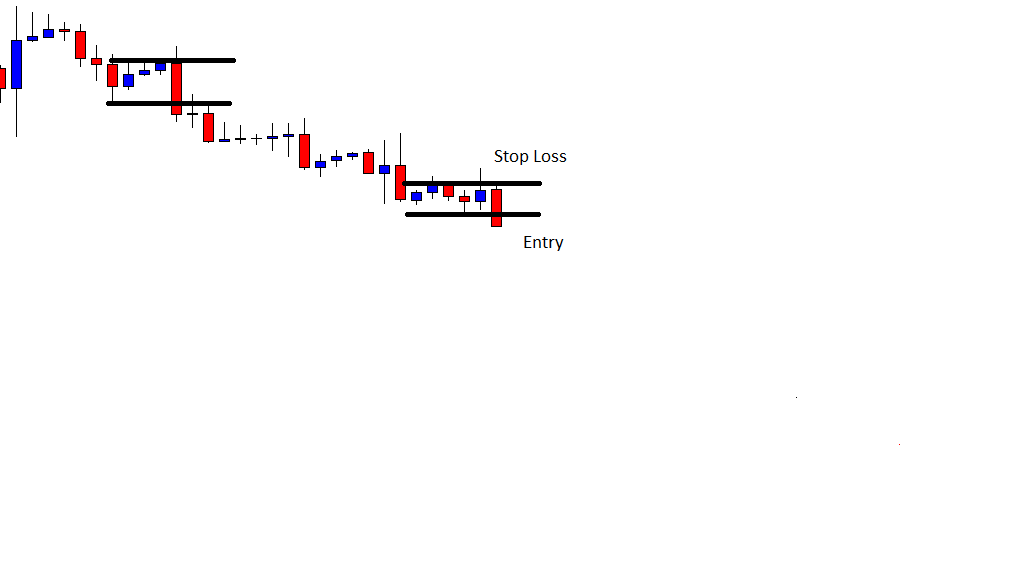
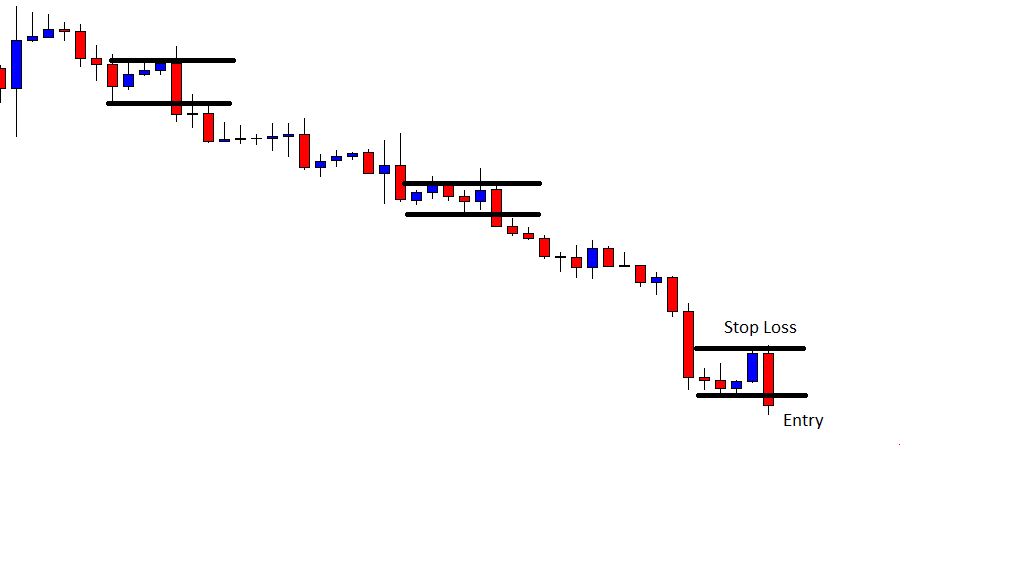
In financial market trading, portfolio diversification is an essential way to ensure maximum safety of the investment. If one trading instrument does not perform well, there are other instruments to make a profit from. It is the best way to keep the investment active even if some trading instrument is moving within a correction. Therefore, it is best to trade in cross currency pairs when the US dollar is moving within the correction.

On the other hand, cross pairs do not require the US trading session every time. If our technical and fundamental analysis allows, we can profit from London and Asian trading session by any cross pairs like GBPJPY, EURAUD, etc.

Summary

In the above section, we have seen how trading in a cross pair can be profitable. Moreover, every currency pair has some unique characteristics that a trader should understand. A trading strategy’s profitability depends on how a trader is implementing the strategy with strong money management.

[wp_quiz id=”86502″]
Categories
Forex Course

137. Differentiating between a Retracement and a Reversal

Introduction

Broadly speaking, there are three states in the market – trend, range, and channel. If we were to go a little more in detail, a market has components like retracement and reversal. Identifying and differentiating between a retracement and reversal is a skill in itself. In this lesson, let’s go and understand what these terms mean and how to differentiate them.

What is Retracement?

Retracement is the terminology usually associated in a trending market. We know that in a trending market, the price moves in one specific direction. For instance, an uptrend is defined as a sequence of higher highs and higher lows. As per the definition of an uptrend, the prices do not keep moving higher and higher continuously.

After trending up to a certain point, the price temporarily moves in the opposite direction. This movement against the original trend is referred to as retracement. Technically, the price action from a higher high to the higher low is called a retracement.

Uptrend Example

Downtrend Example

What is a Reversal?

A reversal can be defined as the overall change in the direction of the market. A market can reverse from an uptrend to a downtrend, or from a downtrend to an uptrend.

Reversal to the Upside

In this type of reversal, initially, the market trends in a downtrend making lower lows and lower highs. Later, the market goes into a transition state where the price typically ranges for a while. In other words, the price stops making lower lows and lows highs. Instead, it makes equal lows or higher lows. Finally, the market starts to trend north by making higher highs and lower lows.

Reversal to the Downside

This reversal happens when the market transits from an uptrend to a downtrend. In an uptrend, the price makes higher highs and higher lows. But, when the trend begins to diminish, the higher highs turn into equal highs, and higher lows start to become equal lows. Finally, when the seller’s pressure comes in, the price begins to make lower lows and lower highs, forming a downtrend. Thus, the complete scenario is referred to as a reversal.

Predicting a possible reversal or retracement in the market is pretty challenging. If you’re stuck in a position and unsure if it is a retracement or a reversal, you may try the following options to manage the trade:

  • Hold onto your positions by keeping the stop loss as it is. If it is a retracement, you can ride the trade, else get stopped if it is a reversal. This is the simplest approach.
  • If you are more inclined towards a reversal than a retracement, then you may close your positions. Based on where the market breaks through, you can look for re-entry. But, you might have to compromise on the risk: reward.
  • You could close the entire position and stay away from the pair and look for other opportunities. This is the safest option possible, especially for conservative traders.
[wp_quiz id=”79176″]
Categories
Forex Course

135. All About The Trending Market

Introduction

In the previous chapter, we understood the different states that exist in the market, which were trends, ranges, and channels. In this and the upcoming lessons, we shall go over each one of the types in detail.

What is a Trending Market?

A trending market is the type of market where the prices move in one specific direction. Of course, the prices change the direction temporarily, but the overall direction will still be in one direction.

Since there are two directions in the market, there are two types of trends: one facing upward and the other facing downward. The former is referred to as an uptrend, and the latter is called a downtrend. Having that said, there are some rules and criteria to confirm a market is trending.

How to Identify a Trend?

There are quite a number of ways to identify and confirm a trend. One can use price action patterns or technical indicators to identify if a market is trending.

Price Action pattern

The concept of highs and lows on the price charts is used to determine if the market is trending upwards or downwards.

Uptrend

In an uptrend, the market makes higher highs and higher lows. Multiple sequences of this pattern confirm that the market is trending up.

Downtrend

In a downtrend, the price makes multiple sets of lower lows and lower highs.

ADX Indicator

Another way to determine if a market is trending is by applying the Average Directional Index (ADX) indicator. It was created by J. Welles Wilder, where the indicator has values between ranging between 0 and 100. The magnitude of the value determines the strength of the trend. The larger the number is, the stronger the trend.

Typically, a value greater than 25 indicates that the market is in a strong trend, either uptrend or downtrend. It is a non-directional indicator, where the value is always positive irrespective of the direction.

Note that ADX is a lagging indicator and does not really determine the future of the market. Thus, it cannot be employed for timing your entries and exits.

Moving Average

Simple moving averages can also be used to determine if the market is in a trending state. Add the 7 period, 20 period, and the 65-period MAs on the price chart. When all three MAs compresses and fans out, and if 7 period MA is below the 20-period MA and 20 period MA is below the 65-period MA, then it confirms that the market is in a downtrend.

Conversely, if the 7 period MA is above the 20 period MA and the 20 period MA is above the 65-period MA, then the market is officially in an uptrend.

These were some of the most popular techniques to identify and verify whether the market is trending. However, they are not strategies to trade a trend. Nonetheless, they can be used to give heads up to any trend trading strategies.

[wp_quiz id=”78831″]
Categories
Forex Daily Topic Forex Price Action

Riding on a Trend is rewarding

The trend is the trader’s friend. To be able to spot the trend and reversal point are the two most important factors of price action trading. In the Forex market on the minor charts, trend changes in a second. However, the trend usually continues on major charts such as the H4, the daily as well as weekly. In today’s lesson, we are going to demonstrate an example of how we can ride on a trend and make most of it.

The chart shows that after making a strong bearish move, the price produces three consecutive bullish corrective candles. It finds its support and creates a bearish engulfing candle closing below consolidation support. The sellers may trigger a short entry right after the last candle closes. Let us proceed to the next chart.

The price heads towards the South and hits 1R. Look at the last candle. The candle comes out as a bearish engulfing candle as well after a long consolidation. However, the sellers on this chart shall skip taking this entry for its shallow consolidation. Let us find out what happens next.

The price again consolidates and produces another bearish engulfing candle. The sellers may trigger another short entry right after the last candle closes. This is the second entry of the trend.

As expected, the price again heads towards the South. This time the price moves with strong bearish momentum. The sellers again make some profit here. Let us proceed to the next chart.

The chart after producing one stronger bearish candle consolidates. This time the chart presents an A+ trade setup with deep consolidation and a strong bearish engulfing candle. The sellers may trigger another short entry here with 1R.

This is what tells the story of the Forex market. This one has been the best entry so far on this chart. However, the price does not head towards the trend’s direction as expected. Nevertheless, it hits the target again (1R). The sellers again make some pips. Altogether, it offers three entries and this is called riding on a trend. By looking at the chart, it seems it may provide more. The buyers must stay out of this chart until it produces a strong bullish reversal.

Meanwhile, the sellers shall keep eying on the chart to go short with the same process. It does not happen so often but when it does, traders shall make most of it. As they say, “Trend is your Friend,” and we have just demonstrated that riding on a trend is very rewarding.

Categories
Forex Market

Finding The Optimal Risk % In Forex Trading

Introduction

Calculating risk is one of the most important parts of Money Mangement. Many novice traders or traders with limited experience won’t be aware of the amount of risk they can tolerate. In this article, we shall focus on determining the appropriate risk % that fits your trading style. The goal of risk management is to gain control over three things:

  • Emotions
  • Leverage
  • Sustenance

Furthermore, by limiting the loss per trade, a trader can ensure that his/her trading capital is not wiped out in one single trade. Having this discipline systematically reduces the loss per trade and provides an opportunity for the trader to re-look at the situation.

Calculating the risk

One can determine the risk based on the following factors:

Win rate

Win rate refers to how often a trader takes profitable trades relative to the trades that result in a loss. Win rate is determined by using the risk-to-reward ratio (RRR) and is calculated by the following formula.

Win rate = 1/(1+RRR)

The above-given formula is also referred to as the Minimum win rate. If any trader is trading with an RRR of 1, then his/her minimum win rate will be 50%. So out of 100 trades, we require a minimum of 50 trades to end as winners to compensate for the losing trades.

This will help a trader in deciding their maximum risk based on the win rate. This formula can also determine if a trade can be taken or not. For example, if someone has a win rate of 25%, he/she will not be able to take trades that have a risk-to-reward ratio of less than 3.

Nature of the market

Depending on the market situation, the risk can vary substantially. In a trending market, like the one in the below chart, risk should be reduced as much as possible by using a stop-loss order. We are recommending this idea as you would most probably be trend trading, and there is no point in risking more than the usual (can be lesser).

Trending Market

In a market that is trapped in a range (below image), the risk is always higher. This means anyone who trades the consolidation market is essentially increasing their risk. This would mean increasing the stop-loss, thereby reducing the risk-to-reward ratio (RRR) of the trade.

Ranging Market

Maintaining a risk of 1% constantly, regardless of the market conditions, will help the traders to sustain the loses and stay in the game even after a series of losing trades. This is a conservative method that reaps fewer rewards, but the risk is certain.

Conclusion

The aim is to achieve some level of consistency in trading by allowing yourself and your trading strategy to fight the evil forces of the market. We would say in all circumstances, a max risk of 1% appears to be the winner if you are a conservative trader. When the risk increases, it is said to impact not only the capital of the trading account but also the psychology of a trader. Hence it is better to keep risk at a bare minimum in times of uncertainty.